REVIEW 3 major objections 6 minor 60 references
Mid-infrared evolution of eta Car from 1968 to 2018
T0 review · 3 major / 6 minor · reviewed 2026-08-14 · deepseek-v4-flash
Pith's one-line read Eta Car's mid-infrared flux stayed steady from 1968 to 2018, so its bolometric luminosity has probably remained constant while the UV-optical brightening reflects declining dust along our line of sight.
desk verdict Transparent new VISIR data and a 50-year SED reconstruction argue for mid-IR stability in Eta Car, but the no-decline conclusion leans heavily on excluding ISO 1996 data without quantitative justification. read the letter →
The pith
A machine-rendered reading of the paper's core claim, the machinery that carries it, and where it could break.
The reading
What carries the argument
The central object is the spectral energy distribution (SED) of the Homunculus nebula, the bipolar shell of dust and gas ejected during Eta Car's nineteenth-century eruption. Because most of Eta Car's optical and ultraviolet light is absorbed by circumstellar dust and re-radiated at infrared wavelengths, the integrated mid-infrared SED acts as a bolometer for the star's luminosity. The argument is carried by comparing epoch-by-epoch photometry at matching wavelengths (4.6, 8–13, and 17–20 $\mu\mathrm{m}$) and by anchoring the comparison to new diffraction-limited VISIR images from 2018 at $0.22^{\prime\prime}$–$0.5^{\prime\prime}$ resolution, together with 2003 TIMMI2 and 2005 VISIR archival data. The paper also corrects a transcription error in an earlier published figure that had overstated the historical 11 $\mu\mathrm{m}$ flux values.
What would settle it
Re-reduce the archived space-based spectra and the published 1970s ground-based photometry with a single, homogeneous calibration and aperture prescription, and compare the resulting fluxes with the 2018 VISIR values; if the re-reduced historical fluxes fall systematically more than about 25 percent below the modern values at 8–20 $\mu\mathrm{m}$, the claimed fifty-year stability is disproved.
Extended reading notes
Core claim
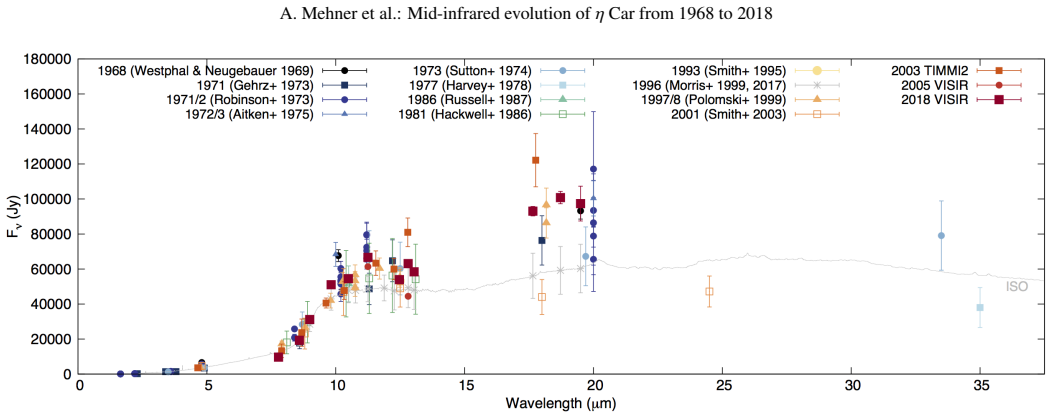
On the paper's own terms, the central discovery is that the mid-infrared flux densities of Eta Car's Homunculus nebula from 8 to 20 $\mu\mathrm{m}$ show no long-term decline since the first available mid-infrared photometry in 1968. The paper reconstructs the spectral energy distribution of the spatially integrated nebula over fifty years and finds that, within the 13–22 percent scatter of the heterogeneous measurements, the flux is stable. It therefore concludes that Eta Car's bolometric luminosity has probably been stable over the last five decades, at about $4.6 \times 10^6\,L_\odot$, and that the ultraviolet and optical brightening since the late 1990s is unrelated to the integrated mid-infrared flux. The paper states that circumstellar dust must be declining in our line of sight only, with short-term flux variations within about 25 percent of the mean levels still possible.
Load-bearing premise
The conclusion depends on treating fifty years of heterogeneous photometry — different telescopes, apertures, calibration standards, and analysis methods, including values read by hand from isophotal maps — as directly comparable within the quoted 13–22 percent uncertainties; if hidden systematic offsets between epochs are larger than that, a real decline of about 25 percent could be missed.
Editorial extensions
If this is right
- Eta Car's ultraviolet and optical brightening since the 1990s is a line-of-sight extinction change, not a change in bolometric luminosity.
- Mass and Eddington-limit estimates for Eta Car remain anchored near $4.6 \times 10^6\,L_\odot$, so earlier claims of a 25 percent luminosity decline over recent decades are not supported.
- The absence of a mid-infrared decline weakens the idea that dust destruction has been reducing circumstellar extinction globally; the clearing is localized to our sightline.
- Short-term variations of up to about 25 percent, possibly tied to the 5.5-year orbital cycle, remain consistent with the data and would require phase-resolved monitoring to confirm.
- The two equatorial dust loops of the 'Butterfly' nebula have expanded at up to $0.01^{\prime\prime}\,\mathrm{yr}^{-1}$ (about 100 km s$^{-1}$) without brightness changes, suggesting an optically thin structure in simple expansion.
Reading between the lines
- If line-of-sight dust clearing is the cause, the ultraviolet and optical brightening should eventually slow or stop once the sightline is largely cleared; continued photometry could set a dissipation timescale for the dusty clump.
- The same epoch-comparison approach could separate luminosity changes from extinction changes in other luminous blue variables and supernova impostors with decades of infrared photometry.
- A homogeneous space-based mid-infrared monitoring campaign across several orbital cycles would test whether the residual roughly 25 percent scatter hides a periodic signal tied to periastron, which the current sparse ground-based data cannot resolve.
- If the integrated mid-infrared flux is a reliable luminosity tracer, a future eruptive episode should produce a mid-infrared brightening, giving observers a cleaner trigger for a true luminosity increase than the UV-optical behavior.
Signed reviews
Editorial analysis
A structured set of objections, weighed in public.
Referee Report
Summary. The paper presents new 2018 VISIR mid-infrared images and photometry of η Car, together with archival VISIR 2005 and TIMMI2 2003 data, and combines these with published photometry from 1968–2005 to reconstruct the 8–20 μm spectral energy distribution of the integrated Homunculus nebula. The central claim is that the mid-IR flux has shown no long-term decline over five decades, implying a stable bolometric luminosity of about 4.6×10^6 Lsun, and that the well-documented UV/optical brightening since the late 1990s must instead be caused by a decrease in circumstellar extinction along the line of sight only. The authors also report expansion of the Butterfly loops and no brightness change in the inner loops between 2005 and 2018. The paper is transparent about data-quality limitations, explicitly noting the poor TIMMI2 data, ghost-affected 2005 VISIR data, partial saturation of the central core, and the heterogeneity of the historical measurements; however, the no-decline conclusion is built on averages that deliberately exclude the ISO 1996 flux densities, and the robustness of that exclusion is not quantified.
Significance. If the conclusion holds, it rules out large changes in η Car's bolometric luminosity over 50 years, strengthens the interpretation that the observed brightening is a line-of-sight extinction effect, and has direct consequences for Eddington-limit arguments and stellar evolution models. The paper contributes genuinely new, high-angular-resolution mid-IR photometry from 2018 and a careful re-reduction of archival data, and the authors are commendably candid about calibration and detector artifacts. The main weakness is that the central null result depends on the exclusion of the ISO 1996 points and on the comparability of very heterogeneous historical photometry, but neither is treated with a quantitative sensitivity analysis. If the requested statistical and systematic tests are added, the paper would provide a solid and important observational constraint on one of the most luminous stars in the Galaxy.
major comments (3)
- [Sec. 3.1 and Fig. 3 caption] The central null result is constructed from averages that "exclude the lower ISO flux values" (Fig. 3 caption), and the only justification offered in the text is a general statement that the ISO absolute spectro-photometric calibration was hampered by detector non-linearities and memory effects (Sec. 3.1). This is the same ISO 1996 dataset used by Morris et al. (2017) to claim a 25% decline, so excluding it without a quantitative re-calibration makes the no-decline conclusion partly circular. Please provide either a re-reduction of the ISO spectra with a revised absolute calibration, or a sensitivity analysis that includes the ISO points with explicitly inflated systematic errors (e.g., 20–30%) and demonstrates that the inferred secular trend remains consistent with zero. Without this, the paper cannot rule out a real decline of the size previously claimed.
- [Sec. 3.1 and Fig. 2] The historical comparison combines measurements obtained with different apertures, instruments, calibration standards, extraction methods, and even values read by hand from isophotal contour maps (open symbols in Fig. 2). The Fig. 2 caption itself warns that "Calibration uncertainties may be larger than reported." The stated 13–22% scatter is therefore a lower bound on the true epoch-to-epoch uncertainty, and the claim that there is "no evidence for a long-term change" is based on visual inspection rather than a formal statistical test. Please add a trend analysis (e.g., fitting a constant plus a linear term in each wavelength region, adding a per-epoch systematic floor in quadrature) and report the 95% upper limit on a fractional flux decline per decade that the data can exclude. This would convert the null result from a statement about plotted scatter into a quantitative, falsifiable claim.
- [Sec. 3.1 and Sec. 4] The luminosity of about 4.6×10^6 Lsun is derived by combining 1973 near-IR photometry, 2005 and 2018 VISIR photometry, 1978 35–175 μm photometry, and 2010 450/850 μm data, but the SED integration method, the assumed spectral shape between bands, the adopted distance, and the propagated uncertainties are not described. Since the conclusion that "Eta Car's luminosity has thus probably been stable" is a central scientific claim, please specify how the SED was integrated or modeled, and quantify the systematic error budget including the distance dependence. This would also clarify how a 25% change in luminosity would manifest in the integrated flux and whether the data are sensitive to it.
minor comments (6)
- [Table 1] Table 1 lists formal errors such as 9648 ± 30 Jy, which are far smaller than the stated 10% (N-band) and 20% (Q-band) systematic calibration limits; please quote errors with one significant figure and add the systematic floor in quadrature or state it separately.
- [Fig. 2 and Fig. 3] The orbital phases of the individual measurements are not given, although the paper discusses possible orbital-phase variations; please add the orbital phase of each epoch or include a supplementary table.
- [Abstract and Sec. 2] The claim of "the highest angular resolution mid-IR images of η Car to date" is not supported by a quantitative comparison with earlier resolved imaging (e.g., the 2005 VISIR images achieve ~0.35'' resolution); please add a brief comparison with previously published angular resolutions.
- [Acknowledgements] The procedure used to "calculate the areas in isophotal contour maps" with SketchAndCalc is not described; please state how the contour integration was performed and quantify the resulting uncertainty, as these open-symbol points enter the light curve.
- [References] There are typographical errors in the reference list, e.g., "V ol." in the entries for Conti (1997), Nota & Lamers (1997), and Rigaut & Gehring (1995); please proofread the reference formatting.
- [Sec. 3.2] The sentence "The 4 − 8 μm flux also shows no long-term variation (Russell et al. 1987; Figure 3)" is not fully supported by Figure 3, whose M-band panel has very sparse coverage; please qualify the claim to reflect the limited number of epochs.
Circularity Check
No significant circularity; the central claim rests on independent historical and new VISIR photometry, with the ISO exclusion best treated as a data-quality judgment rather than a circular step.
full rationale
The paper's claimed derivation chain is an observational comparison rather than a model calculation. The 2018 VISIR fluxes are calibrated against an independent standard star (HD89682), and the historical comparison uses published photometry from many independent groups (Westphal & Neugebauer 1969; Gehrz et al. 1973; Robinson et al. 1973; Sutton et al. 1974; Harvey et al. 1978; Hackwell et al. 1986; Russell et al. 1987; Smith et al. 1995; Polomski et al. 1999). No parameter is fitted to a subset and then called a prediction, and no result is imported from a self-citation as a uniqueness theorem. The self-citations (Morris et al. 2017; Morris et al. 1999; Weigelt et al. 2016) are contextual or are the target of the paper's disagreement, and the refutation of the earlier 25% decline claim is supported by independent 2003/2005/2018 data rather than by the self-cited papers themselves. The most serious concern, flagged by the Fig. 3 caption statement that 'averages exclude the lower ISO flux values,' is a disclosed data-quality cut rather than a circular derivation: the no-long-term-decline conclusion is not mathematically equivalent to that cut, and the cut is justified by detector calibration limitations with an independent citation (Van Malderen et al. 2004) plus an orbital-phase argument. Whether that justification is strong enough is a sensitivity and validity question, not a circularity question. The claimed luminosity stability of about 4.6e6 Lsun follows from direct SED integration, so no load-bearing circular step is present.
Assumptions & free parameters
assumptions (4)
- domain assumption The distance to Eta Carinae is 2.3 kpc.
- domain assumption Integrated mid-IR flux (8-20 microns) traces the bolometric luminosity reradiated by dust.
- domain assumption Historical photometry from different instruments and apertures measures the same integrated Homunculus flux.
- ad hoc to paper The lower ISO flux values are not representative of the long-term level and can be excluded from the average.
Cite this review
Pith. "Pith review of Mid-infrared evolution of eta Car from 1968 to 2018." pith.science (2026). https://pith.science/paper/JHVUJLOD
@misc{pith2026190809154,
  author       = {Pith},
  title        = {Pith review of: Mid-infrared evolution of eta Car from 1968 to 2018},
  year         = {2026},
  howpublished = {\url{https://pith.science/paper/JHVUJLOD}},
  note         = {Machine review of arXiv:1908.09154}
}
abstract
Eta Car is one of the most luminous and massive stars in our Galaxy and is the brightest mid-infrared (mid-IR) source in the sky, outside our solar system. Since the late 1990s the central source has dramatically brightened at ultraviolet and optical wavelengths. This might be explained by a decrease in circumstellar dust extinction. We aim to establish the mid-IR flux evolution and further our understanding of the star's ultraviolet and optical brightening. Mid-IR images from $8-20~\mu$m were obtained in 2018 with VISIR at the Very Large Telescope. Archival data from 2003 and 2005 are retrieved from the ESO Science Archive Facility and historical records are collected from publications. We present the highest angular resolution mid-IR images of $\eta$ Car to date at the corresponding wavelengths ($\geq 0.22''$). We reconstruct the mid-IR evolution of the spectral energy distribution of the spatially integrated Homunculus nebula from 1968 to 2018 and find no long-term changes. Eta Car's bolometric luminosity has been stable over the past five decades. We do not observe a long-term decrease in the mid-IR flux densities that could be associated with the brightening at ultraviolet and optical wavelengths, but circumstellar dust must be declining in our line-of-sight only. Short-term flux variations within about 25% of the mean levels could be present.
Figures


Reference graph
Works this paper leans on
-
[1]
Aitken, D. K. & Jones, B. 1975, MNRAS, 172, 141 Artigau, É., Martin, J. C., Humphreys, R. M., et al. 2011, AJ, 141, 202
work page 1975
- [2]
-
[3]
G., Carter, B., et al
Cohen, M., Walker, R. G., Carter, B., et al. 1999, AJ, 117, 1864
1999
-
[4]
Conti, P. S. 1984, in IAU Symposium, V ol. 105, Observational Tests of the Stellar Evolution Theory, ed. A. Maeder & A. Renzini, 233
work page 1984
-
[5]
Conti, P. S. 1997, in PASPC, V ol. 120, Luminous Blue Variables: Massive Stars in Transition, ed. A. Nota & H. Lamers, 387
work page 1997
-
[6]
Cox, P., Mezger, P. G., Sievers, A., et al. 1995, A&A, 297, 168
work page 1995
-
[7]
Damineli, A., Conti, P. S., & Lopes, D. F. 1997, New Astronomy, 2, 107
work page 1997
- [8]
Show all 60 references
-
[9]
1971, MNRAS, 154, 415
Davidson, K. 1971, MNRAS, 154, 415
1971
-
[10]
R., Humphreys, R
Davidson, K., Gull, T. R., Humphreys, R. M., et al. 1999, AJ, 118, 1777
1999
-
[11]
& Humphreys, R
Davidson, K. & Humphreys, R. M. 1997, ARA&A, 35, 1
1997
-
[12]
& Humphreys, R
Davidson, K. & Humphreys, R. M., eds. 2012, ASSL, V ol. 384, Eta Carinae and the Supernova Impostors
2012
-
[13]
M., et al
Davidson, K., Martin, J., Humphreys, R. M., et al. 2005, AJ, 129, 900
2005
-
[14]
& Ostriker, J
Davidson, K. & Ostriker, J. P. 1972, Nature Physical Science, 236, 46
1972
-
[15]
R., Ishibashi, K., & Hillier, D
Davidson, K., Smith, N., Gull, T. R., Ishibashi, K., & Hillier, D. J. 2001, AJ, 121, 1569
2001
-
[16]
Dwarkadas, V . V . & Balick, B. 1998, AJ, 116, 829
1998
-
[17]
1995, ApJ, 441, L77
Frank, A., Balick, B., & Davidson, K. 1995, ApJ, 441, L77
1995
-
[18]
Frew, D. J. 2004, Journal of Astronomical Data, 10
2004
-
[19]
& Leonard, D
Gal-Yam, A. & Leonard, D. C. 2009, Nature, 458, 865
2009
-
[20]
D., Ney, E
Gehrz, R. D., Ney, E. P., Becklin, E. E., & Neugebauer, G. 1973, Astro- phys. Lett., 13, 89
1973
-
[21]
L., Vlahakis, C., Stretch, C
Gomez, H. L., Vlahakis, C., Stretch, C. M., et al. 2010, MNRAS, 401, L48
2010
-
[22]
H., Meynet, G., & Ekström, S
Groh, J. H., Meynet, G., & Ekström, S. 2013, A&A, 550, L7
2013
-
[23]
A., Gehrz, R
Hackwell, J. A., Gehrz, R. D., & Grasdalen, G. L. 1986, ApJ, 311, 380
1986
-
[24]
M., Hoffmann, W
Harvey, P. M., Hoffmann, W. F., & Campbell, M. F. 1978, A&A, 70, 165
1978
-
[25]
Hillier, D. J. & Allen, D. A. 1992, A&A, 262, 153
1992
-
[26]
Humphreys, R. M. & Davidson, K. 1994, PASP, 106, 1025
1994
-
[27]
R., Robinson, G., Mitchell, R
Hyland, A. R., Robinson, G., Mitchell, R. M., Thomas, J. A., & Becklin, E. E. 1979, ApJ, 233, 145 Käufl, H. U., Kerber, F., Asmus, D., et al. 2015, The Messenger, 159, 15
1979
-
[28]
F., Steinz, J
Kessler, M. F., Steinz, J. A., Anderegg, M. E., et al. 1996, A&A, 315, L27
1996
-
[29]
& Vink, J
Kotak, R. & Vink, J. S. 2006, A&A, 460, L5
2006
-
[30]
O., Pel, J
Lagage, P. O., Pel, J. W., Authier, M., et al. 2004, The Messenger, 117, 12
2004
-
[31]
1994, A&A, 290, 819
Langer, N., Hamann, W.-R., Lennon, M., et al. 1994, A&A, 290, 819
1994
-
[32]
I., Gull, T
Madura, T. I., Gull, T. R., Okazaki, A. T., et al. 2013, MNRAS, 436, 3820
2013
-
[33]
1983, A&A, 120, 113
Maeder, A. 1983, A&A, 120, 113
1983
-
[34]
C., Davidson, K., & Koppelman, M
Martin, J. C., Davidson, K., & Koppelman, M. D. 2006, AJ, 132, 2717
2006
-
[35]
J., & Humphreys, R
Mehner, A., Davidson, K., Ferland, G. J., & Humphreys, R. M. 2010, ApJ, 710, 729
2010
-
[36]
2014, A&A, 564, A14
Mehner, A., Ishibashi, K., Whitelock, P., et al. 2014, A&A, 564, A14
2014
-
[37]
W., Gull, T
Morris, P. W., Gull, T. R., Hillier, D. J., et al. 2017, ApJ, 842, 79
2017
-
[38]
W., Waters, L
Morris, P. W., Waters, L. B. F. M., Barlow, M. J., et al. 1999, Nature, 402, 502
1999
-
[39]
& Westphal, J
Neugebauer, G. & Westphal, J. A. 1968, ApJ, 152, L89
1968
-
[40]
& Lamers, H., eds
Nota, A. & Lamers, H., eds. 1997, ASPC, V ol. 120, Luminous Blue Variables: Massive Stars in Transition
1997
-
[41]
Pagel, B. E. T. 1969, Astrophys. Lett., 4, 221
1969
-
[42]
F., Telesco, C
Polomski, E. F., Telesco, C. M., Piña, R. K., & Fisher, R. S. 1999, AJ, 118, 2369
1999
-
[43]
2000, in Proc
Reimann, H.-G., Linz, H., Wagner, R., et al. 2000, in Proc. SPIE, V ol. 4008, Optical and IR Telescope Instrumentation and Detectors, ed. M. Iye & A. F. Moorwood, 1132–1143 Article number, page 5 of 10 A&A proofs: manuscript no. etaCar_VISIR
2000
-
[44]
& Gehring, G
Rigaut, F. & Gehring, G. 1995, in RMxAA, vol. 27, V ol. 2, RMxAA Conf. Ser., ed. V . Niemela, N. Morrell, & A. Feinstein, 27–35
1995
-
[45]
R., & Thomas, J
Robinson, G., Hyland, A. R., & Thomas, J. A. 1973, MNRAS, 161, 281
1973
-
[46]
W., Lynch, D
Russell, R. W., Lynch, D. K., Hackwell, J. A., et al. 1987, ApJ, 321, 937
1987
-
[47]
H., Aitken, D
Smith, C. H., Aitken, D. K., Moore, T. J. T., et al. 1995, MNRAS, 273, 354
1995
-
[48]
D., Hinz, P
Smith, N., Gehrz, R. D., Hinz, P. M., et al. 2003, AJ, 125, 1458
2003
-
[49]
D., Hinz, P
Smith, N., Gehrz, R. D., Hinz, P. M., et al. 2002, ApJ, 567, L77
2002
-
[50]
2018, MNRAS, 474, 4988
Smith, N., Ginsburg, A., & Bally, J. 2018, MNRAS, 474, 4988
2018
-
[51]
J., et al
Smith, N., Li, W., Foley, R. J., et al. 2007, ApJ, 666, 1116
2007
-
[52]
E., & Neugebauer, G
Sutton, E., Becklin, E. E., & Neugebauer, G. 1974, ApJ, 190, L69
1974
-
[53]
S., & Meikle, W
Trundle, C., Kotak, R., Vink, J. S., & Meikle, W. P. S. 2008, A&A, 483, L47 Van Malderen, R., Decin, L., Kester, D., et al. 2004, A&A, 414, 677
2008
-
[54]
F., Scarrot, S
Warren-Smith, R. F., Scarrot, S. M., Murdin, P., & Bingham, R. G. 1978, Mem- orie della Societa Astronomica Italiana, 49, 589
1978
-
[55]
1995, in RMxAA, vol
Weigelt, G., Albrecht, R., Barbieri, C., et al. 1995, in RMxAA, vol. 27, V ol. 2, RMxAA Conf. Ser., ed. V . Niemela, N. Morrell, & A. Feinstein, 11
1995
-
[56]
& Ebersberger, J
Weigelt, G. & Ebersberger, J. 1986, A&A, 163, L5
1986
-
[57]
2016, A&A, 594, A106
Weigelt, G., Hofmann, K.-H., Schertl, D., et al. 2016, A&A, 594, A106
2016
-
[58]
Westphal, J. A. & Neugebauer, G. 1969, ApJ, 156, L45
1969
-
[59]
M., Duncan, R
White, S. M., Duncan, R. A., Chapman, J. M., & Koribalski, B. 2005, in ASP Conf. Ser., V ol. 332, The Fate of the Most Massive Stars, ed. R. Humphreys & K. Stanek, 129
2005
-
[60]
A., Feast, M
Whitelock, P. A., Feast, M. W., Marang, F., & Breedt, E. 2004, MNRAS, 352, 447 Article number, page 6 of 10 A. Mehner et al.: Mid-infrared evolution ofη Car from 1968 to 2018 Appendix A: Mid-IR images with VISIR in 2018 Fig. A.1: VISIR 2018 images ofη Car’s Homunculus nebula. ...
2004
Reviewed August 14, 2026 · model on record in the stance chip above.
Discussion (0). Continue with ORCID to comment.