Replicating Real-World 23-Hz Oscillations Caused by Large Electronic Loads
Pith reviewed 2026-05-20 13:46 UTC · model grok-4.3
The pith
Electromagnetic transient simulations reproduce the 23-Hz oscillations observed near a large electronic load in Texas.
A machine-rendered reading of the paper's core claim, the machinery that carries it, and where it could break.
Core claim
The paper establishes that a representative feedback system for the large electronic load, analyzed through frequency-domain methods, enables electromagnetic transient simulations to reproduce the real-world 23-Hz oscillation event, with the simulated results closely matching the fault recorder data.
What carries the argument
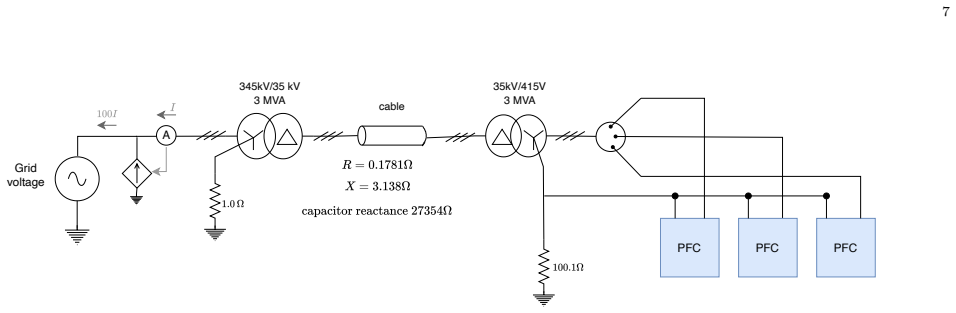
A representative feedback system that models the control dynamics of the large electronic load and its interaction with the surrounding power system.
If this is right
- The feedback system captures the critical features of the 23-Hz oscillation incident.
- Frequency-domain analysis identifies the main factors that influence the oscillations.
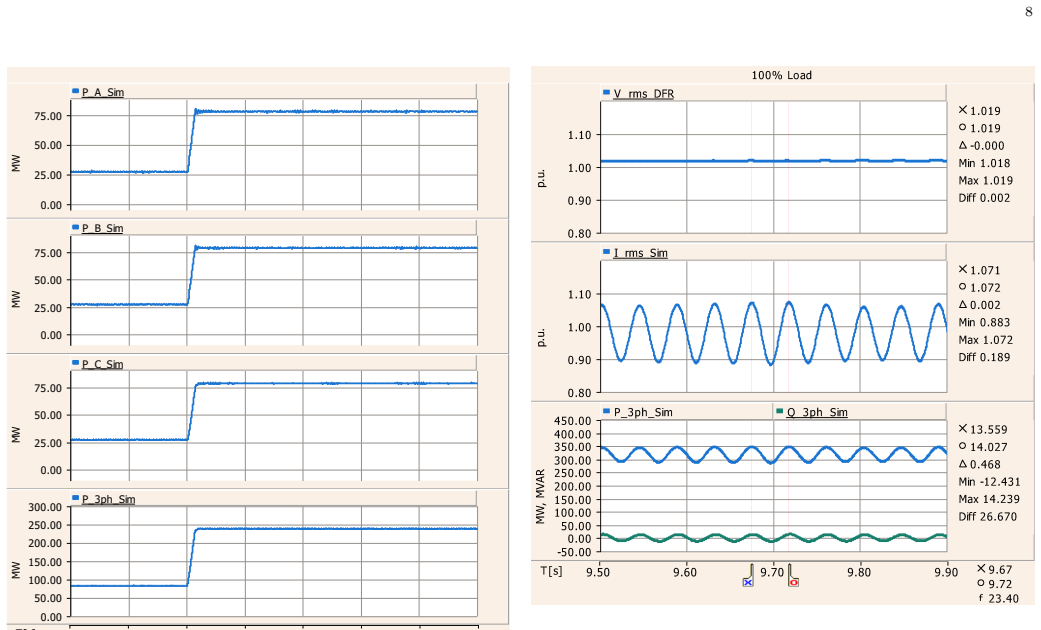
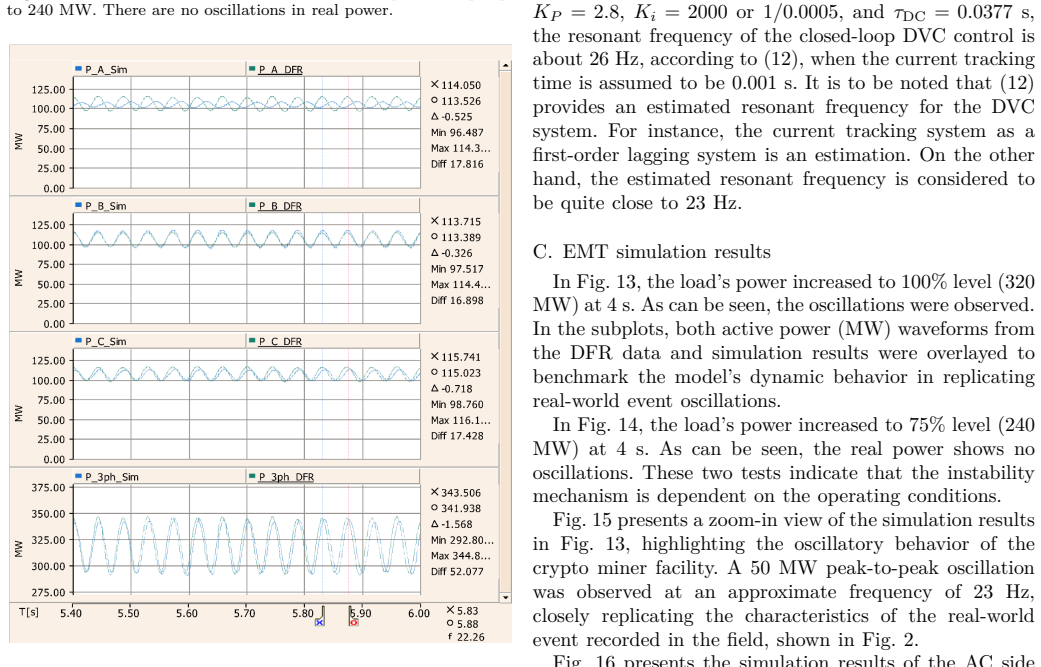
- The oscillations appear once active power reaches approximately 320 MW and disappear as demand decreases.
- EMT simulations provide a practical method to validate the analytical findings against real measurements.
Where Pith is reading between the lines
- The same feedback-system-plus-EMT workflow could be applied to analyze oscillations triggered by other large electronic loads or at different frequencies in future events.
- Grid operators could embed simplified versions of these models in monitoring tools to flag emerging oscillation risks before they reach recorded levels.
- The identified factors offer a starting point for testing control-parameter changes in simulation to reduce oscillation risk without altering physical equipment first.
Load-bearing premise
The representative feedback system developed in the first stage accurately captures the key dynamics and influencing factors of the large electronic load responsible for the 23-Hz oscillations.
What would settle it
Performing the EMT simulation at 320 MW load level and observing that the output waveforms lack 23-Hz oscillations or deviate markedly in amplitude, damping, or timing from the fault recorder traces would falsify the replication result.
Figures


read the original abstract
In 2024, Texas operators observed 23-Hz oscillations in real power measurements close to a large electronic load (LEL). Oscillations emerged when the load's power consumption reached approximately 320 MW level and subsided as the active power demand decreased. The paper aims to analyze the event and reproduce the oscillations using electromagnetic transient (EMT) simulations. In the first stage, a representative feedback system is developed, and frequency-domain analysis is conducted to examine the phenomenon and identify its key influencing factors. Next, detailed EMT simulations are performed to further validate the proposed analytical approach. The results show that the feedback system effectively captures and characterizes the critical features of the 23-Hz oscillation incident. In addition, the EMT simulations successfully reproduce the real-world event, with the simulated results closely matching the fault recorder data.
Editorial analysis
A structured set of objections, weighed in public.
Referee Report
Summary. The paper analyzes 23-Hz oscillations observed in Texas in 2024 near a large electronic load (LEL) at approximately 320 MW active power. It develops a representative feedback system, performs frequency-domain analysis to identify key influencing factors, and conducts EMT simulations that are claimed to reproduce the real-world event with close agreement to fault recorder measurements.
Significance. If the reproduction holds under scrutiny, the work offers a practical modeling framework for low-frequency oscillations induced by large electronic loads, which is increasingly relevant for power system stability as such loads proliferate. The direct use of fault recorder data for validation and the combination of analytical frequency-domain insights with EMT time-domain confirmation represent strengths that could inform operator practices and mitigation strategies.
major comments (2)
- [§3] §3 (representative feedback system): The model is constructed with free parameters whose selection process and sensitivity to the 23-Hz mode are not quantified; this directly affects the claim that the system 'effectively captures and characterizes the critical features' of the oscillation, as the weakest assumption identified is the accuracy of this representative system.
- [§5] §5 (EMT simulation results): While visual agreement with fault recorder data is presented, no quantitative validation metrics (e.g., RMS error, correlation coefficients, or spectral mismatch norms) or full disclosure of model construction steps and exact parameter values are provided, leaving the central reproduction claim plausible but incompletely verifiable.
minor comments (2)
- [Figures] Figure captions and legends should explicitly distinguish between analytical frequency responses, EMT waveforms, and measured data traces to improve clarity.
- [§4] A brief table summarizing the identified key influencing factors from the frequency-domain analysis would aid readers in following the transition to the EMT validation stage.
Simulated Author's Rebuttal
Thank you for the opportunity to respond to the referee's comments on our manuscript. We appreciate the constructive feedback and have addressed each major comment below, indicating where revisions will be made to strengthen the paper.
read point-by-point responses
-
Referee: [§3] §3 (representative feedback system): The model is constructed with free parameters whose selection process and sensitivity to the 23-Hz mode are not quantified; this directly affects the claim that the system 'effectively captures and characterizes the critical features' of the oscillation, as the weakest assumption identified is the accuracy of this representative system.
Authors: We thank the referee for highlighting this important point. The parameters in the representative feedback system were selected to reproduce the observed 23-Hz oscillation frequency based on the fault recorder data and typical control parameters for large electronic loads as found in relevant literature. However, we agree that the selection process and sensitivity analysis were not sufficiently quantified in the original submission. In the revised manuscript, we will add a detailed explanation of the parameter selection process in §3 and include a sensitivity study showing how variations in key parameters affect the 23-Hz mode. This will better support our claim that the system captures the critical features. revision: yes
-
Referee: [§5] §5 (EMT simulation results): While visual agreement with fault recorder data is presented, no quantitative validation metrics (e.g., RMS error, correlation coefficients, or spectral mismatch norms) or full disclosure of model construction steps and exact parameter values are provided, leaving the central reproduction claim plausible but incompletely verifiable.
Authors: We acknowledge that relying solely on visual agreement limits the verifiability of the EMT results. To address this, we will incorporate quantitative validation metrics in the revised §5, including the RMS error, Pearson correlation coefficient between simulated and measured waveforms, and a spectral mismatch measure. We will also provide a table listing the exact parameter values used in the EMT model and expand the description of the model construction steps. While some aspects of the LEL internal controls may remain at a representative level due to data availability, the parameters critical to the oscillation reproduction will be fully disclosed. revision: yes
Circularity Check
No significant circularity detected
full rationale
The paper develops a representative feedback system to characterize the observed 23-Hz oscillations from the large electronic load, performs frequency-domain analysis, and then conducts EMT simulations to reproduce the event. The central validation step compares simulated results directly to independent fault recorder data from the real-world incident. This constitutes standard modeling followed by external benchmarking rather than any self-definitional loop, fitted parameter renamed as prediction, or load-bearing self-citation. No equations or steps in the provided abstract and summary reduce the reproduction claim to its own inputs by construction; the match to external measurements keeps the derivation self-contained.
Axiom & Free-Parameter Ledger
free parameters (1)
- Feedback system parameters
axioms (1)
- domain assumption A representative feedback system can capture the critical features of the 23-Hz oscillation incident for frequency-domain analysis.
Lean theorems connected to this paper
-
IndisputableMonolith/Foundation/RealityFromDistinction.leanreality_from_one_distinction unclear?
unclearRelation between the paper passage and the cited Recognition theorem.
EMT simulations successfully reproduce the real-world event... simulated results closely matching the fault recorder data
What do these tags mean?
- matches
- The paper's claim is directly supported by a theorem in the formal canon.
- supports
- The theorem supports part of the paper's argument, but the paper may add assumptions or extra steps.
- extends
- The paper goes beyond the formal theorem; the theorem is a base layer rather than the whole result.
- uses
- The paper appears to rely on the theorem as machinery.
- contradicts
- The paper's claim conflicts with a theorem or certificate in the canon.
- unclear
- Pith found a possible connection, but the passage is too broad, indirect, or ambiguous to say the theorem truly supports the claim.
Reference graph
Works this paper leans on
-
[1]
P. Gravois, “Engaging with large loads,” 2025. [Online]. A vailable:https://www.esig.energy/engaging-with-large-loads/
work page 2025
-
[2]
Power stabilization for ai training datacenters,
E. Choukse, B. Warrier, S. Heath, L. Belmont, A. Zhao, H. A. Khan, B. Harry, M. Kappel, R. J. Hewett, K. Datta et al., “Power stabilization for ai training datacenters,” arXiv preprint arXiv:2508.14318, 2025. 10
-
[3]
Data center power system stability — part i: Power supply impedance modeling,
J. Sun, M. Xu, M. Cespedes, and M. Kauffman, “Data center power system stability — part i: Power supply impedance modeling,” CSEE Journal of Power and Energy Systems, vol. 8, no. 2, pp. 403–419, 2022
work page 2022
-
[4]
Understanding the inception of 14.7 hz oscillations emerging from a data center,
C. Mishra, L. Vanfretti, J. Delaree Jr, T. Purcell, and K. D. Jones, “Understanding the inception of 14.7 hz oscillations emerging from a data center,” Sustainable Energy, Grids and Networks, p. 101735, 2025
work page 2025
-
[5]
P. Gravois, “Large load oscillation event,” 2025. [Online]. A vailable: https://www.ercot.com/files/docs/2025/ 02/28/LL-Oscillation_LFLTF_Mar2025_Final.pptx?ref= blog.gridstatus.io
work page 2025
-
[6]
Dynamic modeling of crypto-miner load in pscad, version 7.0,
X. Wang, X. Chen, P. Enjeti, F. Lin, A. Yazdanpanah, J. Rose, Y. Cheng, and P. Kansal, “Dynamic modeling of crypto-miner load in pscad, version 7.0,” November 2025. [Online]. A vailable: https://www.ercot.com/about/grit/large-load-modeling
work page 2025
-
[7]
Y. Cheng, L. Fan, J. Rose, S.-H. Huang, J. Schmall, X. Wang, X. Xie, J. Shair, J. R. Ramamurthy, N. Modi et al., “Real- world subsynchronous oscillation events in power grids with high penetrations of inverter-based resources,” IEEE Transactions on Power Systems, vol. 38, no. 1, pp. 316–330, 2023
work page 2023
-
[8]
Voltage control challenges on weak grids with high penetration of wind generation: Ercot experience,
S.-H. Huang, J. Schmall, J. Conto, J. Adams, Y. Zhang, and C. Carter, “Voltage control challenges on weak grids with high penetration of wind generation: Ercot experience,” in 2012 IEEE Power and Energy Society General Meeting. IEEE, 2012, pp. 1–7
work page 2012
-
[9]
Review of high-performance three-phase power-factor correction circuits,
H. Mao, C. Lee, D. Boroyevich, and S. Hiti, “Review of high-performance three-phase power-factor correction circuits,” IEEE Transactions on Industrial Electronics, vol. 44, no. 4, pp. 437–446, 1997
work page 1997
-
[10]
Wind in weak grids: 4 hz or 30 hz oscillations?
L. Fan and Z. Miao, “Wind in weak grids: 4 hz or 30 hz oscillations?” IEEE Transactions on Power Systems, vol. 33, no. 5, pp. 5803–5804, 2018
work page 2018
-
[11]
A. Samanta, S. Majumder, H. Ibrahim, P. Enjeti, and L. Xie, “Electromagnetic transient model of cryptocurrency mining loads for low-voltage ride through assessment in transmission grids,” in 2024 IEEE Power & Energy Society General Meeting (PESGM), 2024, pp. 1–5
work page 2024
-
[12]
Modeling and analysis of single- phase boost converter with power factor correction control,
L. Bao, L. Fan, and Z. Miao, “Modeling and analysis of single- phase boost converter with power factor correction control,” in 2020 52nd North American Power Symposium (NAPS). IEEE, 2021, pp. 1–6
work page 2020
discussion (0)
Sign in with ORCID, Apple, or X to comment. Anyone can read and Pith papers without signing in.