REVIEW 3 major objections 6 minor 103 references
How invisible stellar halos bias our understanding of ultra-faint galaxies
T0 review · 3 major / 6 minor · reviewed 2026-08-06 · deepseek-v4-flash
Pith's one-line read A realistic surface-brightness cut makes simulated ultra-faint galaxies match observations, but the same cut inflates their inferred dark-matter masses by up to tenfold.
desk verdict Clean, honest simulation study showing that ignoring surface brightness limits can bias UFD sizes and Wolf masses by up to an order of magnitude—but the bias magnitude depends on an isophotal proxy that is admittedly approximate. read the letter →
The pith
A machine-rendered reading of the paper's core claim, the machinery that carries it, and where it could break.
The reading
What carries the argument
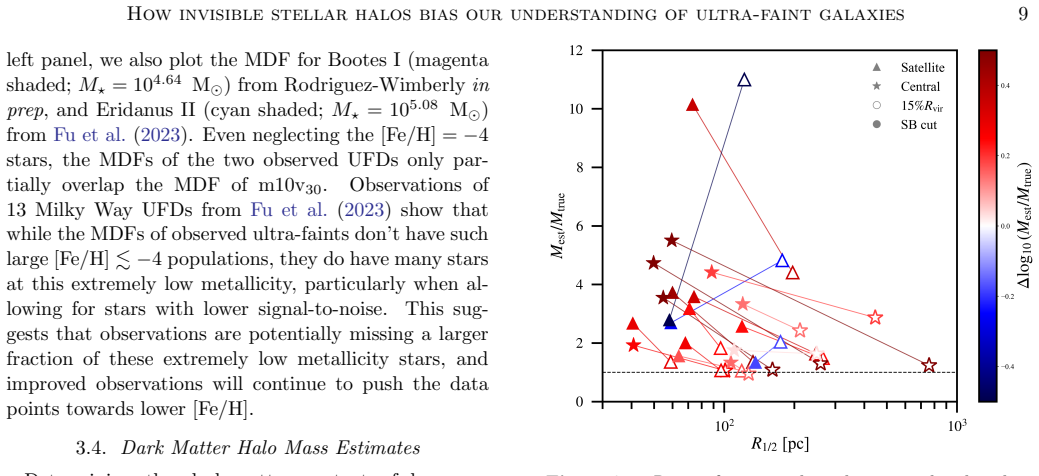
The load-bearing mechanism is the contrast between two ways of defining a galaxy's edge in simulations: $R_{15\%}$, a fixed cut at 15% of the host halo's virial radius, and $R_{\rm SB}$, the isophotal radius at which the projected stellar surface brightness profile drops below $\mu_V \approx 32.5$ mag arcsec$^{-2}$. The second cut is the machine that removes the invisible stellar halo. The Wolf et al. (2010) mass estimator, $M_{\rm est}^{1/2} \approx 930\,(\sigma_{\rm los}/{\rm km\,s^{-1}})^2\,((4/3)R_{1/2}/{\rm pc})\,M_{\odot}$, then converts the truncated half-light radius and line-of-sight velocity dispersion into a dynamical mass. The bias arises because both $R_{1/2}$ and $\sigma_{\rm los}$ fall when the halo is removed, but the true enclosed mass $M_{\rm true}^{1/2}$ falls even faster, so the ratio $M_{\rm est}^{1/2}/M_{\rm true}^{1/2}$ grows from a median of 1.48 to 2.79.
What would settle it
Deep star-count surveys of known ultra-faint Milky Way satellites reaching surface brightnesses near or below $\mu_V \approx 32.5$ mag arcsec$^{-2}$ should either find previously undetected outer stellar populations or fail to find them; if no such extended halos exist, the invisible-halo premise collapses and Wolf-estimator masses recomputed over any recovered stars should not move far from unity.
Extended reading notes
Core claim
The central claim is that ultra-faint galaxies can carry extended, very low-surface-brightness stellar halos that real surveys do not detect, and that ignoring those halos is not a neutral choice. Defined by the conventional simulation edge at 15% of the virial radius, the simulated galaxies are too large, too massive, and too kinematically hot compared with observed ultra-faint dwarfs. Re-defining the edge as the radius where the projected surface brightness falls below $\mu_V \approx 32.5$ mag arcsec$^{-2}$ reduces half-light radii by more than half and pushes velocity dispersions below 5 km s$^{-1}$, producing better agreement with observations. But the same operation shrinks the true enclosed mass within the new half-light radius faster than it shrinks the Wolf et al. (2010) mass estimate, so the estimated-to-true mass ratio worsens from a median of 1.48 to 2.79. The consequence is that the very galaxies that look most like observed ultra-faints are the ones whose inferred dark-matter halo masses are most inflated, by up to an order of magnitude in the most extreme cases.
Load-bearing premise
The simulations are isolated low-mass galaxies without a Milky Way-mass host, so the paper assumes their extended stellar halos are representative of observed Milky Way satellites; if tides from a massive host strip or reshape those halos, the bias could change in magnitude or even direction.
Editorial extensions
If this is right
- Observed ultra-faint dwarfs may be the bright central cores of galaxies that are intrinsically more extended, which would explain why simulations appear too puffy until the low-surface-brightness outskirts are discarded.
- Line-of-sight velocity dispersions below 5 km s$^{-1}$ can occur without tidal stripping by a massive host, so cold kinematics alone does not require a Milky Way-mass perturbing galaxy.
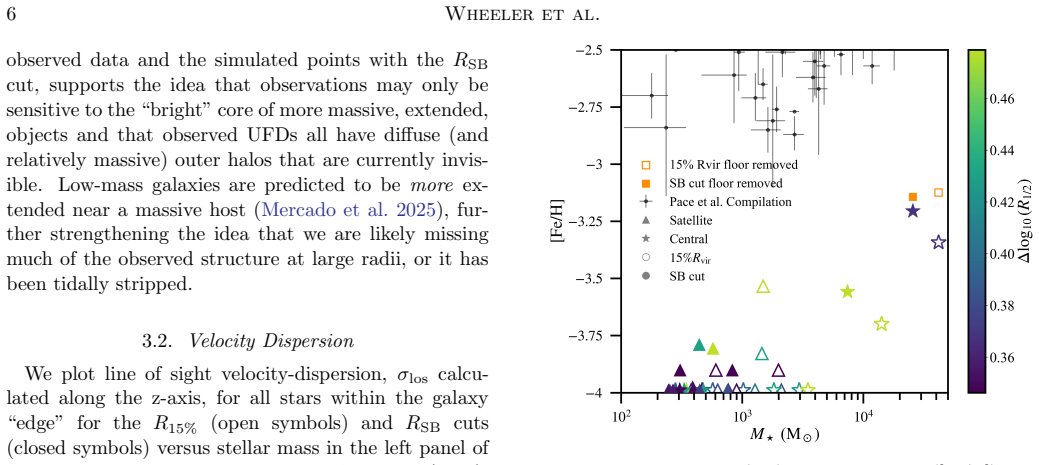
- Metallicities of observed ultra-faints may be biased slightly high because the missing outer stars are preferentially the most metal-poor, though the surface-brightness cut only partially closes the mass-metallicity gap.
- Dynamical masses of ultra-faint galaxies derived with the Wolf estimator should be viewed as upper limits when their stellar halos are not detected, since estimated masses systematically overshoot the true enclosed mass.
- Dark-matter constraints drawn from ultra-faint galaxy kinematics, including limits on warm, self-interacting, or fuzzy dark matter, could shift substantially if the halo-mass overestimate is not corrected.
Reading between the lines
- If real Milky Way satellites have already been tidally stripped by the host galaxy, their extended halos may be gone, and the sign or size of the bias could differ from what the isolated simulation sample predicts.
- A direct observational test is to search for previously undetected, very low-surface-brightness stellar populations around known ultra-faints; detecting them and recomputing masses over the larger radii should lower inferred dark-matter densities.
- Deeper co-added surveys should steadily shrink this bias as the effective detection threshold moves below 32.5 mag arcsec$^{-2}$, a trend that future data can verify.
Editorial analysis
A structured set of objections, weighed in public.
Referee Report
Summary. The paper uses 19 ultra-faint galaxies (M_star ~ 250-40,000 Msun) drawn from three FIRE-2 cosmological zoom-in simulations with baryonic mass resolution of 30 Msun to compare two ways of defining a simulated galaxy's edge: a fixed cut at 15% of the halo virial radius (R_15%) and an isophotal cut at mu_V = 32.5 mag arcsec^-2 (R_SB) assuming M/L = 1. It finds that applying the surface brightness cut reduces stellar masses, half-mass radii, and line-of-sight velocity dispersions, moving the simulated galaxies closer to observed UFDs in the mass-size plane, the sigma_los-M_star plane, and the circular-velocity-versus-half-light-radius plane. It also finds that the Wolf et al. (2010) mass estimator becomes less accurate after the cut, with the median ratio M_est_1/2 / M_true_1/2 increasing from 1.48 to 2.79, and that for the lowest-mass galaxies the inferred dark matter halo masses can be overestimated by an order of magnitude. The paper concludes that surface brightness limits must be taken into account when using UFD mass estimates to constrain dark matter physics or the low-mass threshold of galaxy formation.
Significance. If the result holds, the paper provides a concrete, physically motivated mechanism that can simultaneously reconcile simulated UFDs with observed compact sizes and warn against interpreting UFD dynamical masses at face value. The numerical experiment is clean and internally consistent: the surface brightness threshold is externally motivated, the Wolf estimator is tested against the true simulated enclosed mass rather than being used to define the conclusion, and no fitting to the target observed result is involved. The simulations and initial conditions are publicly available, which is a strength for reproducibility. The main limitations are the small sample (19 galaxies from three volumes), the lack of a Milky Way-mass host for most of the galaxies, and the reliance on a particular isophotal cut as a proxy for how real surveys detect UFDs; these limitations primarily affect the strength of the quantitative claims rather than the internal logic of the experiment.
major comments (3)
- [Sec. 2.1 and Sec. 4.1] The central claim that observed UFD mass estimates are biased high by missing stellar halos depends on R_SB faithfully reproducing the edge set by real surveys. Observed UFDs are discovered as overdensities of resolved stars, so the limiting radius is set by Poisson fluctuations in small numbers of bright RGB stars against foreground and background contamination, not by an integrated isophote at mu_V = 32.5 mag arcsec^-2 with M/L = 1. The paper itself states in Sec. 4.1 that the comparison is 'a reasonably good approximation' and that the authors 'speculate' it is valid. For the lowest-mass simulated galaxies, which contain roughly 10-30 star particles, the isophotal crossing radius may be dominated by counting noise and may not correspond to any measurable observed radius. Because the quantitative ratios in Figs. 7 and 8 are predictions of this particular cut, I ask for a direct validation using mock star-count surveys or mock images with resolved stellar populations, or alternatively a clear reframing of the abstract's caution as conditional on isophotal detection.
- [Sec. 2 and Sec. 4.1] The simulated sample consists of 19 galaxies drawn from three isolated low-mass halos, and Sec. 4.1 explicitly notes that the simulations do not include a Milky Way-mass host galaxy. Observed UFDs are predominantly satellites of the Milky Way or of other Local Group galaxies, where tidal forces and the host potential can strip or alter outer stellar populations. If real UFD outer halos are truncated by tides, the magnitude and possibly the direction of the reported bias could differ from the isolated case. I recommend testing the R_SB analysis in simulations that include a Milky Way-mass host, or at least comparing the radial stellar profiles of these isolated UFDs with those of observed satellites to justify the extrapolation to the observed population.
- [Sec. 3.4, Fig. 8] The order-of-magnitude halo-mass inflation in Fig. 8 is derived by comparing M_est_1/2 to NFW enclosed-mass curves assuming a fixed concentration c = 24 from the extrapolated Neto et al. (2007) relation. The concentration-mass relation at UFD masses is not well constrained, and changing c shifts the inferred M_halo for a given (M_est_1/2, R_1/2) point. Since the abstract's strongest caution concerns real mass estimates, the sensitivity of the Fig. 8 inference to c and to the assumption of an NFW profile should be quantified, for example by repeating the inference over the plausible range of concentration at these masses.
minor comments (6)
- [Sec. 3.1] The phrase 'R 156% cut' appears to be a typo; it should read 'R_SB cut'.
- [Sec. 3.4, Fig. 7] The color coding in Fig. 7 is described in the text as the change in the log mass ratio between the two cuts, but the figure caption and text do not specify the color scale or state explicitly that red points correspond to larger ratios for R_SB and blue points to larger ratios for R_15%; please add this information.
- [Sec. 2.1] The sentence 'this SB threshold is over two orders magnitude lower' is missing 'of'; it should read 'over two orders of magnitude lower'.
- [Sec. 3.3] The text refers to 'inverted age and metallicity gradients' but the subsequent analysis concerns metallicity only; clarify whether age gradients are used, or restrict the discussion to metallicity gradients.
- [References] References to works 'in prep' such as Rodriguez-Wimberly in prep and Murphy et al. in prep should either be completed with available identifiers or clearly marked as private communications in the reference list.
- [Sec. 3.1] The phrase 'The increase in overall surface brightness due to the R 156% cut' is confusing even after correcting the typo, because the cut reduces galaxy sizes and therefore increases the mean surface brightness within the edge; please rephrase to avoid ambiguity.
Circularity Check
No significant circularity: the surface-brightness cut is an externally motivated mock-observation step, and the Wolf-estimator bias is tested against simulated true enclosed masses.
full rationale
The derivation chain is self-contained. The R_SB cut at mu_V = 32.5 mag arcsec^-2 is introduced as an observational detection limit in Section 2.1, not fitted to the mass-estimate outcome. The claims that sizes and M_est move closer to observations are consequences of applying that external selection, and the paper's central warning is that this apparent agreement accompanies a degradation of M_est relative to the independently measured M_true. The Wolf et al. (2010) estimator is used as an external estimator whose accuracy is tested against the simulations' true enclosed masses in Figures 6 and 7, rather than being used to define the conclusion. Prior work by the same group (Wheeler et al. 2019; FIRE-2) supplies the simulation laboratory; this reuse is a data-source citation, not a load-bearing uniqueness theorem or ansatz. The main admitted weakness, stated in Section 4.1 as 'We therefore speculate that the comparisons performed here provide a reasonably good approximation of reality,' is an external-validity caveat about how real UFDs are detected by star counts rather than isophotes, not a circular reduction. No equation or fitted parameter is equivalent to the target result by construction.
Assumptions & free parameters
free parameters (3)
- Surface brightness threshold mu_V =
32.5 mag arcsec^-2
- Stellar mass-to-light ratio M/L =
1 M_sun/L_sun
- Galaxy edge cut R_15% =
15% of virial radius
assumptions (4)
- domain assumption FIRE-2 subgrid physics (star formation, feedback, IMF) accurately models UFD formation
- domain assumption Simulated UFDs are representative of observed UFDs despite lacking a Milky Way-mass host
- domain assumption NFW concentration c=24 extrapolated to UFD masses
- standard math Wolf et al. (2010) estimator assumptions (tracers at r_-3)
Cite this review
Pith. "Pith review of How invisible stellar halos bias our understanding of ultra-faint galaxies." pith.science (2026). https://pith.science/paper/JIAN2VE4
@misc{pith2026250615785,
  author       = {Pith},
  title        = {Pith review of: How invisible stellar halos bias our understanding of ultra-faint galaxies},
  year         = {2026},
  howpublished = {\url{https://pith.science/paper/JIAN2VE4}},
  note         = {Machine review of arXiv:2506.15785}
}
abstract
We explore how a realistic surface brightness detection limit of $\mu_V \approx 32.5$ mag arcsec$^{-2}$ for stars at the edges of ultra-faint galaxies affects our ability to infer their underlying properties. We use a sample of 19 galaxies with stellar masses $\approx 400 - 40,000~{\rm M}_\odot$ simulated with FIRE-2 physics and baryonic mass resolution of $30~M_{\odot}$. The surface brightness cut leads to smaller sizes, lower stellar masses, and lower stellar velocity dispersions than the values inferred without the cut. However, by imposing this realistic limit, our inferred galaxy properties lie closer to observed populations in the mass-size plane, better match observed velocity dispersions as a function of stellar mass, and better reproduce derived circular velocities as a function of half-light radius. For the most massive galaxies in our sample, the surface brightness cut leads to higher mean $\rm [Fe/H]$ values, but the increase is not enough to match the observed MZR. Finally, we demonstrate that the common Wolf et al. (2010) mass estimator is less accurate when the surface brightness cut is applied. For our lowest-mass galaxies, in particular, excluding the low-surface brightness outskirts causes us to overestimate their central dark-matter densities and virial masses. This suggests that attempts to use mass estimates of ultra-faint galaxies to constrain dark-matter physics or to place constraints on the low-mass threshold of galaxy formation must take into account surface brightness limits or risk significant biases.
Figures


Figures from the paper (5 more)



Reference graph
Works this paper leans on
-
[1]
Agertz, O., Pontzen, A., Read, J. I., et al. 2019, Monthly Notices of the Royal Astronomical Society, 491, 1656, doi: 10.1093/mnras/stz3053
-
[2]
Babul, A., & Rees, M. J. 1992, MNRAS, 255, 346, doi: 10.1093/mnras/255.2.346
-
[3]
2020, ApJ, 903, 10, doi: 10.3847/1538-4357/abb5f4
Belland, B., Kirby, E., Boylan-Kolchin, M., & Wheeler, C. 2020, ApJ, 903, 10, doi: 10.3847/1538-4357/abb5f4
-
[4]
Benito, M., H¨ utsi, G., M¨ u¨ ursepp, K., et al. 2025, arXiv e-prints, arXiv:2502.12030, doi: 10.48550/arXiv.2502.12030 Ben ´ ıtez-Llambay, A., Navarro, J. F., Abadi, M. G., et al. 2015, Monthly Notices of the Royal Astronomical Society, 456, 1185, doi: 10.1093/mnras/stv2722
-
[5]
Boylan-Kolchin, M., Bullock, J. S., & Kaplinghat, M. 2011, MNRAS, 415, L40, doi: 10.1111/j.1745-3933.2011.01074.x
arXiv 2011
-
[6]
Brown, J. S., Stanek, K. Z., Holoien, T. W. S., et al. 2019, MNRAS, 484, 3785, doi: 10.1093/mnras/stz258
-
[7]
Bryan, G. L., & Norman, M. L. 1998, ApJ, 495, 80, doi: 10.1086/305262
doi:10.1086/305262 1998
-
[8]
Bullock, J. S., & Boylan-Kolchin, M. 2017, ARA&A, 55, 343, doi: 10.1146/annurev-astro-091916-055313
Show all 103 references
-
[9]
S., Kravtsov, A
Bullock, J. S., Kravtsov, A. V., & Weinberg, D. H. 2000, ApJ, 539, 517, doi: 10.1086/309279
2000 doi
-
[10]
S., Stewart, K
Bullock, J. S., Stewart, K. R., Kaplinghat, M., Tollerud, E. J., & Wolf, J. 2010, ApJ, 717, 1043, doi: 10.1088/0004-637X/717/2/1043
2010 doi
-
[11]
Greco, J. P. 2022, ApJ, 933, 47, doi: 10.3847/1538-4357/ac6fd7 Carton Zeng, Z., Peter, A. H. G., Du, X., et al. 2024, arXiv e-prints, arXiv:2412.14621, doi: 10.48550/arXiv.2412.14621
2022 doi
-
[12]
D., et al
Chiti, A., Frebel, A., Simon, J. D., et al. 2021, Nature Astronomy, 5, 392, doi: 10.1038/s41550-020-01285-w
2021 doi
-
[13]
J., Belokurov, V., Hamren, K
Deason, A. J., Belokurov, V., Hamren, K. M., et al. 2014, MNRAS, 444, 3975, doi: 10.1093/mnras/stu1764 del Pino, A., Aparicio, A., & Hidalgo, S. L. 2015, MNRAS, 454, 3996, doi: 10.1093/mnras/stv2174 Di Cintio, A., Brook, C. B., Macci` o, A. V., et al. 2014, MNRAS, 437, 415, do...
2014 doi
-
[14]
2020, ApJ, 893, 47, doi: 10.3847/1538-4357/ab7eb9
Drlica-Wagner, A., Bechtol, K., Mau, S., et al. 2020, ApJ, 893, 47, doi: 10.3847/1538-4357/ab7eb9
2020 doi
-
[15]
A., Buck, T., Macci` o, A
Dutton, A. A., Buck, T., Macci` o, A. V., et al. 2020, MNRAS, 499, 2648, doi: 10.1093/mnras/staa3028
2020 doi
-
[16]
1992, MNRAS, 256, 43P, doi: 10.1093/mnras/256.1.43P
Efstathiou, G. 1992, MNRAS, 256, 43P, doi: 10.1093/mnras/256.1.43P
1992 doi
-
[17]
R., & Quataert, E
El-Badry, K., Weisz, D. R., & Quataert, E. 2017, MNRAS, 468, 319, doi: 10.1093/mnras/stx436 Faucher-Gigu` ere, C.-A., Lidz, A., Zaldarriaga, M., &
2017 doi
-
[18]
2009, ApJ, 703, 1416, doi: 10.1088/0004-637X/703/2/1416
Hernquist, L. 2009, ApJ, 703, 1416, doi: 10.1088/0004-637X/703/2/1416
2009 doi
-
[19]
2012, MNRAS, 425, 2817, doi: 10.1111/j.1365-2966.2012.21623.x
Gurovich, S. 2012, MNRAS, 425, 2817, doi: 10.1111/j.1365-2966.2012.21623.x
2012
-
[20]
Filion, C., & Wyse, R. F. G. 2021, ApJ, 923, 218, doi: 10.3847/1538-4357/ac2df1
2021 doi
- [21]
-
[22]
W., Weisz, D
Fu, S. W., Weisz, D. R., Starkenburg, E., et al. 2023, ApJ, 958, 167, doi: 10.3847/1538-4357/ad0030
2023 doi
-
[23]
J., Wetzel, A., Hopkins, P
Gandhi, P. J., Wetzel, A., Hopkins, P. F., et al. 2022, MNRAS, 516, 1941, doi: 10.1093/mnras/stac2228
2022 doi
-
[24]
M., Tumlinson, J., et al
Geha, M., Brown, T. M., Tumlinson, J., et al. 2013, ApJ, 771, 29, doi: 10.1088/0004-637X/771/1/29
2013 doi
-
[25]
I., No¨ el, N
Goater, A., Read, J. I., No¨ el, N. E. D., et al. 2024, MNRAS, 527, 2403, doi: 10.1093/mnras/stad3354 Gonz´ alez-Samaniego, A., Bullock, J. S., Boylan-Kolchin, M., et al. 2017, MNRAS, 472, 4786, doi: 10.1093/mnras/stx2322 14Wheeler et al
2024 doi
-
[26]
S., Bullock, J
Graus, A. S., Bullock, J. S., Fitts, A., et al. 2019, Monthly Notices of the Royal Astronomical Society, 490, 1186, doi: 10.1093/mnras/stz2649
2019 doi
-
[27]
R., et al
Heesters, N., M¨ uller, O., Marleau, F. R., et al. 2023, A&A, 676, A33, doi: 10.1051/0004-6361/202346441
2023 doi
-
[28]
2019, PASJ, 71, 94, doi: 10.1093/pasj/psz076
Homma, D., Chiba, M., Komiyama, Y., et al. 2019, PASJ, 71, 94, doi: 10.1093/pasj/psz076
2019 doi
-
[29]
Hopkins, P. F. 2014, ArXiv e-prints. https://arxiv.org/abs/1409.7395
2014 arXiv
-
[30]
F., Wetzel, A., Kereˇ s, D., et al
Hopkins, P. F., Wetzel, A., Kereˇ s, D., et al. 2018a, MNRAS, 480, 800, doi: 10.1093/mnras/sty1690 —. 2018b, MNRAS, 477, 1578, doi: 10.1093/mnras/sty674
-
[31]
D., Sales, L
Jahn, E. D., Sales, L. V., Wetzel, A., et al. 2019, Monthly Notices of the Royal Astronomical Society, 489, 5348, doi: 10.1093/mnras/stz2457
2019 doi
-
[32]
2021, MNRAS, 502, 1, doi: 10.1093/mnras/staa4017
Jeon, M., Bromm, V., Besla, G., Yoon, J., & Choi, Y. 2021, MNRAS, 502, 1, doi: 10.1093/mnras/staa4017
2021 doi
-
[33]
V., Spergel, D
Johnston, K. V., Spergel, D. N., & Hernquist, L. 1995, ApJ, 451, 598, doi: 10.1086/176247
1995 doi
-
[34]
2024, ApJ, 964, 123, doi: 10.3847/1538-4357/ad245b
Jung, M., Roca-F` abrega, S., Kim, J.-H., et al. 2024, ApJ, 964, 123, doi: 10.3847/1538-4357/ad245b
2024 doi
-
[35]
Kauffmann, G., White, S. D. M., & Guiderdoni, B. 1993, MNRAS, 264, 201, doi: 10.1093/mnras/264.1.201
1993 doi
-
[36]
S., Garrison-Kimmel, S., et al
Kelley, T., Bullock, J. S., Garrison-Kimmel, S., et al. 2019, MNRAS, 487, 4409, doi: 10.1093/mnras/stz1553
2019 doi
-
[37]
Y., Peter, A
Kim, S. Y., Peter, A. H. G., & Hargis, J. R. 2018, PhRvL, 121, 211302, doi: 10.1103/PhysRevLett.121.211302
2018 doi
-
[38]
N., Cohen, J
Kirby, E. N., Cohen, J. G., Guhathakurta, P., et al. 2013, ApJ, 779, 102, doi: 10.1088/0004-637X/779/2/102
2013 doi
-
[39]
S., Moreno, J., et al
Klein, C., Bullock, J. S., Moreno, J., et al. 2024, MNRAS, 532, 538, doi: 10.1093/mnras/stae1505
2024 doi
-
[40]
V., Valenzuela, O., & Prada, F
Klypin, A., Kravtsov, A. V., Valenzuela, O., & Prada, F. 1999, ApJ, 522, 82, doi: 10.1086/307643
1999 doi
-
[41]
R., & Knebe, A
Knollmann, S. R., & Knebe, A. 2009, ApJS, 182, 608, doi: 10.1088/0067-0049/182/2/608
2009 doi
- [42]
-
[43]
M., Dunkley, J., et al
Komatsu, E., Smith, K. M., Dunkley, J., et al. 2011, ApJS, 192, 18, doi: 10.1088/0067-0049/192/2/18
2011 doi
-
[44]
W., et al
Koposov, S., Belokurov, V., Evans, N. W., et al. 2008, ApJ, 686, 279, doi: 10.1086/589911
2008 doi
-
[45]
Kravtsov, A. V. 2013, ApJL, 764, L31, doi: 10.1088/2041-8205/764/2/L31
2013 doi
-
[46]
2002, Science, 295, 82, doi: 10.1126/science.1067524
Kroupa, P. 2002, Science, 295, 82, doi: 10.1126/science.1067524
2002 doi
-
[47]
Lazar, A., & Bullock, J. S. 2020, MNRAS, 493, 5825, doi: 10.1093/mnras/staa692
2020 doi
-
[48]
D., et al
Leitherer, C., Schaerer, D., Goldader, J. D., et al. 1999, ApJS, 123, 3, doi: 10.1086/313233
1999 doi
-
[49]
S., Simon, J
Li, T. S., Simon, J. D., Kuehn, K., et al. 2018, ApJ, 866, 22, doi: 10.3847/1538-4357/aadf91
2018 doi
-
[50]
2022, Monthly Notices of the Royal Astronomical Society, 516, 2348, doi: 10.1093/mnras/stac1827
Longeard, N., Jablonka, P., Arentsen, A., et al. 2022, Monthly Notices of the Royal Astronomical Society, 516, 2348, doi: 10.1093/mnras/stac1827
2022 doi
-
[51]
R., Frenk, C
Lovell, M. R., Frenk, C. S., Eke, V. R., et al. 2014, Monthly Notices of the Royal Astronomical Society, 439, 300, doi: 10.1093/mnras/stt2431 Macci` o, A. V., Frings, J., Buck, T., et al. 2017, MNRAS, 472, 2356, doi: 10.1093/mnras/stx2048
2014 doi
-
[52]
F., de Jong, J
Martin, N. F., de Jong, J. T. A., & Rix, H.-W. 2008, ApJ, 684, 1075, doi: 10.1086/590336
2008 doi
-
[53]
J., Bullock, J
Mercado, F. J., Bullock, J. S., Boylan-Kolchin, M., et al. 2021, MNRAS, 501, 5121, doi: 10.1093/mnras/staa3958
2021 doi
-
[54]
J., Moreno, J., Feldmann, R., et al
Mercado, F. J., Moreno, J., Feldmann, R., et al. 2025, ApJ, 983, 93, doi: 10.3847/1538-4357/adbf07
2025 doi
-
[55]
B., van Dokkum, P., Mowla, L., & van der Wel, A
Miller, T. B., van Dokkum, P., Mowla, L., & van der Wel, A. 2019, ApJL, 872, L14, doi: 10.3847/2041-8213/ab0380
2019 doi
-
[56]
1994, Nature, 370, 629, doi: 10.1038/370629a0
Moore, B. 1994, Nature, 370, 629, doi: 10.1038/370629a0
1994 doi
-
[57]
1999, ApJL, 524, L19, doi: 10.1086/312287
Moore, B., Ghigna, S., Governato, F., et al. 1999, ApJL, 524, L19, doi: 10.1086/312287
1999 doi
-
[58]
S., et al
Moreno, J., Danieli, S., Bullock, J. S., et al. 2022, Nature Astronomy, 6, 496, doi: 10.1038/s41550-021-01598-4
2022 doi
-
[59]
C., et al
Mostow, O., Torrey, P., Rose, J. C., et al. 2024, arXiv e-prints, arXiv:2412.09566, doi: 10.48550/arXiv.2412.09566
2024 doi
-
[60]
Mowla, L., van der Wel, A., van Dokkum, P., & Miller, T. B. 2019, ApJL, 872, L13, doi: 10.3847/2041-8213/ab0379 Mu˜ noz, R. R., Geha, M., & Willman, B. 2010, AJ, 140, 138, doi: 10.1088/0004-6256/140/1/138 M¨ uller, O., Marleau, F. R., Heesters, N., et al. 2025, A&A, 693, A44, ...
2019 doi
-
[61]
M., Applebaum, E., et al
Munshi, F., Brooks, A. M., Applebaum, E., et al. 2021, ApJ, 923, 35, doi: 10.3847/1538-4357/ac0db6
2021 doi
-
[62]
M., Christensen, C., et al
Munshi, F., Brooks, A. M., Christensen, C., et al. 2019, ApJ, 874, 40, doi: 10.3847/1538-4357/ab0085
2019 doi
-
[63]
J., Walker, M
Mutlu-Pakdil, B., Sand, D. J., Walker, M. G., et al. 2019, ApJ, 885, 53, doi: 10.3847/1538-4357/ab45ec
2019 doi
-
[64]
O., Gluscevic, V., Driskell, T., et al
Nadler, E. O., Gluscevic, V., Driskell, T., et al. 2024, ApJ, 967, 61, doi: 10.3847/1538-4357/ad3bb1
2024 doi
-
[65]
F., Frenk, C
Navarro, J. F., Frenk, C. S., & White, S. D. M. 1997, ApJ, 490, 493, doi: 10.1086/304888
1997 doi
-
[66]
V., H¨ außler, B., Marchesini, D., et al
Nedkova, K. V., H¨ außler, B., Marchesini, D., et al. 2021, MNRAS, 506, 928, doi: 10.1093/mnras/stab1744
2021 doi
-
[67]
F., Gao, L., Bett, P., et al
Neto, A. F., Gao, L., Bett, P., et al. 2007, MNRAS, 381, 1450, doi: 10.1111/j.1365-2966.2007.12381.x
2007
-
[68]
2012, ApJ, 744, 96, doi: 10.1088/0004-637X/744/2/96 How invisible stellar halos bias our understanding of ultra-faint galaxies15
Okamoto, S., Arimoto, N., Yamada, Y., & Onodera, M. 2012, ApJ, 744, 96, doi: 10.1088/0004-637X/744/2/96 How invisible stellar halos bias our understanding of ultra-faint galaxies15
2012 doi
-
[69]
Orkney, M. D. A., Read, J. I., Rey, M. P., et al. 2021, MNRAS, 504, 3509, doi: 10.1093/mnras/stab1066
2021 doi
-
[70]
Pace, A. B. 2024, arXiv e-prints, arXiv:2411.07424, doi: 10.48550/arXiv.2411.07424 Pe˜ narrubia, J., Navarro, J. F., & McConnachie, A. W. 2008, ApJ, 673, 226, doi: 10.1086/523686
2024 doi
- [71]
-
[72]
P., Andersson, E
Prgomet, M., Rey, M. P., Andersson, E. P., et al. 2022, MNRAS, 513, 2326, doi: 10.1093/mnras/stac1074
2022 doi
-
[73]
H., Kriek, M., Feldmann, R., et al
Price, S. H., Kriek, M., Feldmann, R., et al. 2017, ApJL, 844, L6, doi: 10.3847/2041-8213/aa7d4b
2017 doi
-
[74]
2023, Monthly Notices of the Royal Astronomical Society, 523, doi: 10.1093/mnras/stad1352
Qu, H., Yuan, Z., Doliva-Dolinsky, A., et al. 2023, Monthly Notices of the Royal Astronomical Society, 523, doi: 10.1093/mnras/stad1352
2023 doi
-
[75]
2025, A&A, 694, A17, doi: 10.1051/0004-6361/202452476
Querci, L., Pallottini, A., Branca, L., & Salvadori, S. 2025, A&A, 694, A17, doi: 10.1051/0004-6361/202452476
2025 doi
-
[76]
2023, A&A, 679, A2, doi: 10.1051/0004-6361/202347239
Revaz, Y. 2023, A&A, 679, A2, doi: 10.1051/0004-6361/202347239
2023 doi
-
[77]
P., Pontzen, A., Agertz, O., et al
Rey, M. P., Pontzen, A., Agertz, O., et al. 2019, ApJL, 886, L3, doi: 10.3847/2041-8213/ab53dd Rodriguez Wimberly, M. K., Cooper, M. C., Fillingham, S. P., et al. 2019, MNRAS, 483, 4031, doi: 10.1093/mnras/sty3357
2019 doi
-
[78]
S., et al
Rohr, E., Feldmann, R., Bullock, J. S., et al. 2022, MNRAS, 510, 3967, doi: 10.1093/mnras/stab3625
2022 doi
-
[79]
2021, ApJL, 920, L19, doi: 10.3847/2041-8213/ac2aa3
Sacchi, E., Richstein, H., Kallivayalil, N., et al. 2021, ApJL, 920, L19, doi: 10.3847/2041-8213/ac2aa3
2021 doi
-
[81]
Salpeter, E. E. 1955, ApJ, 121, 161, doi: 10.1086/145971
1955 doi
-
[82]
2023, A&A, 669, A94, doi: 10.1051/0004-6361/202244309
Sanati, M., Jeanquartier, F., Revaz, Y., & Jablonka, P. 2023, A&A, 669, A94, doi: 10.1051/0004-6361/202244309
2023 doi
-
[83]
S., Fattahi, A., et al
Sawala, T., Frenk, C. S., Fattahi, A., et al. 2016, MNRAS, 457, 1931, doi: 10.1093/mnras/stw145
2016 doi
-
[84]
A., et al
Sestito, F., Zaremba, D., Venn, K. A., et al. 2023, MNRAS, 525, 2875, doi: 10.1093/mnras/stad2427
2023 doi
-
[85]
J., White, S
Shen, S., Mo, H. J., White, S. D. M., et al. 2003, MNRAS, 343, 978, doi: 10.1046/j.1365-8711.2003.06740.x
2003
-
[86]
K., & Tormen, G
Sheth, R. K., & Tormen, G. 1999, MNRAS, 308, 119, doi: 10.1046/j.1365-8711.1999.02692.x
1999
-
[87]
Simon, J. D. 2019, ARA&A, 57, 375, doi: 10.1146/annurev-astro-091918-104453
2019 doi
-
[88]
R., et al
Strawn, C., Roca-F` abrega, S., Primack, J. R., et al. 2024, ApJ, 962, 29, doi: 10.3847/1538-4357/ad12cb
2024 doi
-
[89]
2021, ApJL, 914, L10, doi: 10.3847/2041-8213/ac024e
Tarumi, Y., Yoshida, N., & Frebel, A. 2021, ApJL, 914, L10, doi: 10.3847/2041-8213/ac024e
2021 doi
-
[90]
A., Vivas, A
Tau, E. A., Vivas, A. K., & Mart ´ ınez-V´ azquez, C. E. 2024, AJ, 167, 57, doi: 10.3847/1538-3881/ad1509
2024 doi
-
[91]
J., Bullock, J
Tollerud, E. J., Bullock, J. S., Strigari, L. E., & Willman, B. 2008, ApJ, 688, 277, doi: 10.1086/592102
2008 doi
-
[92]
E., et al
Torrealba, G., Belokurov, V., Koposov, S. E., et al. 2018, ArXiv e-prints. https://arxiv.org/abs/1811.04082
2018 arXiv
-
[93]
Trujillo, I., Chamba, N., & Knapen, J. H. 2020, MNRAS, 493, 87, doi: 10.1093/mnras/staa236 van Dokkum, P., Danieli, S., Abraham, R., Conroy, C., &
2020 doi
-
[94]
Romanowsky, A. J. 2019, ApJL, 874, L5, doi: 10.3847/2041-8213/ab0d92 van Dokkum, P. G., Abraham, R., Merritt, A., et al. 2015, ApJL, 798, L45, doi: 10.1088/2041-8205/798/2/L45
2019 doi
-
[95]
C., Geha, M
Vargas, L. C., Geha, M. C., & Tollerud, E. J. 2014, ApJ, 790, 73, doi: 10.1088/0004-637X/790/1/73
2014 doi
-
[96]
A., Stinson, G
Wang, L., Dutton, A. A., Stinson, G. S., et al. 2015, MNRAS, 454, 83, doi: 10.1093/mnras/stv1937
2015 doi
-
[97]
O., Mao, Y.-Y., et al
Wang, Y., Nadler, E. O., Mao, Y.-Y., et al. 2024, ApJ, 976, 119, doi: 10.3847/1538-4357/ad7f4c
2024 doi
-
[98]
C., Sanderson, R
Wetzel, A., Hayward, C. C., Sanderson, R. E., et al. 2023, ApJS, 265, 44, doi: 10.3847/1538-4365/acb99a
2023 doi
-
[99]
R., Hopkins, P
Wetzel, A. R., Hopkins, P. F., Kim, J.-h., et al. 2016, ApJL, 827, L23, doi: 10.3847/2041-8205/827/2/L23
2016 doi
-
[100]
S., et al
Wheeler, C., O˜ norbe, J., Bullock, J. S., et al. 2015, MNRAS, 453, 1305, doi: 10.1093/mnras/stv1691
2015 doi
-
[101]
F., Pace, A
Wheeler, C., Hopkins, P. F., Pace, A. B., et al. 2019, MNRAS, 490, 4447, doi: 10.1093/mnras/stz2887
2019 doi
-
[102]
2002, AJ, 123, 848, doi: 10.1086/338438
Willman, B., Dalcanton, J., Ivezi´ c,ˇZ., et al. 2002, AJ, 123, 848, doi: 10.1086/338438
2002 doi
-
[103]
D., Bullock, J
Wolf, J., Martinez, G. D., Bullock, J. S., et al. 2010, MNRAS, 406, 1220, doi: 10.1111/j.1365-2966.2010.16753.x
2010
-
[104]
2024, Surface Brightness Limit Derivations (SMTN-016), Vera Rubin Observatory Simulations Technical Note
Yoachim, P., & the LSST Galaxies Science Collaboration. 2024, Surface Brightness Limit Derivations (SMTN-016), Vera Rubin Observatory Simulations Technical Note
2024
Reviewed August 6, 2026 · model on record in the stance chip above.
Discussion (0). Continue with ORCID to comment.