Linking the "inner" and "outer" self to mental health and brain networks
Pith reviewed 2026-06-29 02:05 UTC · model grok-4.3
The pith
Individuals with socially desirable profiles show higher life satisfaction and lower default mode network connectivity.
A machine-rendered reading of the paper's core claim, the machinery that carries it, and where it could break.
Core claim
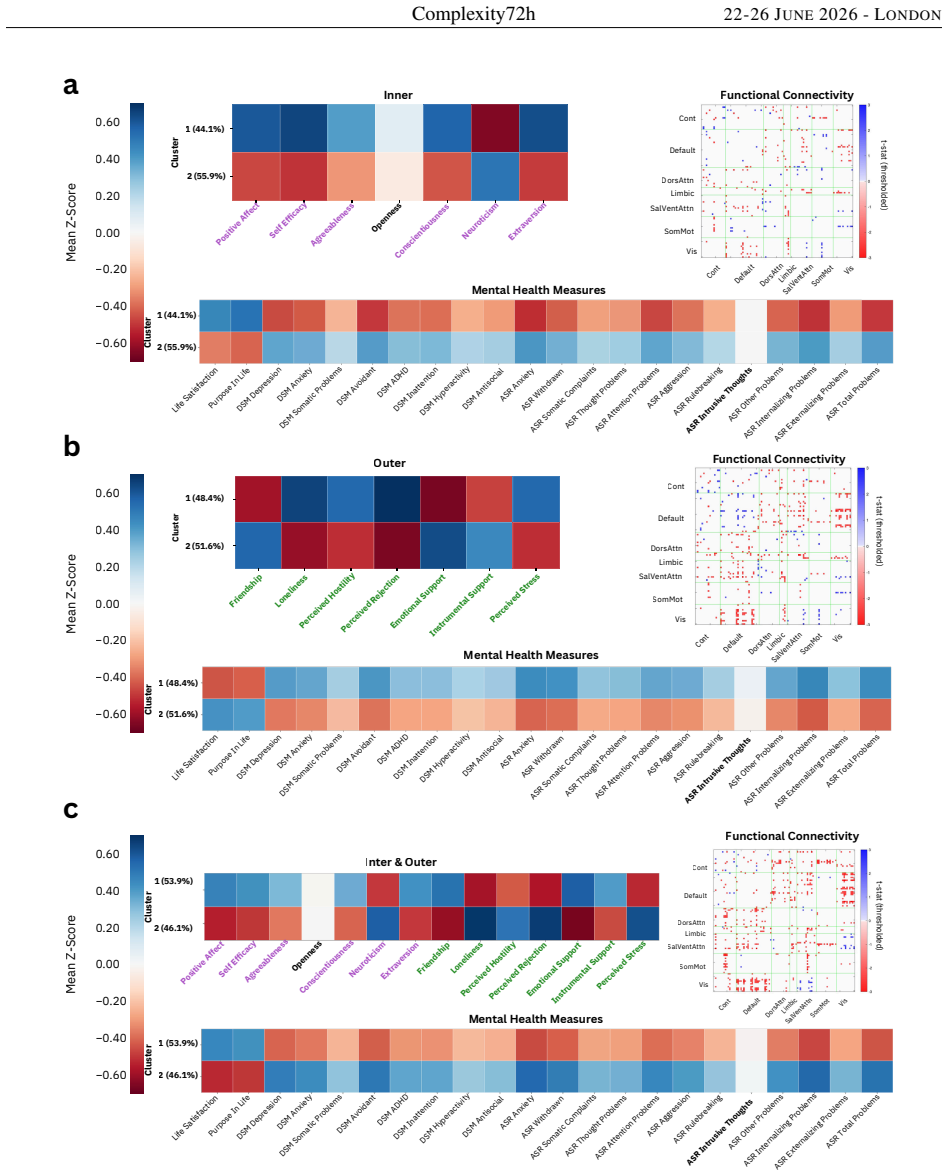
Clustering individuals by social and personality profiles produces a socially desirable group that scores higher on life satisfaction and purpose in life and displays lower functional interconnectivity in the default mode network compared with the other group.
What carries the argument
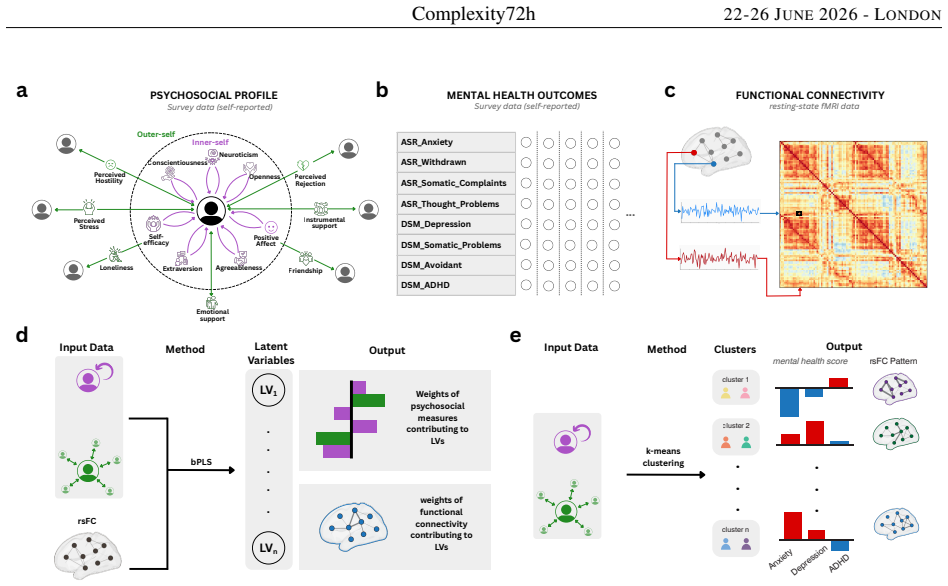
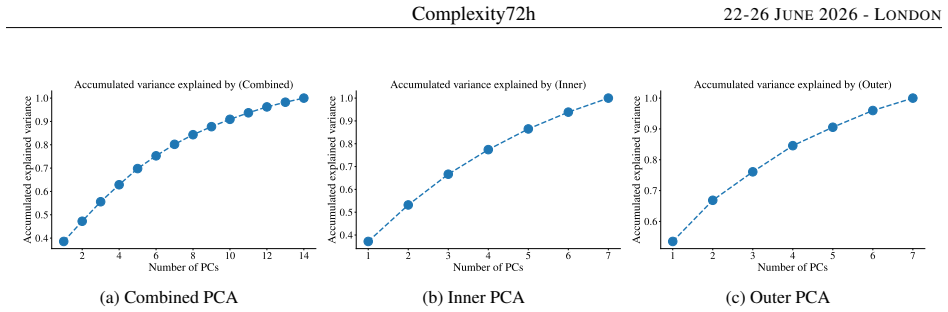
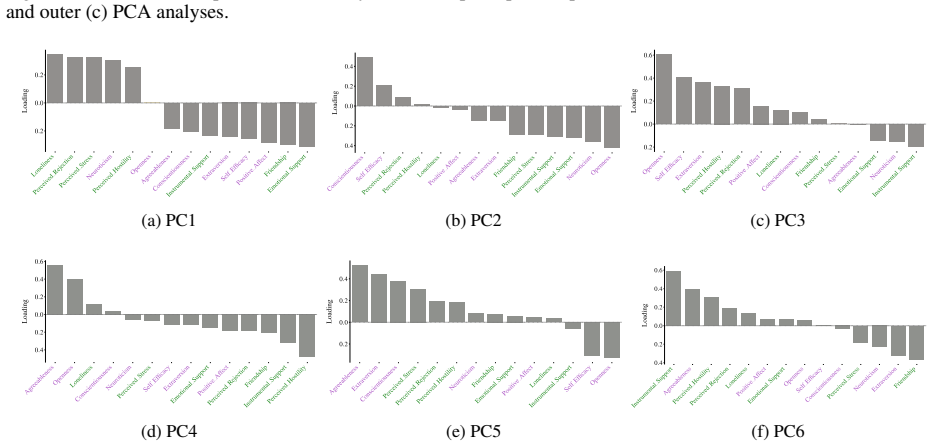
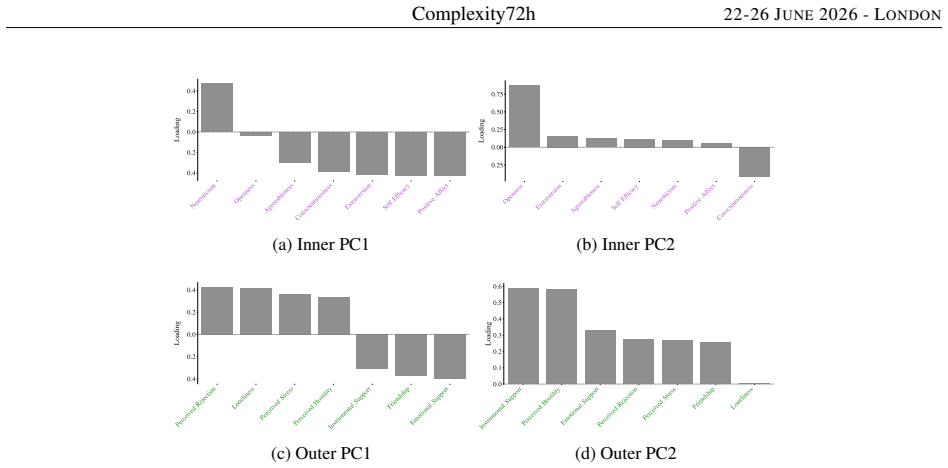
k-means clustering on z-score standardized personality trait and social support measures to define two social profile groups, then compared against mental health scores and resting-state fMRI connectivity matrices.
Load-bearing premise
That the two groups produced by k-means on the chosen variables reflect genuine differences in mental health and brain connectivity rather than artifacts from variable selection, standardization, or the fixed choice of two clusters.
What would settle it
Repeating the k-means analysis with a different number of clusters or an alternative clustering algorithm and finding no corresponding differences in life satisfaction scores or default mode network interconnectivity.
Figures
read the original abstract
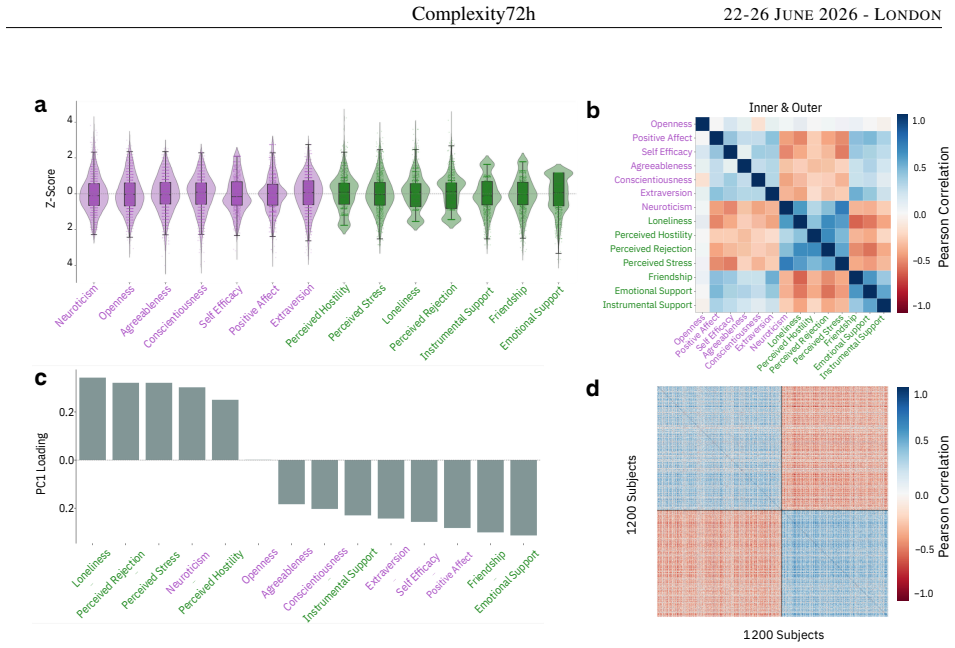
How are psychosocial profiles, mental health, and brain functional connectivity related? Studies have been dedicated to unraveling the associations of social support perception and neural functional connectivity. Additionally, personality traits have been explored by examining brain networks. Research on mental health has been developed using a broad range of methods and different approaches. However, little attention has been devoted to understanding how personality traits and social variables are related, and to what extent these components are reflected in brain functional connectivity and mental health outcomes. In this work, we aim to address these complex relations by using data from the Human Connectome Project, both from surveys and resting-state fMRI. The survey data includes personality traits measures and self-reported social support-related variables, which we will refer to as inner- and outer-self, respectively. It also includes data on mental health outcomes. Using z-score standardized measures, we analyze correlation matrices to evaluate the association between the inner- and outer-self domains. Our results show that the social indicators are more evidently grouped by impact on social experience than by the duality of inner-outer selves. Using a $k$-means clustering algorithm, we separate individuals into two groups according to social profiles. When confronting these results with the mental health outcomes, we show that the more socially desirable cluster exhibited a higher score on positive aspects such as life satisfaction and purpose in life. In the functional brain connectivity, we observe that the cluster with a more socially beneficial profile exhibits lower interconnectivity, especially in the default mode network. The pipeline we present uses a combined analysis of both fMRI and psychosocial variables, which could open the path for more extensive analysis.
Editorial analysis
A structured set of objections, weighed in public.
Referee Report
Summary. The manuscript uses HCP survey and resting-state fMRI data to examine relations among personality traits (inner-self), social support variables (outer-self), mental health outcomes, and functional connectivity. After z-score standardization and correlation analysis, the authors apply k-means clustering (k=2) to the social-profile variables, partition subjects into two groups, and report that the more socially desirable cluster exhibits higher life satisfaction and purpose in life together with lower interconnectivity, particularly in the default mode network.
Significance. If the reported cluster differences survive proper validation and statistical controls, the integrative pipeline could offer a useful template for linking psychosocial profiles to brain networks in large cohorts. The absence of cluster validation, however, leaves the central claims vulnerable to the possibility that the observed mental-health and DMN differences are induced by the arbitrary bipartition rather than reflecting stable data structure.
major comments (2)
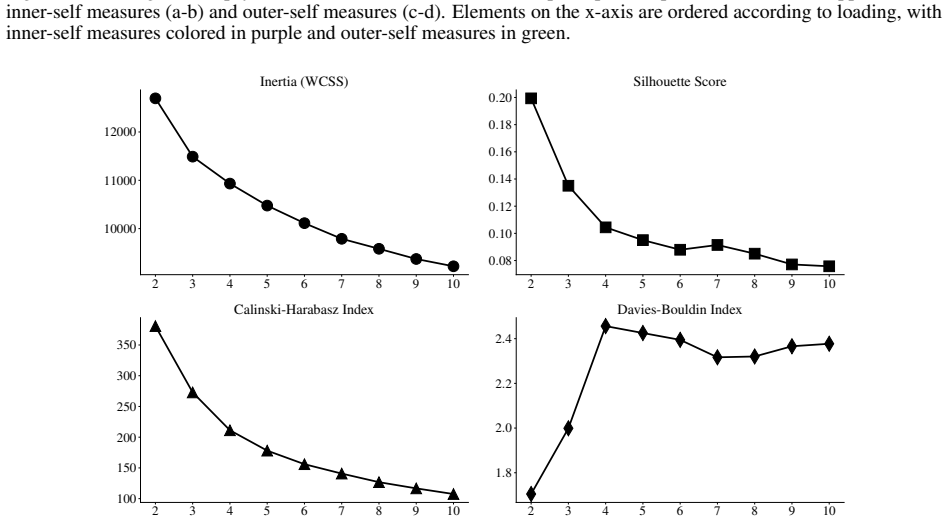
- [Methods (clustering)] Methods section on clustering: the manuscript states that k-means with k=2 is used to separate individuals into two groups according to social profiles, yet supplies no elbow plot, silhouette analysis, gap statistic, or stability check across random initializations or bootstrap samples. Because the subsequent claims about elevated life satisfaction/purpose and reduced DMN interconnectivity rest entirely on this bipartition, the lack of validation makes it impossible to rule out that the group differences are artifacts of the chosen k rather than genuine associations.
- [Results (group comparisons)] Results section on mental-health and connectivity comparisons: no description is given of the statistical tests, multiple-comparison correction, or effect-size measures used to establish the reported cluster differences in life satisfaction, purpose in life, or DMN interconnectivity. In addition, fMRI preprocessing details (motion correction, nuisance regression, parcellation) are omitted, preventing assessment of whether the lower interconnectivity finding is robust.
minor comments (2)
- [Abstract] Abstract: the sentence describing the clustering result does not indicate how the two clusters were labeled 'socially desirable' or 'socially beneficial,' nor does it mention any post-hoc validation of the partition.
- [Methods] The correlation-matrix analysis is presented before the clustering step, but the manuscript does not clarify whether the same variables enter both analyses or whether any variable-selection step precedes clustering.
Simulated Author's Rebuttal
We thank the referee for the constructive comments, which highlight important gaps in methodological reporting and validation. We address each major comment below and will revise the manuscript to incorporate the requested details and analyses.
read point-by-point responses
-
Referee: [Methods (clustering)] Methods section on clustering: the manuscript states that k-means with k=2 is used to separate individuals into two groups according to social profiles, yet supplies no elbow plot, silhouette analysis, gap statistic, or stability check across random initializations or bootstrap samples. Because the subsequent claims about elevated life satisfaction/purpose and reduced DMN interconnectivity rest entirely on this bipartition, the lack of validation makes it impossible to rule out that the group differences are artifacts of the chosen k rather than genuine associations.
Authors: We agree that explicit validation of the k=2 choice is necessary to support the central claims. The bipartition was selected because the correlation structure indicated that social indicators grouped more strongly by overall social desirability than by the inner/outer-self distinction, but this rationale alone is insufficient without quantitative checks. In the revised manuscript we will add elbow plots, silhouette scores, gap statistics, and cluster stability assessments across multiple random initializations and bootstrap resamples. These results will be reported in the Methods and Results sections; if they support k=2 we will retain the bipartition, otherwise we will discuss sensitivity to k. revision: yes
-
Referee: [Results (group comparisons)] Results section on mental-health and connectivity comparisons: no description is given of the statistical tests, multiple-comparison correction, or effect-size measures used to establish the reported cluster differences in life satisfaction, purpose in life, or DMN interconnectivity. In addition, fMRI preprocessing details (motion correction, nuisance regression, parcellation) are omitted, preventing assessment of whether the lower interconnectivity finding is robust.
Authors: The original submission omitted these details. Group differences were assessed with two-sample t-tests, Bonferroni-corrected for the number of mental-health and connectivity measures examined, and effect sizes were computed as Cohen’s d. The resting-state fMRI data were preprocessed following the standard HCP minimal pipeline (motion correction, nuisance regression of six motion parameters plus physiological signals, and Glasser 360-region parcellation). We will insert a dedicated Methods subsection describing the full preprocessing pipeline and will report the exact statistical tests, correction procedure, and effect sizes alongside the cluster-comparison results in the revised Results section. revision: yes
Circularity Check
No circularity: clustering on psychosocial variables followed by independent comparisons to separate mental-health and connectivity measures
full rationale
The paper standardizes inner/outer-self survey variables, computes correlations, applies k-means (k=2) to produce clusters, and then reports differences in separately collected mental-health scores and resting-state fMRI connectivity. No equation, fitted parameter, or self-citation reduces the reported group differences to quantities defined by the clustering step itself. The analysis contains no self-definitional loops, fitted-input predictions, or load-bearing self-citations that would force the central claims by construction. This is the normal non-circular case for an exploratory clustering study.
Axiom & Free-Parameter Ledger
free parameters (1)
- number of clusters k =
2
axioms (2)
- domain assumption Survey items labeled as inner-self (personality traits) and outer-self (social support) validly measure the intended psychological constructs
- domain assumption Differences in resting-state functional connectivity, especially in the default mode network, are meaningfully related to the social profile clusters
Reference graph
Works this paper leans on
-
[1]
doi:10.1111/j.1751- 9004.2011.00400.x
ISSN 1751-9004. doi:10.1111/j.1751- 9004.2011.00400.x. B. B. Biswal, M. Mennes, X.-N. Zuo, S. Gohel, C. Kelly, S. M. Smith, C. F. Beckmann, J. S. Adelstein, R. L. Buckner, S. Colcombe, A.-M. Dogonowski, M. Ernst, D. Fair, M. Hampson, M. J. Hoptman, J. S. Hyde, V . J. Kiviniemi, R. Kötter, S.-J. Li, C.-P. Lin, M. J. Lowe, C. Mackay, D. J. Madden, K. H. Mad...
-
[2]
doi:10.1073/pnas.0911855107. T. Cali´nski and J. Harabász. A dendrite method for cluster analysis.Communications in Statistics, 3(1):1–27,
-
[3]
doi:10.1080/03610927408827101. S. Costa-Cordella, C. Arevalo-Romero, F. J. Parada, and A. Rossi. Social support and cognition: A systematic review. Frontiers in Psychology, V olume 12 - 2021,
-
[4]
ISSN 1664-1078. doi:10.3389/fpsyg.2021.637060. J. M. Cyranowski, N. Zill, R. Bode, Z. Butt, M. A. Kelly, P. A. Pilkonis, J. M. Salsman, and D. Cella. Assessing social support, companionship, and distress: National Institute of Health (NIH) toolbox adult social relationship scales. Health Psychology, 32(3):293–301,
-
[5]
doi:10.1037/a0028586. D. L. Davies and D. W. Bouldin. A cluster separation measure.IEEE Transactions on Pattern Analysis and Machine Intelligence, PAMI-1(2):224–227,
-
[6]
doi:10.1109/TPAMI.1979.4766909. B. Efron and R. J. Tibshirani.An Introduction to the Bootstrap. Chapman and Hall, New York,
-
[7]
ISSN 1097-6256, 1546-1726. doi:10.1038/nn.4135. B. Fischl. Freesurfer.NeuroImage, 62(2):774–781,
-
[8]
doi:10.1016/j.neuroimage.2012.01.021
ISSN 1053-8119. doi:10.1016/j.neuroimage.2012.01.021. R. A. Fisher.Statistical Methods for Research Workers. Oliver and Boyd, Edinburgh,
-
[9]
doi:10.1038/s41598- 023-31909-w. M. D. Fox and M. E. Raichle. Spontaneous fluctuations in brain activity observed with functional magnetic resonance imaging.Nature Reviews Neuroscience, 8(9):700–711,
-
[10]
doi:10.1038/nrn2201. A. Gabarrell-Pascuet, H. García-Mieres, I. Giné-Vázquez, M. V . Moneta, A. Koyanagi, J. M. Haro, and J. Domènech- Abella. The association of social support and loneliness with symptoms of depression, anxiety, and posttraumatic stress during the covid-19 pandemic: A meta-analysis.International Journal of Environmental Research and Publ...
-
[11]
ISSN 1660-4601. doi:10.3390/ijerph20042765. M. F. Glasser, S. N. Sotiropoulos, J. A. Wilson, T. S. Coalson, B. Fischl, J. L. Andersson, J. Xu, S. Jbabdi, M. Webster, J. R. Polimeni, D. C. Van Essen, and M. Jenkinson. The minimal preprocessing pipelines for the human connectome project.NeuroImage, 80:105–124,
-
[12]
doi: 10.1016/j.neuroimage.2013.04.127
ISSN 1053-8119. doi:https://doi.org/10.1016/j.neuroimage.2013.04.127. Mapping the Connectome. M. A. González-Casado, A. S. Teixeira, and A. Sánchez. Evidence of equilibrium dynamics in human social networks evolving in time.Communications Physics, 8(1):227,
-
[13]
doi:10.1038/s42005-025-02156-4. T. O. Gramstad, R. Gjestad, and B. Haver. Personality traits predict job stress, depression and anxiety among junior physicians.BMC Medical Education, 13:150,
-
[14]
doi:10.1186/1472-6920-13-150. R. Hyon, Y . Youm, J. Kim, J. Chey, S. Kwak, and C. Parkinson. Similarity in functional brain connectivity at rest predicts interpersonal closeness in the social network of an entire village.Proceedings of the National Academy of Sciences, 117(52):33149–33160, Dec
-
[15]
ISSN 0027-8424, 1091-6490. doi:10.1073/pnas.2013606117. A. M. Ikotun, A. E. Ezugwu, L. Abualigah, B. Abuhaija, and J. Heming. K-means clustering algorithms: A comprehen- sive review, variants analysis, and advances in the era of big data.Information Sciences, 622:178–210, Apr
-
[16]
ISSN 00200255. doi:10.1016/j.ins.2022.11.139. M. Jenkinson, P. Bannister, M. Brady, and S. Smith. Improved optimization for the robust and accurate lin- ear registration and motion correction of brain images.NeuroImage, 17(2):825–841,
-
[17]
doi:https://doi.org/10.1006/nimg.2002.1132
ISSN 1053-8119. doi:https://doi.org/10.1006/nimg.2002.1132. M. Jenkinson, C. F. Beckmann, T. E. Behrens, M. W. Woolrich, and S. M. Smith. Fsl.NeuroImage, 62(2):782–790,
-
[18]
doi:10.1016/j.neuroimage.2011.09.015
ISSN 1053-8119. doi:10.1016/j.neuroimage.2011.09.015. 20 YEARS OF fMRI. M. E. Kelly, H. Duff, S. Kelly, J. E. McHugh Power, S. Brennan, B. A. Lawlor, and D. G. Loughrey. The impact of social activities, social networks, social support and social relationships on the cognitive functioning of healthy older adults: a systematic review.Systematic Reviews, 6:259,
-
[19]
12 Complexity72h22-26 JUNE2026 - LONDON A
doi:10.1186/s13643-017-0632-2. 12 Complexity72h22-26 JUNE2026 - LONDON A. Krishnan, L. J. Williams, A. R. McIntosh, and H. Abdi. Partial least squares methods for neuroimaging: A tutorial and review.NeuroImage, 56(2):455–475,
-
[20]
doi:10.1016/j.neuroimage.2010.07.034. S. P. Lloyd. Least squares quantization in PCM.IEEE Transactions on Information Theory, 28(2):129–137,
-
[21]
doi:10.1109/TIT.1982.1056489. M. R. Marstrand-Joergensen, M. K. Madsen, D. S. Stenbæk, B. Ozenne, P. S. Jensen, V . G. Frokjaer, G. M. Knudsen, and P. M. Fisher. Default mode network functional connectivity negatively associated with trait openness to experience. Social Cognitive and Affective Neuroscience, 16:950–961,
-
[22]
doi:10.1093/scan/nsab048. R. R. McCrae and P. T. Costa. A contemplated revision of the NEO Five-Factor Inventory.Personality and Individual Differences, 36(3):587–596,
-
[23]
doi:10.1016/S0191-8869(03)00118-1. A. R. McIntosh and N. J. Lobaugh. Partial least squares analysis of neuroimaging data: Applications and advances. NeuroImage, 23(Supplement 1):S250–S263,
-
[24]
doi:10.1016/j.neuroimage.2004.07.020. A. R. McIntosh, F. L. Bookstein, J. V . Haxby, and C. L. Grady. Spatial pattern analysis of functional brain images using partial least squares.NeuroImage, 3(3):143–157,
-
[25]
doi:10.1006/nimg.1996.0016. H. Merritt, J. Faskowitz, M. Z. Gonzalez, and R. F. Betzel. Stability and variation of brain–behavior correlation patterns across measures of social support.Imaging Neuroscience, 2:1–18,
-
[26]
doi:10.1162/imag_a_00133. H. Merritt, D. Rakesh, and R. Betzel. Connection and Context: The Variable Neural Architecture of Social Relationships, Nov
-
[27]
doi:10.31234/osf.io/xvgez_v1. L. Mwilambwe-Tshilobo, T. Ge, M. Chong, M. A. Ferguson, B. Misic, A. L. Burrow, R. M. Leahy, and R. N. Spreng. Loneliness and meaning in life are reflected in the intrinsic network architecture of the brain.Social Cognitive and Affective Neuroscience, 14(4):423–433,
-
[28]
doi:10.1093/scan/nsz021. L. Mwilambwe-Tshilobo, R. Setton, D. Bzdok, G. R. Turner, and R. N. Spreng. Age differences in func- tional brain networks associated with loneliness and empathy.Network Neuroscience, 7(2):496–521,
-
[29]
doi:10.1162/netn_a_00293. M. Noonan, R. Mars, J. Sallet, R. Dunbar, and L. Fellows. The structural and functional brain networks that support hu- man social networks.Behavioural Brain Research, 355:12–23,
-
[30]
ISSN 0166-4328. doi:10.1016/j.bbr.2018.02.019. SI: MCC
-
[31]
doi:10.1007/s00429-018-1651-z. L. Passamonti, A. Terracciano, R. Riccelli, G. Donzuso, A. Cerasa, M. Vaccaro, F. Novellino, F. Fera, and A. Quattrone. Increased functional connectivity within mesocortical networks in open people.NeuroImage, 104:301–309,
-
[32]
doi:10.1016/j.neuroimage.2014.09.017
ISSN 1053-8119. doi:10.1016/j.neuroimage.2014.09.017. W. Peñate, M. González-Loyola, and C. Oyanadel. The predictive role of affectivity, self-esteem and social support in depression and anxiety in children and adolescents.International Journal of Environmental Research and Public Health, 17(19),
-
[33]
ISSN 1660-4601. doi:10.3390/ijerph17196984. E. Pozzi, D. Rakesh, Z. Gracia-Tabuenca, K. O. Bray, S. Richmond, M. L. Seal, O. Schwartz, N. Vijayakumar, M. B. Yap, and S. Whittle. Investigating Associations Between Maternal Behavior and the Development of Functional Connectivity During the Transition From Late Childhood to Early Adolescence.Biological Psych...
-
[34]
doi:10.1016/j.bpsc.2023.05.008
ISSN 24519022. doi:10.1016/j.bpsc.2023.05.008. D. Rakesh, C. Seguin, A. Zalesky, V . Cropley, and S. Whittle. Associations Between Neighborhood Disadvantage, Resting-State Functional Connectivity, and Behavior in the Adolescent Brain Cognitive Development Study: The Moderating Role of Positive Family and School Environments.Biological Psychiatry: Cognitiv...
-
[35]
doi:10.1016/0377-0427(87)90125-7. J. M. Salsman, Z. Butt, P. A. Pilkonis, J. M. Cyranowski, N. Zill, H. C. Hendrie, M. J. Kupst, M. A. R. Kelly, R. K. Bode, S. W. Choi, J.-S. Lai, J. W. Griffith, C. M. Stoney, P. Brouwers, S. S. Knox, and D. Cella. Emotion assessment using the NIH Toolbox.Neurology, 80(11 Suppl 3):S76–S86,
-
[36]
13 Complexity72h22-26 JUNE2026 - LONDON A
doi:10.1212/WNL.0b013e3182872e11. 13 Complexity72h22-26 JUNE2026 - LONDON A. Schaefer, R. Kong, E. M. Gordon, T. O. Laumann, X.-N. Zuo, A. J. Holmes, S. B. Eickhoff, and B. T. T. Yeo. Local-Global Parcellation of the Human Cerebral Cortex from Intrinsic Functional Connectivity MRI.Cerebral Cortex, 28(9):3095–3114, Sept
-
[37]
ISSN 1047-3211, 1460-2199. doi:10.1093/cercor/bhx179. T. ShamsEldin, S. Gaber, S. Ansari, R. Elgohary, M. A. Shawky, M. Elbahnasawy, and M. Abdrabou. Artificial intelligence for predicting depression anxiety and stress using psychometric data.Scientific Reports, 15:37282,
-
[38]
doi:10.1038/s41598-025-21301-1. S. S. Simon, E. Varangis, and Y . Stern. Associations between personality and whole-brain functional connectivity at rest: Evidence across the adult lifespan.Brain and Behavior, 10(2):e01515,
-
[39]
doi:10.1002/brb3.1515. R. N. Spreng, E. Dimas, L. Mwilambwe-Tshilobo, A. Dagher, P. Koellinger, G. Nave, A. Ong, J. M. Kernbach, T. V . Wiecki, T. Ge, Y . Li, A. J. Holmes, B. T. T. Yeo, G. R. Turner, R. I. M. Dunbar, and D. Bzdok. The default network of the human brain is associated with perceived social isolation.Nature Communications, 11(1):6393, Dec
-
[40]
doi:10.1038/s41467-020-20039-w
ISSN 2041-1723. doi:10.1038/s41467-020-20039-w. Student. The probable error of a mean.Biometrika, 6(1):1–25,
-
[41]
doi:10.1093/biomet/6.1.1. B. T. Thomas Yeo, F. M. Krienen, J. Sepulcre, M. R. Sabuncu, D. Lashkari, M. Hollinshead, J. L. Roffman, J. W. Smoller, L. Zöllei, J. R. Polimeni, B. Fischl, H. Liu, and R. L. Buckner. The organization of the human cere- bral cortex estimated by intrinsic functional connectivity.Journal of Neurophysiology, 106(3):1125–1165,
-
[42]
doi:10.1152/jn.00338.2011. B. N. Uchino. Social Support and Health: A Review of Physiological Processes Potentially Underlying Links to Disease Outcomes.Journal of Behavioral Medicine, 29(4):377–387, Aug
-
[43]
ISSN 0160-7715, 1573-3521. doi:10.1007/s10865-006-9056-5. D. C. Van Essen, S. M. Smith, D. M. Barch, T. E. Behrens, E. Yacoub, K. Ugurbil, W.-M. H. Consortium, et al. The WU- Minn human connectome project: an overview.Neuroimage, 80:62–79,
-
[44]
doi:10.1016/j.neuroimage.2013.05.041. 14
discussion (0)
Sign in with ORCID, Apple, or X to comment. Anyone can read and Pith papers without signing in.