REVIEW 4 major objections 4 minor 112 references
The EDGE-CALIFA survey: The effect of active galactic nucleus feedback on the integrated properties of galaxies at different stages of their evolution
T0 review · 4 major / 4 minor · reviewed 2026-08-06 · deepseek-v4-flash
Pith's one-line read AGN hosts and inactive galaxies look the same at every quenching stage.
desk verdict A careful null result on instantaneous AGN feedback, worth refereeing despite small active samples and an unpublished R21 calibration. read the letter →
The pith
A machine-rendered reading of the paper's core claim, the machinery that carries it, and where it could break.
The reading
What carries the argument
The machinery is a stage-matched comparison. Galaxies are sorted by a classification scheme that reads the spatial pattern of H$\alpha$ equivalent widths and optical line-ratio diagnostics to assign one of four AGN-bearing quenching stages--star-forming, quiescent nuclear ring, mixed, and nearly retired--and to label the nucleus as inactive, weakly active, or strongly active. These labels are matched to homogenized integrated measurements of stellar mass, SFR, and CO-derived molecular gas mass. The load-bearing step is the pairing itself: comparing active and non-active galaxies within the same quenching stage removes evolutionary-state differences, so any residual offset is attributed to current nuclear activity.
What would settle it
Measure the CO(2-1)/CO(1-0) ratio directly for those 60 galaxies, or repeat the stage-matched comparison with a hard-X-ray-selected AGN sample and direct CO(1-0) measurements; finding AGN hosts with substantially lower molecular gas masses or shorter depletion times than non-active controls at the same stage would overturn the claim of no instantaneous feedback.
Extended reading notes
Core claim
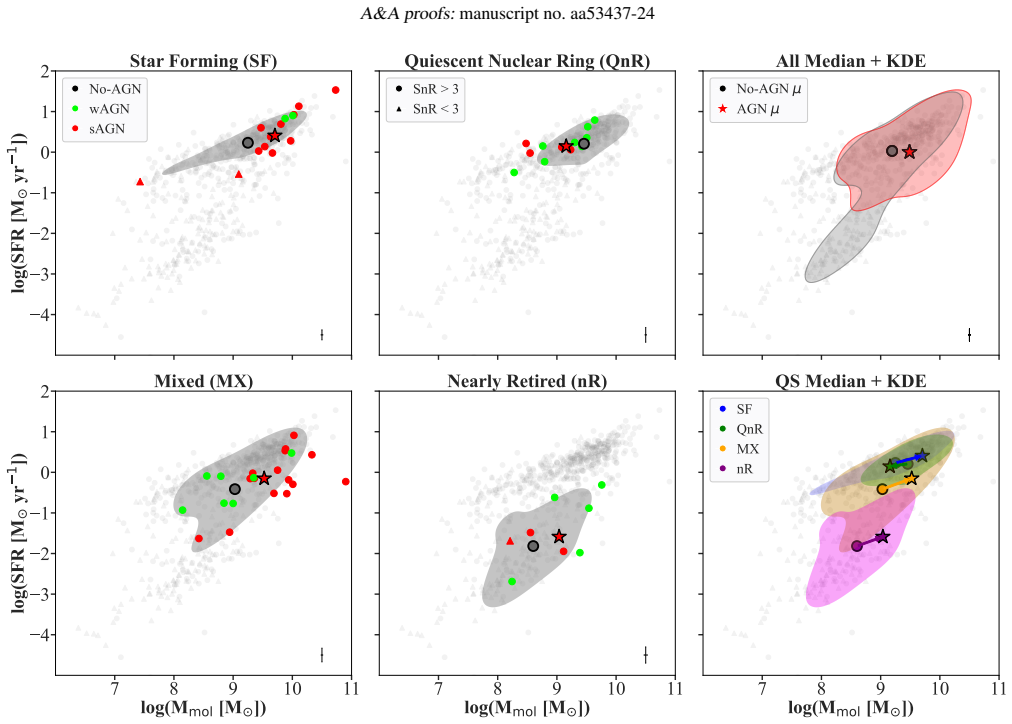
The paper's central claim is that, within a fixed quenching stage, AGN hosts and non-active galaxies have statistically similar integrated properties: specific star formation rate, molecular gas mass $M_{\rm mol}$, star formation efficiency ${\rm SFE}={\rm SFR}/M_{\rm mol}$, molecular gas fraction $f_{\rm mol}=M_{\rm mol}/M_\star$, and the scaling relations among SFR, $M_\star$, and $M_{\rm mol}$. Kolmogorov-Smirnov and $\chi^2$ tests find no significant active/non-active differences inside a stage, with the strongest deviations confined to the molecular gas mass at the star-forming and mixed stages. In the star-forming, mixed, and nearly-retired stages, active hosts hold slightly more molecular gas than inactive ones; in the quiescent-nuclear-ring stage, they hold slightly less gas and have higher star formation efficiency. The authors interpret the overall similarity as the absence of instantaneous AGN feedback on global scales, and they note that the quiescent-ring offset may reflect bar-driven gas funneling.
Load-bearing premise
The molecular gas masses for 60 of the galaxies come from CO(2-1) observations converted with an assumed, unpublished relation between the CO(2-1)/CO(1-0) ratio and star-formation surface density; if that relation is biased, the active/non-active gas comparisons at those stages could be distorted.
Editorial extensions
If this is right
- Instantaneous nuclear activity is not the main switch that removes or heats a galaxy's molecular gas during quenching; the gas supply itself governs the decline.
- AGN hosts occupy the same sSFR, SFE, and $f_{\rm mol}$ sequence as non-active hosts, so a galaxy's current nuclear state alone cannot diagnose why it is quenching.
- The slight molecular-gas deficit in quiescent-nuclear-ring active hosts supports a picture where bars funnel gas inward, feed the black hole, and deplete the global reservoir; resolved CO maps of that stage would test it.
- Cumulative black-hole growth, for instance black-hole mass, should predict quenching better than current AGN luminosity, consistent with simulation-based expectations.
- Global active/non-active comparisons that ignore quenching stage can look significantly different, so stage matching is necessary before attributing offsets to AGN feedback.
Reading between the lines
- A resolved, kiloparsec-scale CO survey of the same galaxies could reveal feedback signatures that global integrals wash out; this is a direct extension the paper itself points toward.
- Because the AGN selection here is optical, the sample may miss X-ray- and radio-selected AGNs; a stage-matched sample selected in hard X-rays might show stronger gas deficits, especially at high accretion rates.
- Publishing the R21 conversion relation used for the CO(2-1) data would let readers test the main assumption; if that ratio depends on AGN activity rather than only on SFR, the reported molecular-gas differences could shift.
- The stage-matching method transfers readily to other integrated tracers--atomic gas, dust, gas-phase metallicity, or outflow kinematics--to look for earlier or weaker feedback signatures.
Editorial analysis
A structured set of objections, weighed in public.
Referee Report
Summary. The paper uses the CALIFA/iEDGE sample of 643 nearby galaxies, classifies them with the QueStNA scheme into four AGN-hosting quenching stages, and compares active versus non-active galaxies in terms of sSFR, molecular gas mass Mmol, star formation efficiency SFE, molecular gas fraction fmol, and three scaling relations. The analysis uses bootstrapped Kolmogorov-Smirnov tests and a KDE-based chi-squared test. The central claim is that active and non-active galaxies have largely similar global property distributions at each quenching stage, implying that instantaneous AGN feedback is not a dominant regulator of global molecular gas content or star formation, with only modest differences such as somewhat higher Mmol among active galaxies in some stages.
Significance. If the null result holds, the paper provides a useful observational constraint favoring cumulative, rather than instantaneous, AGN feedback as the relevant quenching mechanism. The study has real strengths: it uses a well-defined optical IFU sample, separates galaxies by quenching stage rather than pooling them, and applies bootstrapped tests that propagate measurement uncertainties. However, the evidential force of the null result is limited by very small active subsamples and by the use of an unpublished, SFR-dependent CO(2-1)-to-CO(1-0) calibration that enters the Mmol, SFE, and fmol values for the ACA subsample. The paper is therefore a valuable contribution to the AGN feedback debate, but its central claim is currently stated more strongly than the statistical evidence and the calibration transparency allow.
major comments (4)
- [Section 2.5] The derivation of Mmol, SFE, and fmol for the ACA galaxies depends on an R21 = CO(2-1)/CO(1-0) ratio that is 'predicted from the SFR surface mass density' using an unpublished relation (den Brok et al., in prep.). Because R21 multiplies the observed CO(2-1) luminosity, any bias or unquantified scatter in this relation propagates directly into Mmol and hence into SFE and fmol for the ACA subsample. Since the relation is calibrated against the same star formation activity that enters SFE and the quenching-stage definitions, this is a potential circularity. The paper needs to state the functional form and scatter of the R21 relation, report how many active and non-active galaxies in each quenching stage come from ACA rather than APEX/CARMA, and demonstrate that the main conclusions are robust to alternative R21 assumptions (e.g., a constant R21 of 0.7 or the range of published values). Without this, the central null result cannot be fully reproduced or assessed.
- [Section 3.1 and Table 1] The active sample sizes per stage are extremely small: for example, QnR contains 13 active galaxies split into 4 sAGN and 9 wAGN, nR contains only 9 active galaxies, and the sAGN subsamples in several stages have 3-4 objects. With these sizes, a KS test p-value above 0.05 is expected even for substantial distribution differences, so the paper's conclusion of 'largely similar' distributions is an underpowered null result, not a demonstrated equivalence. The authors should quantify the smallest effect that their tests could detect (e.g., through bootstrap power calculations or by reporting confidence intervals on the median differences) and should soften statements that interpret p>0.05 as evidence of similarity.
- [Abstract and Section 3.1] The abstract states that AGN hosts 'exhibit systematically higher molecular gas masses across all quenching stages except for the quiescent nuclear ring stage,' but the KS tests in Section 3.1 find significant Mmol differences only in the SF stage (p<0.01) and in the MX stage full sample (p<0.05). The nR median difference is quoted as 0.45 dex but is not statistically significant, and the QnR difference has the opposite sign. The word 'systematically' therefore overstates the statistical evidence; the authors should rephrase to describe higher median Mmol values in specific stages while explicitly noting which differences are significant.
- [Section 3.2 and Table B.1] There is a direct internal contradiction in the reporting of the chi-squared results. Section 3.2 says 'All of the pvals obtained along the scaling relations between non-actives and actives are greater than 0.05,' but Table B.1 shows p-values below 0.05 for the pooled comparisons, including 0.014 for All wAGN in SFR-Mmol and <0.01 for All AGN in SFR-Mmol and Mmol-M*. The sentence immediately following acknowledges that 'the null hypothesis is rejected when comparing non-active to active galaxies without segregating the quenching stages,' which is inconsistent with the preceding claim. This needs to be corrected so that the within-stage and pooled results are stated separately and accurately.
minor comments (4)
- [Section 2.5] The citation 'den Brock et al., in prep.' should read 'den Brok et al., in prep.' and should appear in the reference list; currently it is cited only in prose with no reference entry.
- [Section 3.1 and Figure 2] The text says the SF stage Mmol distribution differs significantly with p<0.01, but the corresponding text in Section 3.1 also says 'the statistical test presented in Fig. 3 confirms a significant difference' while other differences described in the same paragraph are not significant; it would help to explicitly list which of the quoted median differences are significant in Fig. 3 and Fig. B.2.
- [Section 4] The sentence 'However, the study was only done on four AGN star-forming galaxies' is abrupt and appears to refer to Ellison et al. (2021) without a clear transition; the sentence should be rephrased to integrate the sample-size caveat into the discussion.
- [Appendix A] The chi-squared procedure removes bins with zero or near-zero counts and removes up to one outlier point per case; these choices need a sensitivity test because they can materially change the resulting p-values for small samples.
Circularity Check
No significant circularity: the R21-SFR calibration is a systematic uncertainty, not a circular step.
full rationale
The paper's derivation chain is observational rather than definitional. Galaxies are classified into quenching stages and nuclear activity classes using the published QueStNA scheme (Kalinova et al. 2021), and molecular gas masses are derived from CO luminosities via standard conversion factors (Bolatto et al. 2017b) plus an R21 calibration for CO(2-1) data. The only potentially self-referential input is the R21 ratio 'predicted from the SFR surface mass density' (Section 2.5), because SFE = SFR/Mmol then has SFR in both numerator and denominator. However, this is an empirical calibration, not a logical identity: the R21 relation is an external input that does not by construction enforce the paper's null result. Moreover, the paper's central conclusion about comparable distances to the SFMS and similar sSFR distributions is independent of R21, since those quantities rely on SFR and stellar mass only. The KS and chi-squared tests are internal sample comparisons, not fitted parameters renamed as predictions. The self-citations to iEDGE, QueStNA, and prior EDGE work are methodological and not load-bearing in a circular sense: they provide data products and classification tools, not the conclusion. The unpublished R21 relation is a legitimate reproducibility and systematic-uncertainty concern, but it does not rise to circularity under the strict standard of exhibiting a specific reduction of the claimed result to its inputs.
Assumptions & free parameters
free parameters (1)
- CO(2-1)-to-CO(1-0) ratio (R21) =
not stated; predicted from SFR surface density (den Brok et al., in prep.)
assumptions (5)
- domain assumption The Bolatto et al. (2017b) CO-to-H2 conversion factor prescription accurately converts CO luminosity to molecular gas mass.
- ad hoc to paper The R21 ratio predicted from SFR surface density (den Brok et al., in prep.) correctly converts CO(2-1) to CO(1-0) for the ACA sample.
- domain assumption The QueStNA classification (Kalinova et al. 2021) correctly assigns quenching stages and nuclear activity classes.
- domain assumption The CALIFA/CARMA/ACA sample is representative of the local galaxy population at each quenching stage.
- domain assumption The Balmer decrement method yields unbiased star formation rate maps for all galaxies.
Cite this review
Pith. "Pith review of The EDGE-CALIFA survey: The effect of active galactic nucleus feedback on the integrated properties of galaxies at different stages of their evolution." pith.science (2026). https://pith.science/paper/JSHNSGJZ
@misc{pith2026250706709,
  author       = {Pith},
  title        = {Pith review of: The EDGE-CALIFA survey: The effect of active galactic nucleus feedback on the integrated properties of galaxies at different stages of their evolution},
  year         = {2026},
  howpublished = {\url{https://pith.science/paper/JSHNSGJZ}},
  note         = {Machine review of arXiv:2507.06709}
}
read the original abstract
Galaxy quenching, the intricate process through which galaxies transition from active star-forming states to retired ones, remains a complex phenomenon that requires further investigation. This study investigates the role of active galactic nuclei (AGNs) in regulating star formation by analyzing a sample of 643 nearby galaxies with redshifts between 0.005 and 0.03 from the Calar Alto Legacy Integral Field Area (CALIFA) survey. Galaxies were classified according to the Quenching Stages and Nuclear Activity (QueStNA) scheme, which categorizes them based on their quenching stage and the presence of nuclear activity. We further utilized the integrated Extragalactic Database for Galaxy Evolution (iEDGE), which combined homogenized optical integral field unit and CO observations. This allowed us to examine how AGNs influence the molecular gas reservoirs of active galaxies compared to their non-active counterparts at similar evolutionary stages. Our Kolmogorov-Smirnov and chi-squared tests indicate that the star formation property distributions and scaling relations of AGN hosts are largely consistent with those of non-active galaxies. However, AGN hosts exhibit systematically higher molecular gas masses across all quenching stages except for the quiescent nuclear ring stage. We find that AGN hosts follow the expected trends of non-active quenching galaxies, characterized by a lower star formation efficiency and molecular gas fraction compared to star-forming galaxies. Our results suggest that signatures of instantaneous AGN feedback are not prominent in the global molecular gas and star formation properties of galaxies.
Figures


Figures from the paper (3 more)


Reference graph
Works this paper leans on
-
[1]
N., Adelman-McCarthy, J
Abazajian, K. N., Adelman-McCarthy, J. K., Agüeros, M. A., et al. 2009, ApJS, 182, 543
2009
-
[2]
D., Allende Prieto, C., et al
Alam, S., Albareti, F. D., Allende Prieto, C., et al. 2015, ApJS, 219, 12 Article number, page 10 of 14 Z. Bazzi, D. Colombo, F. Bigiel et al.: AGN feedback in the different quenching stages of CALIFA galaxies
2015
-
[3]
Alonso, Coldwell, G., & Lambas, D. G. 2013, A&A, 549, A141 Astropy Collaboration, Price-Whelan, A. M., Sip˝ocz, B. M., et al. 2018, AJ, 156, 123 Astropy Collaboration, Robitaille, T. P., Tollerud, E. J., et al. 2013, A&A, 558, A33
2013
-
[4]
A., Phillips, M
Baldwin, J. A., Phillips, M. M., & Terlevich, R. 1981, PASP, 93, 5
1981
-
[5]
Bluck, A. F. L., Bottrell, C., Teimoorinia, H., et al. 2019, MNRAS, 485, 666
2019
-
[6]
Bluck, A. F. L., Conselice, C. J., Ormerod, K., et al. 2024, ApJ, 961, 163
2024
-
[7]
Bluck, A. F. L., Mendel, J. T., Ellison, S. L., et al. 2014, MNRAS, 441, 599
2014
-
[8]
Bluck, A. F. L., Mendel, J. T., Ellison, S. L., et al. 2016, MNRAS, 462, 2559
2016
Show all 112 references
-
[9]
Bluck, A. F. L., Piotrowska, J. M., & Maiolino, R. 2023, ApJ, 944, 108
2023
-
[10]
G., Benson, A
Bower, R. G., Benson, A. J., Malbon, R., et al. 2006, MNRAS, 370, 645
2006
-
[11]
G., McCarthy, I
Bower, R. G., McCarthy, I. G., & Benson, A. J. 2008, MNRAS, 390, 1399
2008
-
[12]
Brandt, W. N. & Alexander, D. M. 2015, A&A Rev., 23, 1
2015
-
[13]
2018, Rev
Papastergis, E. 2018, Rev. Mexicana Astron. Astrofis., 54, 443
2018
-
[14]
P., Graham, A
Cameron, E., Driver, S. P., Graham, A. W., & Liske, J. 2009, ApJ, 699, 105
2009
-
[15]
& Driver, S
Cameron, E. & Driver, S. P. 2009, A&A, 493, 489 Cano-Díaz, M., Sánchez, S. F., Zibetti, S., et al. 2016, ApJ, 821, L26
2009
-
[16]
L., & Kawata, D
Carles, C., Martel, H., Ellison, S. L., & Kawata, D. 2016, MNRAS, 463, 1074
2016
-
[17]
J., Hickox, R
Chen, C.-T. J., Hickox, R. C., Alberts, S., et al. 2013, ApJ, 773, 3
2013
-
[18]
2016, Nature, 533, 504
Cheung, E., Bundy, K., Cappellari, M., et al. 2016, Nature, 533, 504
2016
-
[19]
2012, A&A, 543, A99
Cicone, C., Feruglio, C., Maiolino, R., et al. 2012, A&A, 543, A99
2012
-
[20]
2014, A&A, 562, A21 Cid Fernandes, R., Stasi ´nska, G., Mateus, A., & Vale Asari, N
Cicone, C., Maiolino, R., Sturm, E., et al. 2014, A&A, 562, A21 Cid Fernandes, R., Stasi ´nska, G., Mateus, A., & Vale Asari, N. 2011, MNRAS, 413, 1687
2014
-
[21]
F., Bolatto, A
Colombo, D., Sanchez, S. F., Bolatto, A. D., et al. 2020, A&A, 644, A97
2020
-
[22]
2013, A&A, 558, A124
Combes, F., García-Burillo, S., Casasola, V ., et al. 2013, A&A, 558, A124
2013
-
[23]
N., et al
Cristello, N., Zou, F., Brandt, W. N., et al. 2024, ApJ, 962, 156
2024
-
[24]
J., Springel, V ., White, S
Croton, D. J., Springel, V ., White, S. D. M., et al. 2006, MNRAS, 365, 11
2006
-
[25]
& Silk, J
Dekel, A. & Silk, J. 1986, apj, 303, 39
1986
-
[26]
D., et al
Donnari, M., Pillepich, A., Joshi, G. D., et al. 2020, MNRAS, 500, 4004
2020
-
[27]
L., Brown, T., Catinella, B., & Cortese, L
Ellison, S. L., Brown, T., Catinella, B., & Cortese, L. 2018, MNRAS, 482, 5694
2018
-
[28]
L., Sánchez, S
Ellison, S. L., Sánchez, S. F., Ibarra-Medel, H., et al. 2017, MNRAS, 474, 2039
2017
-
[29]
L., Teimoorinia, H., Rosario, D
Ellison, S. L., Teimoorinia, H., Rosario, D. J., & Mendel, J. T. 2016, MNRAS, 458, L34
2016
-
[30]
L., Wong, T., Sánchez, S
Ellison, S. L., Wong, T., Sánchez, S. F., et al. 2021, MNRAS, 505, L46
2021
-
[31]
F., Morisset, C., et al
Espinosa-Ponce, C., Sánchez, S. F., Morisset, C., et al. 2020, MNRAS, 494, 1622
2020
-
[32]
2024, A&A, 686, A46
Esposito, Federico, Alonso-Herrero, Almudena, García-Burillo, Santiago, et al. 2024, A&A, 686, A46
2024
-
[33]
2011, MNRAS, 416, 1739
Fabello, S., Kauffmann, G., Catinella, B., et al. 2011, MNRAS, 416, 1739
2011
-
[34]
Fabian, A. C. 2012, ARA&A, 50, 455
2012
-
[35]
2010, A&A, 518, L155
Feruglio, C., Maiolino, R., Piconcelli, E., et al. 2010, A&A, 518, L155
2010
-
[36]
2010, A&A, 518, L41
Fischer, J., Sturm, E., González-Alfonso, E., et al. 2010, A&A, 518, L41
2010
-
[37]
& Hicks, E
Garcia-Burillo, S. & Hicks, E. 2024, in EAS2024, European Astronomical Soci- ety Annual Meeting, 1078
2024
-
[38]
J., Lutz, D., et al
Genzel, R., Tacconi, L. J., Lutz, D., et al. 2015, ApJ, 800, 20
2015
-
[39]
2019, A&A, 621, L4 González Delgado, Cid Fernandes, R., Pérez, E., et al
George, K., Joseph, P., Mondal, C., et al. 2019, A&A, 621, L4 González Delgado, Cid Fernandes, R., Pérez, E., et al. 2016, A&A, 590, A44
2019
-
[40]
Gunn, J. E. & Gott, J. Richard, I. 1972, ApJ, 176, 1 Güsten, R., Nyman, L. Å., Schilke, P., et al. 2006, A&A, 454, L13
1972
-
[41]
M., Alexander, D
Harrison, C. M., Alexander, D. M., Mullaney, J. R., et al. 2012, ApJ, 760, L15
2012
-
[42]
M., Alexander, D
Harrison, C. M., Alexander, D. M., Mullaney, J. R., & Swinbank, A. M. 2014, MNRAS, 441, 3306
2014
-
[43]
M., Alexander, D
Harrison, C. M., Alexander, D. M., Rosario, D. J., Scholtz, J., & Stanley, F. 2019, Proceedings of the International Astronomical Union, 15, 199–203
2019
-
[44]
Heckman, T. M. & Best, P. N. 2014, ARA&A, 52, 589–660
2014
-
[45]
C., Jones, C., Forman, W
Hickox, R. C., Jones, C., Forman, W. R., et al. 2009, ApJ, 696, 891
2009
-
[46]
C., Darling, J., & Greene, J
Ho, L. C., Darling, J., & Greene, J. E. 2008, ApJ, 681, 128
2008
-
[47]
Hunter, J. D. 2007, Computing in Science & Engineering, 9, 90 Ivezi´c, Ž., Menou, K., Knapp, G. R., et al. 2002, AJ, 124, 2364
2007
-
[48]
2013, ApJ, 764, 176
Juneau, S., Dickinson, M., Bournaud, F., et al. 2013, ApJ, 764, 176
2013
-
[49]
F., et al
Kalinova, V ., Colombo, D., Sánchez, S. F., et al. 2021, A&A, 648, A64
2021
-
[50]
T., Pearce, F
Kay, S. T., Pearce, F. R., Frenk, C. S., & Jenkins, A. 2002, MNRAS, 330, 113
2002
-
[51]
1998, ApJ, 498, 541 Kennicutt Jr, R
Kennicutt, Robert C., J. 1998, ApJ, 498, 541 Kennicutt Jr, R. C. 1989, ApJ, 344, 685
1998
-
[52]
J., Groves, B., Kauffmann, G., & Heckman, T
Kewley, L. J., Groves, B., Kauffmann, G., & Heckman, T. 2006, MNRAS, 372, 961
2006
-
[53]
Kormendy, J. & Ho, L. C. 2013, ARA&A, 51, 511
2013
-
[54]
J., Strittmatter, B., Lamperti, I., et al
Koss, M. J., Strittmatter, B., Lamperti, I., et al. 2021, ApJS, 252, 29
2021
-
[55]
1974, ApJ, 191, 43
Kristian, J., Sandage, A., & Katem, B. 1974, ApJ, 191, 43
1974
-
[56]
Lacerda, E. A. D., Cid Fernandes, R., Couto, G. S., et al. 2017, MNRAS, 474, 3727
2017
-
[57]
Lacerda, E. A. D., Sánchez, S. F., Cid Fernandes, R., et al. 2020, MNRAS, 492, 3073
2020
-
[58]
S.-Y ., Armus, L., U, V ., et al
Lai, T. S.-Y ., Armus, L., U, V ., et al. 2022, ApJ, 941, L36
2022
-
[59]
L., Petric, A
Lambrides, E. L., Petric, A. O., Tchernyshyov, K., Zakamska, N. L., & Watts, D. J. 2019, MNRAS, 487, 1823
2019
-
[60]
Larson, R. B. & Tinsley, B. M. 1978, ApJ, 219, 46
1978
-
[61]
K., Schinnerer, E., Hughes, A., et al
Leroy, A. K., Schinnerer, E., Hughes, A., et al. 2021, ApJS, 257, 43
2021
-
[62]
2017, ApJ, 851, 18
Lin, L., Belfiore, F., Pan, H.-A., et al. 2017, ApJ, 851, 18
2017
-
[63]
L., Pan, H.-A., et al
Lin, L., Ellison, S. L., Pan, H.-A., et al. 2020, ApJ, 903, 145
2020
-
[64]
L., Pan, H.-A., et al
Lin, L., Ellison, S. L., Pan, H.-A., et al. 2022, ApJ, 926, 175
2022
-
[65]
L., et al
Lin, L., Pan, H.-A., Ellison, S. L., et al. 2019, ApJ, 884, L33
2019
-
[66]
Lohaka, H. O. 2007, PhD thesis, Ohio University López-Cobá, C., Sánchez, S. F., Bland-Hawthorn, J., et al. 2019, MNRAS, 482, 4032
2007
-
[67]
N., Xue, Y
Luo, B., Brandt, W. N., Xue, Y . Q., et al. 2016, ApJS, 228, 2
2016
-
[68]
2012, MNRAS, 425, L66
Maiolino, R., Gallerani, S., Neri, R., et al. 2012, MNRAS, 425, L66
2012
-
[69]
& White, S
Marri, S. & White, S. D. M. 2003, MNRAS, 345, 561 Martín-Navarro, I., Brodie, J. P., Romanowsky, A. J., Ruiz-Lara, T., & van de
2003
-
[70]
2018, Nature, 553, 307–309
Ven, G. 2018, Nature, 553, 307–309
2018
-
[71]
1996, Nature, 379, 613
Moore, B., Katz, N., Lake, G., Dressler, A., & Oemler, A. 1996, Nature, 379, 613
1996
-
[72]
2023, A&A, 672, A98
Mountrichas, George. 2023, A&A, 672, A98
2023
-
[73]
R., Daddi, E., Béthermin, M., et al
Mullaney, J. R., Daddi, E., Béthermin, M., et al. 2012, ApJ, 753, L30
2012
-
[74]
G., Weiner, B
Noeske, K. G., Weiner, B. J., Faber, S. M., et al. 2007, ApJ, 660, L43
2007
-
[75]
Omand, C. M. B., Balogh, M. L., & Poggianti, B. M. 2014, MNRAS, 440, 843
2014
-
[76]
F., Guainazzi, M., & Cruz- González, I
Osorio-Clavijo, N., Gonzalez-Martín, O., Sánchez, S. F., Guainazzi, M., & Cruz- González, I. 2023, MNRAS, 522, 5788
2023
-
[77]
2024, ApJ, 964, 120
Pan, H.-A., Lin, L., Ellison, S., et al. 2024, ApJ, 964, 120
2024
-
[78]
J., Kovaˇc, K., et al
Peng, Y .-j., Lilly, S. J., Kovaˇc, K., et al. 2010, ApJ, 721, 193
2010
-
[79]
M., Bluck, A
Piotrowska, J. M., Bluck, A. F., Maiolino, R., Concas, A., & Peng, Y . 2020, MNRAS, 492, L6
2020
-
[80]
M., Bluck, A
Piotrowska, J. M., Bluck, A. F., Maiolino, R., & Peng, Y . 2022, MNRAS, 512, 1052
2022
-
[81]
F., Binette, L., et al
Prugniel, P., Ortiz, P. F., Binette, L., et al. 2001, in Mining the Sky, ed. A. J
2001
-
[82]
2000, Science, 288, 1617
Quilis, V ., Moore, B., & Bower, R. 2000, Science, 288, 1617
2000
-
[83]
& Peng, Y .-j
Renzini, A. & Peng, Y .-j. 2015, ApJ, 801, L29
2015
-
[84]
M., Jackson, C
Sadler, E. M., Jackson, C. A., Cannon, R. D., et al. 2002, MNRAS, 329, 227
2002
-
[85]
2016, MNRAS, 462, 1749
Saintonge, A., Catinella, B., Cortese, L., et al. 2016, MNRAS, 462, 1749
2016
-
[86]
J., et al
Saintonge, A., Catinella, B., Tacconi, L. J., et al. 2017, ApJS, 233, 22 Sánchez, S. F., Avila-Reese, V ., Hernandez-Toledo, H., et al. 2018, Rev. Mexi- cana Astron. Astrofis., 54, 217 Sánchez, S. F., Barrera-Ballesteros, J. K., Colombo, D., et al. 2021, MNRAS, 503, 1615 Sánch...
2017
-
[87]
1959, ApJ, 129, 243
Schmidt, M. 1959, ApJ, 129, 243
1959
-
[88]
T., Mushotzky, R
Shimizu, T. T., Mushotzky, R. F., Meléndez, M., Koss, M., & Rosario, D. J. 2015, MNRAS, 452, 1841
2015
-
[89]
& Rees, M
Silk, J. & Rees, M. J. 1998, A&A, 331, L1
1998
-
[90]
L., Mushotzky, R
Smith, K. L., Mushotzky, R. F., V ogel, S., Shimizu, T. T., & Miller, N. 2016, ApJ, 832, 163 Stasi´nska, G., Vale Asari, N., Cid Fernandes, R., et al. 2008, MNRAS, 391, L29
2016
-
[91]
2011, ApJ, 733, L16
Sturm, E., González-Alfonso, E., Veilleux, S., et al. 2011, ApJ, 733, L16
2011
-
[92]
Teimoorinia, H., Bluck, A. F. L., & Ellison, S. L. 2016, MNRAS, 457, 2086
2016
-
[93]
A., Bell, E
Terrazas, B. A., Bell, E. F., Henriques, B. M. B., et al. 2016, ApJ, 830, L12
2016
-
[94]
A., Bell, E
Terrazas, B. A., Bell, E. F., Woo, J., & Henriques, B. M. B. 2017, ApJ, 844, 170
2017
-
[95]
R., Sun, M., Zeimann, G
Trump, J. R., Sun, M., Zeimann, G. R., et al. 2015, ApJ, 811, 26
2015
-
[96]
2013, ApJ, 776, 27
Veilleux, S., Meléndez, M., Sturm, E., et al. 2013, ApJ, 776, 27
2013
-
[97]
D., V ogel, S
Villanueva, V ., Bolatto, A. D., V ogel, S. N., et al. 2024, ApJ, 962, 88
2024
-
[98]
E., et al
Virtanen, P., Gommers, R., Oliphant, T. E., et al. 2020, Nature, 17, 261 V ogelsberger, M., Genel, S., Springel, V ., et al. 2014, Nature, 509, 177
2020
-
[99]
A., van Dokkum, P
Wake, D. A., van Dokkum, P. G., & Franx, M. 2012, ApJ, 751, L44
2012
-
[100]
J., Pezzulli, G., & Matthee, J
Wang, E., Lilly, S. J., Pezzulli, G., & Matthee, J. 2019, ApJ, 877, 132
2019
-
[101]
J., Chen, S., et al
Wang, H., Mo, H. J., Chen, S., et al. 2018, ApJ, 852, 31
2018
-
[102]
R., Harrison, C
Ward, S. R., Harrison, C. M., Costa, T., & Mainieri, V . 2022, MNRAS, 514, 2936
2022
-
[103]
R., Churazov, E., & Scannapieco, E
Werner, N., McNamara, B. R., Churazov, E., & Scannapieco, E. 2018, Space Sci. Rev., 215
2018
-
[104]
& Blitz, L
Wong, T. & Blitz, L. 2002, ApJ, 569, 157
2002
-
[105]
M., et al
Woo, J., Dekel, A., Faber, S. M., et al. 2012, MNRAS, 428, 3306
2012
-
[106]
Q., Brandt, W
Xue, Y . Q., Brandt, W. N., Luo, B., et al. 2010, ApJ, 720, 368
2010
-
[107]
Q., Luo, B., Brandt, W
Xue, Y . Q., Luo, B., Brandt, W. N., et al. 2011, ApJS, 195, 10
2011
-
[108]
G., Adelman, J., Anderson, Jr., J
York, D. G., Adelman, J., Anderson, Jr., J. E., et al. 2000, AJ, 120, 1579
2000
-
[109]
Zakamska, N. L. & Greene, J. E. 2014, MNRAS, 442, 784
2014
-
[110]
Zhuang, M.-Y . & Ho, L. C. 2022, ApJ, 934, 130
2022
-
[111]
2020, MNRAS, 499, 768 Article number, page 11 of 14 A&A proofs: manuscript no
Zinger, E., Pillepich, A., Nelson, D., et al. 2020, MNRAS, 499, 768 Article number, page 11 of 14 A&A proofs: manuscript no. aa53437-24 Appendix A: Chi-squared analysis of galaxy scaling relations Here, the statistical tests applied to compare the 2D scaling relations between ...
2020
-
[112]
theoretical
Specifically, Pearson’sχ2 test was used in this case, which examines whether two selected groups are dependent or not, indicating whether a categorical distribution is compatible with another theoretical distribution. The test is represented by the equation: χ2 = nX i=1 (Oi− E...
2007
Reviewed August 6, 2026 · model on record in the stance chip above.
Discussion (0). Sign in to comment.