REVIEW 4 major objections 6 minor 15 references
Evaluating Pest Management Strategies: A Robust Method and its Application to Strawberry Disease Management
T0 review · 4 major / 6 minor · reviewed 2026-08-14 · deepseek-v4-flash
Pith's one-line read The paper claims that a simulation-based certainty-equivalent method, built on quantile regression and disease-pressure data, can rank fungicide treatments more reliably than standard field-replicate rankings.
desk verdict A plausible SERF extension for disease-pressure scenarios, but the ranking engine rests on pseudo-replication and the scenario CEs are essentially refits of the same small dataset. read the letter →
The pith
A machine-rendered reading of the paper's core claim, the machinery that carries it, and where it could break.
The reading
What carries the argument
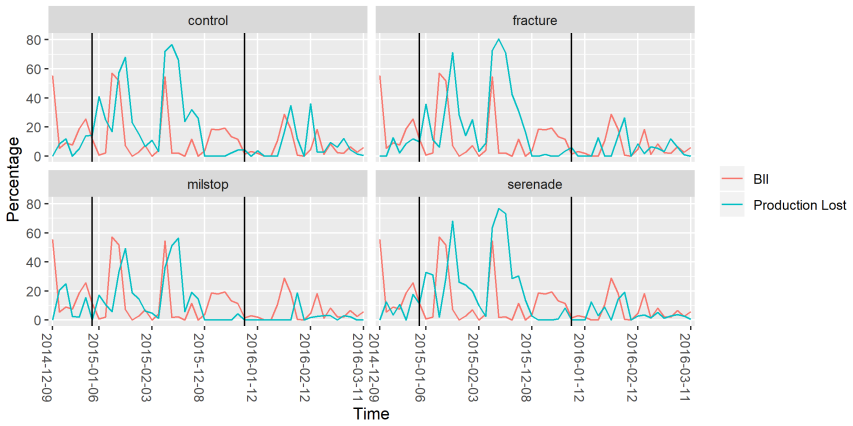
The load-bearing object is the quantile-regression simulation model of yield, equation (3), written here as $Yield_t = \beta_0 + \beta_1 Yield_{t-1} + \beta_2 BII_t + \beta_3 t + \sum_i \gamma_i D_i + t \sum_i \delta_i D_i$. The regression is estimated at nine quantiles; the coefficient on the Botrytis Incidence Index carries the disease-pressure effect, while the treatment dummies and their time interactions carry the treatment effects. The estimated equations are then used to generate 100 simulated yield series under low (10–30%), medium (40–60%), and high (70–90%) Botrytis incidence and at low (0.2), middle (0.5), and high (0.8) yield quantiles. These simulated profits enter the power-utility certainty equivalent formula, so the certainty-equivalent ranking becomes a function of an explicit disease scenario, a yield level, and the assumed degree of risk aversion.
What would settle it
Recompute the quantile regression with standard errors clustered by plot rather than by harvest record, then rerun the 100 simulations per scenario; if the certainty-equivalent bands for different treatments overlap within a scenario, the claimed ranking differences are not statistically separable.
Extended reading notes
Core claim
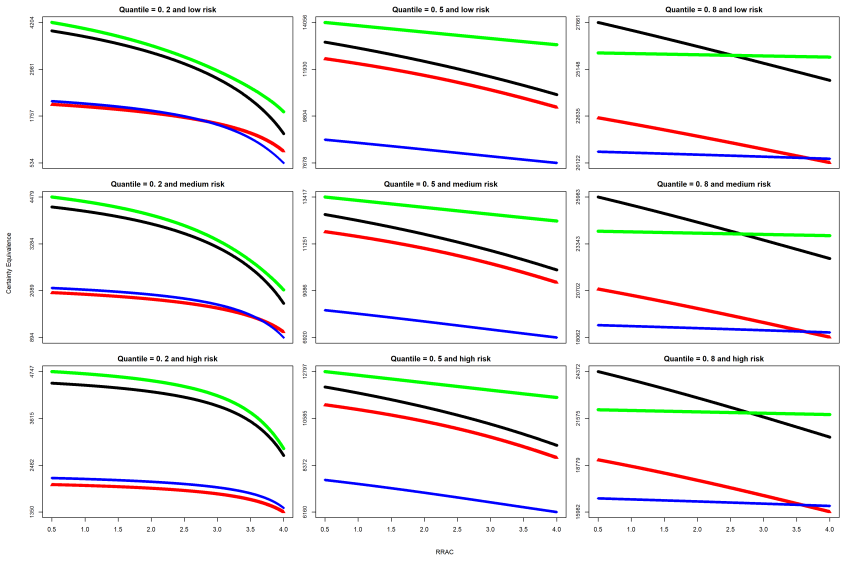
Read sympathetically, the paper's discovery is that the certainty-equivalent ranking of fungicide treatments is not a single answer but a family of answers indexed by disease pressure and yield level. By fitting a quantile regression of strawberry yield on lagged yield, the Botrytis incidence index, treatment indicators, and a time trend, and then simulating 100 yield realizations in each of nine scenarios (three disease-incidence ranges times three yield quantiles), the authors obtain certainty-equivalent rankings that would be invisible in the eight profit observations per treatment available from two field seasons. The simulated rankings show Serenade consistently risk-efficient in the lower part of the yield distribution and, at higher yield quantiles, only for strongly risk-averse growers; the untreated control dominates Fracture and Milstop at all risk-aversion levels. The authors conclude that this procedure is a more reliable tool for identifying risk-efficient treatments because it overcomes limited replication and incorporates disease pressure.
Load-bearing premise
The method's statistical power comes from treating each individual harvest from a plot as an independent data point, even though those harvests are repeated measurements from the same experimental unit; if plot-level correlation is substantial, the simulated rankings could be less precise than they appear.
Editorial extensions
If this is right
- The standard certainty-equivalent ranking computed from raw field data is not stable across seasons, while the simulated procedure replaces it with scenario-specific rankings that remain consistent with the raw-data results in most cases.
- Serenade is risk-efficient at lower yield quantiles across all disease scenarios, while at higher yield quantiles it is selected only by farmers with stronger risk aversion.
- The untreated control outperforms Fracture and Milstop at every risk-aversion level considered in the simulated rankings.
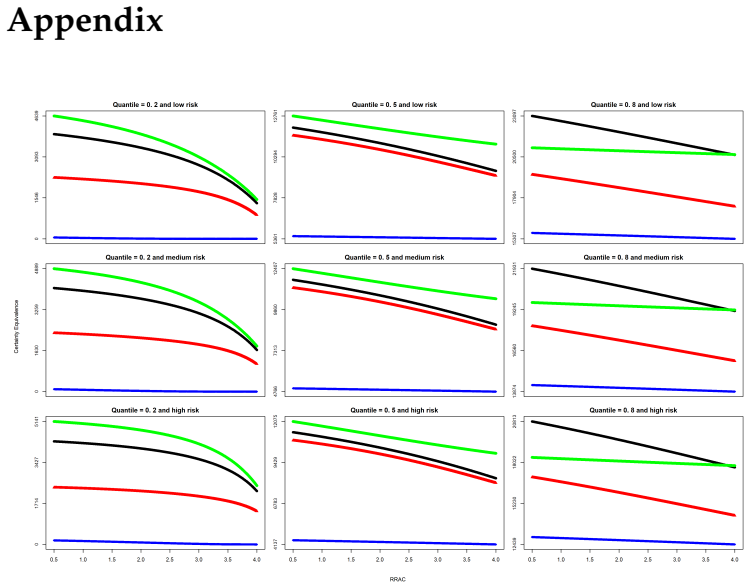
- The sensitivity analysis with lower and higher strawberry prices preserves the same qualitative conclusions, suggesting the scenario rankings are not driven by the particular price assumption.
- Because the machinery only requires an exogenous driver of yield and a treatment indicator, the same simulation-plus-certainty-equivalent workflow could be applied to other crops and other stress factors.
Reading between the lines
- An extension the paper leaves implicit is disease forecasting as a decision tool: a grower who knows whether the coming season will bring low, medium, or high Botrytis pressure can read the corresponding certainty-equivalent panel and choose the treatment matched to that forecast.
- Because each harvest within a plot is treated as an independent observation, the precision of the simulated rankings is plausibly an upper bound; a plot-level cluster bootstrap would give a direct test of whether the scenario rankings survive when the repeated harvests are treated as one experimental unit.
- The nine-scenario grid could be replaced by a continuous risk map built from the quantile-regression coefficients, allowing recommendations for any forecasted Botrytis incidence value rather than three coarse bands.
- The same logic applies beyond pesticides: any input whose payoff depends on an exogenous stress index, such as irrigation under drought or variety choice under disease risk, could be ranked with this procedure.
Signed reviews
Editorial analysis
A structured set of objections, weighed in public.
Referee Report
Summary. The paper proposes a modification of the standard stochastic efficiency with respect to a function (SERF) method for ranking pest-management treatments under risk and uncertainty. Using harvest-level yield data from strawberry field trials with four treatments and four replications over two seasons, the authors estimate a quantile regression of yield on lagged yield, the Botrytis Incidence Index (BII), a time trend, and treatment dummies and interactions. They then simulate 100 yield draws for three levels of BII (low, medium, high) and three yield quantiles (0.2, 0.5, 0.8), compute certainty equivalents (CE) from the simulated profits under a power utility function, and compare treatment rankings across the resulting nine scenarios. The central claim is that this simulation-based procedure overcomes the limited number of field replicates and, by conditioning on disease pressure, is 'a more reliable tool' for risk-efficiency analysis than the standard SERF approach. The application to Florida strawberry disease management shows that Serenade is often risk-efficient at lower yield quantiles and under higher disease pressure, while the control dominates Fracture and Milstop.
Significance. If the method were statistically valid, it would be a useful practical extension of SERF by allowing risk rankings to be conditioned on exogenous disease pressure and on the location in the yield distribution. The paper is clearly written and addresses a real problem in applied agricultural economics. The quantile-regression approach is a sensible way to summarize treatment differences across the yield distribution. However, the central claim of improved statistical power is not supported by the analysis, and the current formulation makes the scenario rankings a deterministic function of the estimated coefficients. These issues need to be resolved before the contribution can be assessed.
major comments (4)
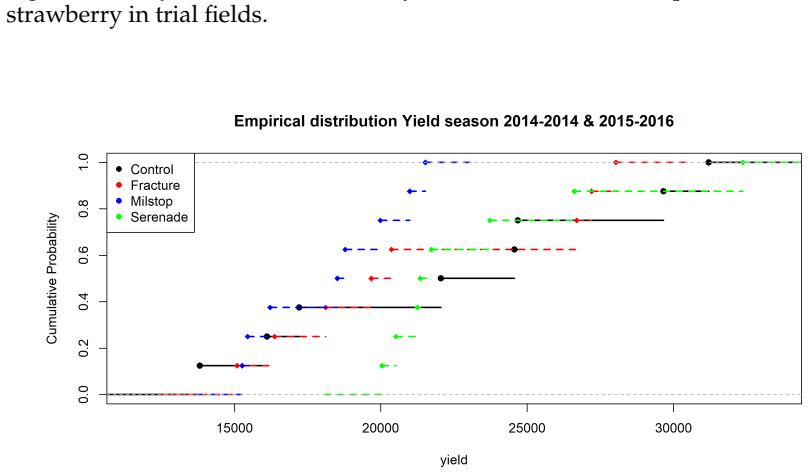
- [Section 3.2, Eq. (3)] The quantile regression in Eq. (3) is estimated on 768 harvest-level observations (48 harvests × 4 replicates × 4 treatments), but the experimental units are the plot-season combinations, of which there are only 32 in total (8 per treatment). The 24 harvests within each plot are serially correlated repeated measurements, and the regression itself includes Yield(t-1), making the dependence explicit. Treating these observations as independent inflates the precision of the coefficients reported in Table 2. The simulated yield distributions and the resulting CE rankings in Figure 4 inherit this overstatement, so the claim that the simulation overcomes the limited number of field replicates is not supported. The analysis should either use cluster-robust standard errors at the plot level or a hierarchical/mixed model that accounts for plot-level correlation, and should acknowledge that the effective sample size for treatment comparisons remains eight per treatment.
- [Section 3.2 and Figure 4] The scenario CEs are computed entirely from the quantile regression coefficients estimated on the same field-trial data used for the original CE analysis. By the structure of Eq. (3) and (4), the simulated yields are deterministic functions of the estimated coefficients, and the 100 simulation draws only add noise around the fitted conditional quantile function; they cannot create independent information about treatment effects. The rankings displayed in Figure 4 therefore reduce, by the paper's own equations, to the fitted values of the model. To substantiate the 'more reliable tool' claim, the authors would need to validate the simulated yield distributions against out-of-sample data or against plot-level bootstrap replications, or alternatively reframe the contribution as a conditional scenario analysis that does not claim additional statistical power.
- [Section 4 (Discussion)] The concluding statement that the proposed method 'is a more reliable tool to find risk-efficient treatments under different circumstances' is not supported by any formal comparison with the standard SERF approach. The only sensitivity analysis in the Appendix varies strawberry prices and does not address the statistical reliability of the rankings. A concrete test would be to compute the sampling distribution of CE rankings from both methods using plot-level bootstrap resampling and to report coverage or mean-squared-error metrics. Without such evidence, the reliability claim is an assertion rather than a demonstrated property.
- [Section 2.3 (Alternative procedure)] The simulation algorithm is not described in sufficient detail for replication. It is unclear whether the 100 yield simulations are draws of uniform quantiles from the estimated conditional quantile function, residual bootstraps, or some other mechanism, and whether uncertainty in the estimated coefficients is propagated. This information is essential for assessing whether the reported CE differences are meaningful and for reproducing the results.
minor comments (6)
- [Section 2.1] The trial appears to include four treatments (untreated control plus three fungicides), but the text says 'three fungicide treatments'; please clarify that the control is included as a treatment.
- [Equation (1)] The symbol R is used both for the number of replicates (in the summation upper limit) and as the replicate index; please use distinct symbols (e.g., N and r) to avoid confusion.
- [Table 2] Several standard errors appear as negative numbers (e.g., -0.03 for Yield(t-1) at Q=0.1 and -39.15, -79.1, etc.), which is likely a formatting artifact; please correct the table.
- [Figure 4] The axes and line labels are not described in the text or caption; please add a clear description of what is plotted, including the definition of the lines.
- [References] The in-text citation 'Cordoba et al., 2014' does not match the reference list entry 'Cordova, L., Zuniga, A., ...'; please fix the spelling and ensure all citations are consistent.
- [Section 2.1] The Botrytis Incidence Index is said to be obtained from AgroClimate, but no reference or construction details are provided; please add a citation or a brief description.
Circularity Check
Scenario CE 'predictions' are deterministic re-expressions of the quantile regression fitted to the same field trial; the claimed power gain from simulation is inherited, not independent.
-
fitted input called prediction
[Section 2.3, Eq. (4) using Eq. (3); Section 3.2, Table 2 and Figure 4]
"We introduced the exogenous BII index into a quantile-regression model to estimate the relationship between weather factors and strawberry yield, which was used to simulate sufficient yield observations under different weather scenarios. Then these simulated yield estimates rather than the actual observations were used to compute CE in order to increase the statistical power. ... Equation (3) is estimated with 768 observations (48 harvests × 4 replicates× 4 treatments); its coefficients are presented in Table 2."
By Eq. (4), the simulated profit is ~π_{n,M} = Σ(P_n·Y_{n,M}(~BII) − TC), and Y_{n,M}(~BII) is generated from Eq. (3) using the coefficients in Table 2. Those coefficients come from the same 768 observations, which are themselves 48 harvests × 4 replicates × 4 treatments, i.e., repeated harvests from only 32 plot-season units (8 per treatment). The CE rankings in Figure 4 are therefore deterministic functions of the fitted coefficients; the 100 simulations per scenario add no independent information and cannot of themselves 'increase the statistical power.' The scenario results are re-expressions of the fitted model, not predictions from new data.
full rationale
The paper's central claim is that the simulation-based CE procedure is 'a more reliable tool' than standard SERF because it overcomes limited field replication and incorporates disease pressure. The scenario-specific CEs in Figure 4, however, are computed by substituting simulated yields from Eq. (3) into Eq. (4), where the coefficients of Eq. (3) are estimated on the same field trial data. Thus the simulated CE rankings are not independent predictions; they are deterministic transformations of the fitted quantile-regression coefficients. The purported gain in statistical power comes from treating the 768 harvest-level records as independent even though the 24 harvests within each plot are repeated measurements of the same experimental unit, so the added 'observations' are generated from the model's own assumptions rather than from new information. This is a fitted-input-called-prediction pattern: the predicted scenario rankings reduce, by the paper's own equations, to the fitted model. The paper does not claim a formal theorem or rely on a self-citation chain, and it does present ordinary observed-data CE as a comparison, which provides some independent grounding, but the load-bearing scenario results are not independent of the estimation input. Score 6 reflects partial circularity: the central methodological claim is supported by simulation outputs that are constructed from the fitted model rather than validated against external or out-of-sample evidence.
Assumptions & free parameters
free parameters (5)
- RAC range =
0.5 to 4
- Initial wealth w0
- Yield quantiles =
0.2, 0.5, 0.8
- BII scenario levels =
10-30%, 40-60%, 70-90%
- Number of simulations =
100
assumptions (5)
- domain assumption The power utility function is the correct preference representation for the decision-maker and the CE formula from Hardaker et al. (2004) applies.
- domain assumption The Botrytis Incidence Index (BII) adequately measures disease pressure and its effect on yield.
- ad hoc to paper The linear quantile regression with lagged yield, BII, and time trend is correctly specified and the 768 harvest-level observations can be treated as independent.
- ad hoc to paper The simulated yield draws from the estimated quantile regression reproduce the true yield distribution under each BII scenario.
- domain assumption Costs from Guan et al. (2017) updated by PPI and USDA-AMS prices are representative of the trial seasons.
Cite this review
Pith. "Pith review of Evaluating Pest Management Strategies: A Robust Method and its Application to Strawberry Disease Management." pith.science (2026). https://pith.science/paper/JTF5C3IO
@misc{pith2026190801808,
  author       = {Pith},
  title        = {Pith review of: Evaluating Pest Management Strategies: A Robust Method and its Application to Strawberry Disease Management},
  year         = {2026},
  howpublished = {\url{https://pith.science/paper/JTF5C3IO}},
  note         = {Machine review of arXiv:1908.01808}
}
read the original abstract
Farmers use pesticides to reduce yield losses. The efficacies of pesticide treatments are often evaluated by analyzing the average treatment effects and risks. The stochastic efficiency with respect to a function is often employed in such evaluations through ranking the certainty equivalents of each treatment. The main challenge of using this method is gathering an adequate number of observations to produce results with statistical power. However, in many cases, only a limited number of trials are replicated in field experiments, leaving an inadequate number of observations. In addition, this method focuses only on the farmer's profit without incorporating the impact of disease pressure on yield and profit. The objective of our study is to propose a methodology to address the issue of an insufficient number of observations using simulations and take into account the effect of disease pressure on yield through a quantile regression model. We apply this method to the case of strawberry disease management in Florida.
Figures

Figures from the paper (3 more)

Reference graph
Works this paper leans on
-
[1]
Anderson1992 APACrefauthors Anderson, J R. \ Dillon, J L. APACrefauthors \ 1992 . Risk analysis in dryland farming systems Risk analysis in dryland farming systems . Rome Food and Agriculture Organization of the United Nations, Series No 2
work page 1992
-
[2]
Braun1987 APACrefauthors Braun, P. \ Sutton, J. APACrefauthors \ 1987 3 . Inoculum sources of Botrytis cinerea in fruit rot of strawberries in Ontario Inoculum sources of Botrytis cinerea in fruit rot of strawberries in Ontario . Canadian Journal of Plant Pathology 9 1 1--5 . APACrefDOI doi:10.1080/07060668709501903 APACrefDOI
- [3]
-
[4]
Cordova2014 APACrefauthors Cordova, L. , Zuniga, A. , Mertely, J. \ Peres, N. APACrefauthors \ 2014 . Evaluation of products for the control of Botrytis fruit rot in annual strawberry, 2013-14. Evaluation of products for the control of Botrytis fruit rot in annual strawberry, 2013-14. Plant Disease Management Report 8 1 1--2
work page 2014
-
[5]
Frisvold2019 APACrefauthors Frisvold, G B. APACrefauthors \ 2019 1 . How low can you go? Estimating impacts of reduced pesticide use How low can you go? Estimating impacts of reduced pesticide use . Pest Management Science 75 5 . APACrefDOI doi:10.1002/ps.5249 APACrefDOI
-
[6]
Gobeil-Richard2016 APACrefauthors Gobeil-Richard, M. , Tremblay, D M. , Beaulieu, C. , Van der Heyden , H. \ Carisse, O. APACrefauthors \ 2016 . A pyrosequencing-based method to quantify genetic substitutions associated with resistance to succinate dehydrogenase inhibitor fungicides in Botrytis spp. populations A pyrosequencing-based method to quantify ge...
work page 2016
-
[7]
Guan2017 APACrefauthors Guan, Z. , Wu, F. \ Whidden, A. APACrefauthors \ 2017 . Florida Strawberry Production Costs and Trends - Publication \# FE1013 Florida Strawberry Production Costs and Trends - Publication \# FE1013 \ . Food and Resource Economics Department, UF/IFAS Extension . APACrefURL http://edis.ifas.ufl.edu/fe1013 APACrefURL
work page 2017
-
[8]
Hardaker2004 APACrefauthors Hardaker, J B. , Richardson, J W. , Lien, G. \ Schumann, K D. APACrefauthors \ 2004 6 . Stochastic efficiency analysis with risk aversion bounds: a simplified approach Stochastic efficiency analysis with risk aversion bounds: a simplified approach . The Australian Journal of Agricultural and Resource Economics 48 2 253--270 . A...
Show all 15 references
-
[9]
, MacKenzie, S
Legard2003 APACrefauthors Legard, D. , MacKenzie, S. , Mertely, J. \ Chandler, C. APACrefauthors \ 2003 . Evaluation of fungicides to control anthracnose fruit rot of strawberry, 2001-2002 Evaluation of fungicides to control anthracnose fruit rot of strawberry, 2001-2002 \ . F...
2003
-
[10]
\ Peres, N A
MacKenzie2012b APACrefauthors MacKenzie, S J. \ Peres, N A. APACrefauthors \ 2012 1 . Use of Leaf Wetness and Temperature to Time Fungicide Applications to Control Anthracnose Fruit Rot of Strawberry in Florida Use of Leaf Wetness and Temperature to Time Fungicide Applications...
2012 doi
-
[11]
\ Peres, N A
MacKenzie2012a APACrefauthors MacKenzie, S J. \ Peres, N A. APACrefauthors \ 2012 2 . Use of Leaf Wetness and Temperature to Time Fungicide Applications to Control Botrytis Fruit Rot of Strawberry in Florida Use of Leaf Wetness and Temperature to Time Fungicide Applications to...
2012 doi
-
[12]
\ Outlaw, J L
Richardson2008 APACrefauthors Richardson, J W. \ Outlaw, J L. APACrefauthors \ 2008 . Ranking risky alternatives: innovations in subjective utility analysis Ranking risky alternatives: innovations in subjective utility analysis . WIT Transactions on Information and Communicati...
2008
-
[13]
APACrefauthors \ 2019
USBLS2019 APACrefauthors USBLS. APACrefauthors \ 2019 . Producer Price Index Industry Data . Producer Price Index Industry Data . APACrefURL [ 2019-01-01 ]http://www.bls.gov/ppi/ APACrefURL
2019
-
[14]
APACrefauthors \ 2019
USDA2019 APACrefauthors USDA-AMS. APACrefauthors \ 2019 . Shipping point prices report for Strawberries . Shipping point prices report for Strawberries . APACrefURL [ 2019-01-01 ]https://www.marketnews.usda.gov/mnp/fv-report-config-step1?type=shipPrice APACrefURL
2019
-
[15]
APACrefauthors \ 2019
USDA-NASS2019 APACrefauthors USDA-NASS. APACrefauthors \ 2019 . Fruits 2019: Summary Fruits 2019: Summary \ . Department of Agriculture, National Agricultural Statistics Service, Washington, DC Department of Agriculture, National Agricultural Statistics Service
2019
Reviewed August 14, 2026 · model on record in the stance chip above.
Discussion (0). Continue with ORCID to comment.