REVIEW 3 major objections 5 minor 20 references
LIDAR Data for Deep Learning-Based mmWave Beam-Selection
T0 review · 3 major / 5 minor · reviewed 2026-08-14 · deepseek-v4-flash
Pith's one-line read LIDAR point clouds, plus broadcast base station position, are enough for a CNN to recommend the right mmWave beam pair and cut beam-selection overhead by 12x in LOS and 2x in NLOS.
desk verdict A plausible simulation-only feasibility study for LIDAR-driven mmWave beam selection, but missing the position-only ablation and real-data check that would make the headline gains credible. read the letter →
The pith
A machine-rendered reading of the paper's core claim, the machinery that carries it, and where it could break.
The reading
What carries the argument
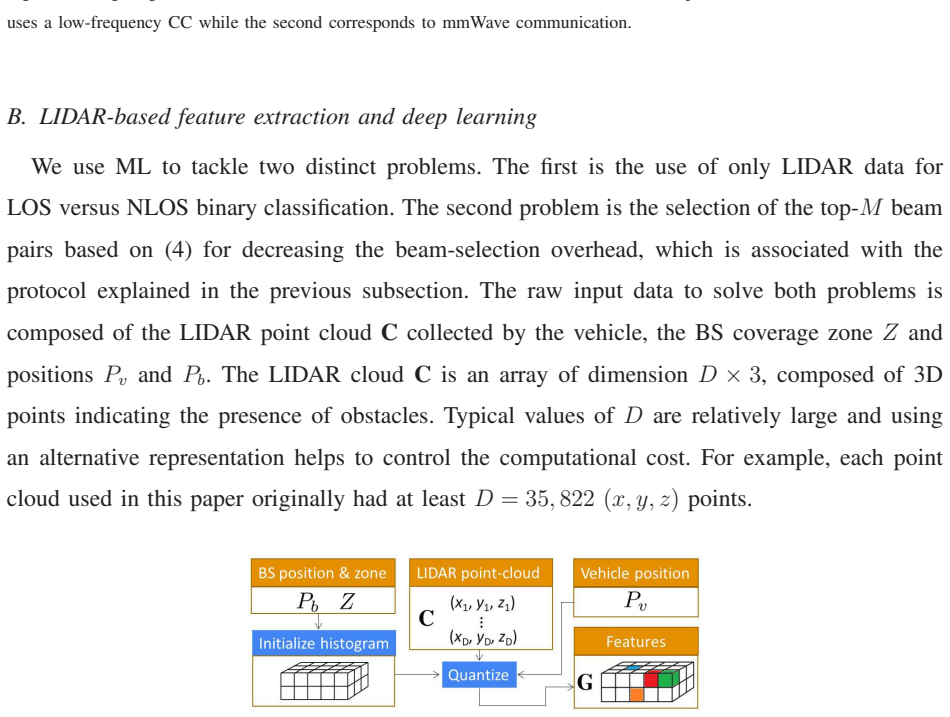
The load-bearing object is the 3D occupancy histogram G: the LIDAR point cloud is quantized into fixed grid bins covering the base station's coverage zone, each bin counting how many laser points fell inside it, with ground reflections and points farther than 25 m removed. This sparse tensor, together with the vehicle's position and the broadcast base station position, is the input to a 13-layer convolutional network with seven convolutional layers, pooling, and dropout. The top-M classification formulation is what makes the protocol work--the radio later tests all M nominated pairs, so the network only needs the true optimal pair to be somewhere in the candidate set, not ranked first. The LOS/NLOS classifier is trained separately and used to switch between LOS-specific and NLOS-specific beam predictors.
What would settle it
Drive an instrumented vehicle through an urban canyon with a co-located LIDAR scanner and a 60 GHz channel sounder, train the CNN on the simulated pipeline, and check how often the measured optimal beam pair falls in the nominated M-set; if the hit rate falls far below the simulated values in either LOS or NLOS, the central claim is refuted.
Extended reading notes
Core claim
On the paper's own terms, the central discovery is that the geometry of the environment, as seen through a LIDAR point cloud, is enough to predict which millimeter-wave beam pair will be optimal. Concretely, a 13-layer CNN takes a fixed 3D occupancy histogram of the point cloud plus vehicle and base station positions and outputs either a LOS/NLOS decision or a top-M classification over the 240 possible beam pairs. The reported simulations show that with M candidates the optimal pair is contained in the nominated set often enough to cut beam-selection overhead by 12x in LOS and 2x in NLOS with no throughput loss, and that the method tolerates 3 m positioning error and 0.1 m LIDAR noise. Because all computation happens on the vehicle, the system does not depend on other vehicles being connected.
Load-bearing premise
The load-bearing premise is that the paired simulation of traffic, ray tracing, and LIDAR reproduces the real joint statistics of point clouds and mmWave channels; if it does not, the reported 12x/2x overhead reductions and accuracy numbers are artifacts of the simulator.
Editorial extensions
If this is right
- Beam-selection overhead drops by 12x in LOS and 2x in NLOS with no throughput loss, so initial link setup in V2I mmWave systems becomes much faster or cheaper.
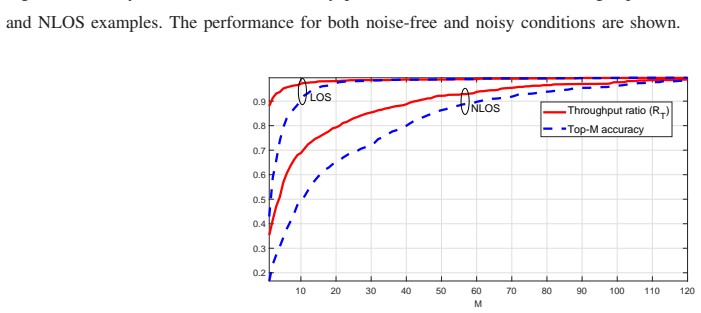
- Even at M=10, the throughput ratio is 97% in LOS and 69% in NLOS, giving operators an explicit knob to trade a 24x overhead reduction against a small throughput cost.
- The scheme tolerates 3 m GNSS errors and 0.1 m LIDAR noise with little accuracy loss, meaning it can run on conventional automotive-grade sensors.
- Because the vehicle performs the prediction from its own LIDAR, the approach does not depend on connected-vehicle penetration rates or on pre-collected fingerprint databases.
Reading between the lines
- If the simulator-to-reality transfer holds, the same architecture could give every LIDAR-equipped vehicle near-instantaneous mmWave beam alignment in dense urban canyons, since no roadside sensing or vehicle-to-vehicle coordination is required.
- The occupancy-histogram representation is a general encoding of the scattering environment, so it could plausibly be reused for related radio tasks such as blockage prediction, handover decisions, or site-specific coverage mapping.
- The large gap between LOS and NLOS performance suggests the CNN is not yet extracting all the geometric information LIDAR provides for NLOS; richer features or fusion with other sensors, which the paper lists as future work, is a natural next step.
- A concrete testable extension would be to train on the simulated pipeline and evaluate on a real 60 GHz street canyon with co-located LIDAR, checking whether the top-M hit rate and throughput ratio survive the sim-to-real gap.
Signed reviews
Editorial analysis
A structured set of objections, weighed in public.
Referee Report
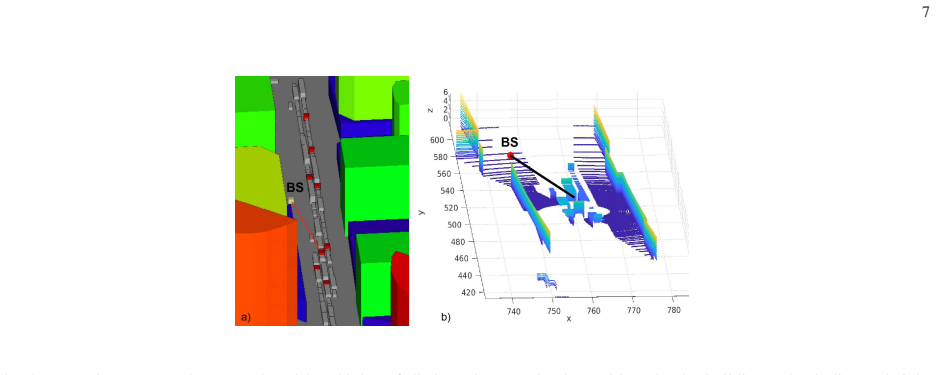
Summary. The paper proposes a distributed architecture in which a connected vehicle uses its onboard LIDAR point cloud, its own position, and a base station's broadcast position to reduce mmWave beam-selection overhead. A 3D histogram of LIDAR points is fed to convolutional neural networks that solve two tasks: LOS/NLOS classification and top-M beam-pair recommendation. The recommended M beam pairs are then evaluated by the base station, reducing exhaustive training over 240 beam pairs. The evaluation is carried out in a co-simulation pipeline combining BlenSor LIDAR, SUMO traffic, and Wireless InSite ray tracing in a Rosslyn urban canyon. Reported results include LOS-detection accuracy, top-M beam-selection accuracy, and a throughput ratio RT, leading to the claim of 12x overhead reduction in LOS and 2x in NLOS without throughput loss.
Significance. If the simulated LIDAR-to-beam statistics transfer to physical V2I deployments, the contribution is meaningful: it removes the dependence on connected-vehicle penetration rate that limits prior position-based approaches and uses only a sensor already present on automated vehicles. The paper also provides a clean protocol description and a geometric decision-stump baseline for LOS detection. The paired simulation pipeline is a useful engineering contribution, and the paper is honest that the results are from co-simulation. However, the significance is currently limited by the absence of any position-only or random baseline for beam selection, the lack of an end-to-end evaluation of the LOS-detection plus beam-selection cascade, and the reliance on a single simulated scenario with no measured validation.
major comments (3)
- [Section IV-B, Fig. 5] The central overhead-reduction claims (12x in LOS and 2x in NLOS) are evaluated only through the proposed method's own top-M accuracy and throughput ratio RT. No position-only baseline, no LIDAR-only ablation, and no random beam-selection baseline are reported. Because the codebook is pruned on training data and the scenario is a single urban canyon, the reader cannot determine how much of the gain is attributable to LIDAR rather than to codebook geometry or position information. Please add at least (i) a position-only CNN baseline using the same architecture and data except for the LIDAR histogram, (ii) a random-selection baseline at the same values of M, and (iii) an ablation without the LIDAR feature.
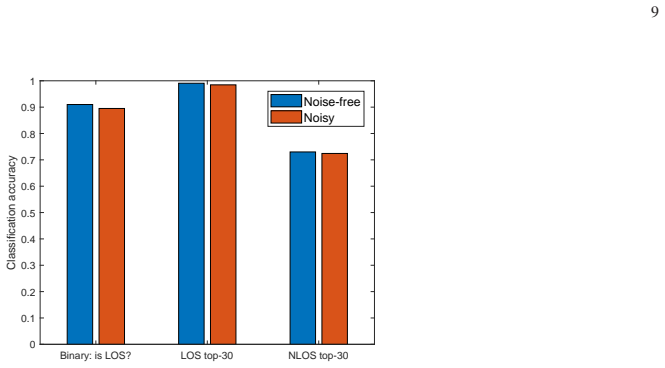
- [Section IV-A, Section IV-B (Figs. 4 and 5)] The protocol in Section III-A requires the vehicle to determine the LOS/NLOS state and then select beams, but the evaluation is split: Fig. 4 reports LOS detection accuracy separately from top-30 beam-selection accuracy on ground-truth LOS and NLOS sets. No experiment measures the end-to-end performance of the cascade (predicted LOS/NLOS state routed to the corresponding beam-selection model). With a 10% LOS-detection error in the noise-free case and with NLOS beam selection substantially less accurate than LOS, the combined system may not deliver the RT values in Fig. 5. Report the end-to-end accuracy and RT under the actual decision rule.
- [Section IV-A] All results come from a single simulated urban canyon in which the LIDAR point clouds and the mmWave ray-tracing channels are generated from the same 3D geometric model (BlenSor/Wireless InSite). The paper acknowledges that the default LIDAR elevation can miss LOS blockers (Section IV-B), and the sensor model adds only Gaussian noise rather than limited vertical field of view, finite resolution, or material-dependent reflectivity. No measured data are used anywhere in the evaluation. The reported accuracies and RT values should therefore be described as demonstrating internal consistency of the paired simulation, not as validated V2I performance. Add a second scenario or a sensitivity analysis, and explicitly scope the abstract and conclusions to simulation-only evidence.
minor comments (5)
- [Section II] The displayed equations 'K < N/log2(N)' and 'SQNR = -10 log10 NMSE' appear without any surrounding text or definitions; they look like leftovers from a previous version and should be removed or properly integrated.
- [Section IV-B, Fig. 4] Fig. 4 lacks numerical axis labels and error bars; please add the underlying accuracy values in the text or on the figure so that the reader can verify the reported 10% and 24% error rates.
- [Section III-B] Please clarify whether the vehicle position Pv and base station position Pb are concatenated to the 3D histogram as network inputs or are used only to construct the grid and set dmax. The text says the raw input includes them, but the described feature is only the histogram G.
- [Section IV-A] The manuscript should report the complete CNN architecture and training procedure (number of filters per layer, pooling and dropout values, number of epochs, early stopping, and the random split procedure), and should state whether the data and code will be released for reproducibility.
- [Abstract and Section IV-B] The abstract claims overhead reduction 'without reduction of throughput' for 12x in LOS and 2x in NLOS, but the specific operating points (M values and corresponding RT values) are not stated; Fig. 5 reports RT=0.94 at M=60 for NLOS, so the reader cannot check the 'without throughput reduction' statement without additional numbers.
Circularity Check
No circularity: LIDAR-to-beam predictions are trained and tested on disjoint simulated data; the simulation-realism gap is a validation limitation, not a circular derivation.
full rationale
No circular step found. The paper's load-bearing claims are that LIDAR features allow LOS/NLOS detection and top-M beam-pair recommendation, and that this reduces beam-selection overhead. These claims are evaluated by training CNNs on 80% of simulated examples and testing on the disjoint remaining 20%; the labels come from ray-traced channels via Eq. (4) and the features come from BlenSor LIDAR histograms. No fitted parameter is later relabeled as a prediction, no derived quantity is identical by construction to an input, and no uniqueness or ansatz assertion is imported from a self-citation. The reference to [17] supplies simulation parameters and is authored by overlapping authors, but the learning results are computed from the actual simulation outputs rather than imported from that citation; thus it is a normal methodological citation, not load-bearing circularity. The shared 3D scene used by both the LIDAR and ray-tracing simulators means LIDAR features are highly informative for beam states in simulation; this is a realism and external-validation limitation of the synthetic evaluation, not a circularity, because shared geometry is the physical mechanism by which LIDAR is expected to inform beam selection. The paper does not define LIDAR features in terms of the beam labels or vice versa. Under the provided taxonomy, this is a standard non-circular supervised learning pipeline, so the appropriate score is 0.
Assumptions & free parameters
free parameters (5)
- LIDAR histogram grid resolution (bx, by, bz) =
6, 6, 3 bits
- LIDAR range cutoff dmax =
25 m
- Decision stump threshold gamma =
not stated in paper
- Beam-label zeroing threshold =
6 dB below the maximum y(p,q)
- Codebook pruning frequency cutoff =
kept codevectors chosen more than 100 times in the training set
assumptions (3)
- domain assumption Ray-tracing combined with the wideband geometric channel model in Eq. (1) yields ground-truth mmWave channels for every vehicle position.
- domain assumption BlenSor LIDAR point clouds reproduce the spatial structure that determines mmWave LOS/NLOS and beam direction in the same 3D scenario.
- domain assumption The single Rosslyn urban canyon scenario and SUMO traffic placements are representative of V2I environments.
Cite this review
Pith. "Pith review of LIDAR Data for Deep Learning-Based mmWave Beam-Selection." pith.science (2026). https://pith.science/paper/JZVOUQ7F
@misc{pith2026190807488,
  author       = {Pith},
  title        = {Pith review of: LIDAR Data for Deep Learning-Based mmWave Beam-Selection},
  year         = {2026},
  howpublished = {\url{https://pith.science/paper/JZVOUQ7F}},
  note         = {Machine review of arXiv:1908.07488}
}
read the original abstract
Millimeter wave communication systems can leverage information from sensors to reduce the overhead associated with link configuration. LIDAR (light detection and ranging) is one sensor widely used in autonomous driving for high resolution mapping and positioning. This paper shows how LIDAR data can be used for line-of-sight detection and to reduce the overhead in millimeter wave beam-selection. In the proposed distributed architecture, the base station broadcasts its position. The connected vehicle leverages its LIDAR data to suggest a set of beams selected via a deep convolutional neural network. Co-simulation of communications and LIDAR in a vehicle-to-infrastructure (V2I) scenario confirm that LIDAR can help configuring mmWave V2I links.
Figures

Figures from the paper (2 more)
Reference graph
Works this paper leans on
-
[1]
Mil limeter-wave communication with out-of-band information ,
N. Gonz´ alez-Prelcic, A. Ali, V . V a, and R. W. Heath, “Mil limeter-wave communication with out-of-band information ,” IEEE Commun. Mag. , vol. 55, no. 12, pp. 140–146, Dec. 2017
work page 2017
-
[2]
Obstacle avoidance cell discovery using mm-waves dir ective antennas in 5G networks,
A. Capone, I. Filippini, V . Sciancalepore, and D. Tremol ada, “Obstacle avoidance cell discovery using mm-waves dir ective antennas in 5G networks,” in Proc. IEEE 26th Ann. Int. Symp. on Personal, Indoor, and Mobi le Radio Communications (PIMRC), Aug. 2015, pp. 2349–2353
work page 2015
-
[3]
Context information based init ial cell search for millimeter wave 5G cellular networks,
W. B. Abbas and M. Zorzi, “Context information based init ial cell search for millimeter wave 5G cellular networks,” i n 2016 European Conf. on Networks and Comm. (EuCNC) , Jun. 2016, pp. 111–116
work page 2016
-
[4]
Position-Aided mm-Wave Beam T raining Under NLOS Conditions,
J. C. Aviles and A. Kouki, “Position-Aided mm-Wave Beam T raining Under NLOS Conditions,” IEEE Access , vol. 4, pp. 8703–8714, 2016
work page 2016
-
[5]
Beam design for beam switching based millimeter wave vehicle-to- infrastructure communications,
V . V a, T. Shimizu, G. Bansal, and R. W. Heath, “Beam design for beam switching based millimeter wave vehicle-to- infrastructure communications,” in Proc. IEEE Int. Conf. on Comm. (ICC) , May 2016, pp. 1–6
work page 2016
-
[6]
Mm -Wave on wheels: Practical 60 GHz vehicular communication without beam training,
A. Loch, A. Asadi, G. H. Sim, J. Widmer, and M. Hollick, “Mm -Wave on wheels: Practical 60 GHz vehicular communication without beam training,” in 9th COMSNETS , Jan. 2017, pp. 1–8
work page 2017
-
[7]
Inv erse Multipath Fingerprinting for Millimeter Wave V2I Beam Alignment,
V . V a, J. Choi, T. Shimizu, G. Bansal, and R. W. Heath, “Inv erse Multipath Fingerprinting for Millimeter Wave V2I Beam Alignment,” IEEE Trans. V eh. Technol., vol. 67, no. 5, pp. 4042–4058, May 2018
work page 2018
-
[8]
Millimeter-Wave V ehicular Communicat ion to Support Massive Automotive Sensing,
J. Choi, V . V a, N. Gonz´ alez-Prelcic, R. Daniels, C. R. Bh at, and R. W. Heath, “Millimeter-Wave V ehicular Communicat ion to Support Massive Automotive Sensing,” IEEE Commun. Mag. , vol. 54, no. 12, pp. 160–167, Dec. 2016
work page 2016
Show all 20 references
-
[9]
Fast millimeter-wave beam trai ning with receive beamforming,
J. Kim and A. F. Molisch, “Fast millimeter-wave beam trai ning with receive beamforming,” Journal of Comm. and Networks , vol. 16, no. 5, pp. 512–522, Oct. 2014
2014
-
[10]
Enha nced Random Access and Beam Training for Millimeter Wave Wireless Local Networks With High User Density,
P . Zhou, X. Fang, Y . Fang, Y . Long, R. He, and X. Han, “Enha nced Random Access and Beam Training for Millimeter Wave Wireless Local Networks With High User Density,” IEEE Trans. Wireless Commun. , vol. 16, no. 12, pp. 7760–7773, Dec. 2017
2017
-
[11]
Steering with eyes closed: Mm-Wave beam steering without in-band measurement,
T. Nitsche, A. B. Flores, E. W. Knightly, and J. Widmer, “ Steering with eyes closed: Mm-Wave beam steering without in-band measurement,” in Proc. INFOCOM , Apr. 2015, pp. 2416–2424
2015
-
[12]
Millime ter Wave Beam-Selection Using Out-of-Band Spatial Informa tion,
A. Ali, N. Gonz´ alez-Prelcic, and R. W. Heath, “Millime ter Wave Beam-Selection Using Out-of-Band Spatial Informa tion,” IEEE Trans. Wireless Commun. , vol. 17, no. 2, pp. 1038–1052, 2017
2017
-
[13]
Radar aided beam alignment in MmWave V2I communications supporting antenna diversity,
N. Gonz´ alez-Prelcic, R. M´ endez-Rial, and R. W. Heath , “Radar aided beam alignment in MmWave V2I communications supporting antenna diversity,” in Proc. Inf. The. App. W orkshop (ITA) , Jan. 2016
2016
-
[14]
Deep learning,
Y . LeCun, Y . Bengio, and G. Hinton, “Deep learning,” Nature, vol. 521, pp. 436–444, 2015
2015
-
[15]
G´ eron, Hands-On Machine Learning with Scikit-Learn and TensorFlo w
A. G´ eron, Hands-On Machine Learning with Scikit-Learn and TensorFlo w. O’Reilly Media, 2017
2017
-
[16]
Statistical analysis of Bayes optimal subset ranking,
D. Cossock and T. Zhang, “Statistical analysis of Bayes optimal subset ranking,” IEEE Trans. Inform. Theory , vol. 54, no. 11, pp. 5140–5154, Nov. 2008
2008
-
[17]
5G MIMO data for machine learning: Applicat ion to beam-selection using deep learning,
A. Klautau, P . Batista, N. Gonz´ alez-Prelcic, Y . Wang,and R. W. Heath, “5G MIMO data for machine learning: Applicat ion to beam-selection using deep learning,” in Proc. Inf. Theory Appl. W orkshop (ITA) , 2018
2018
-
[18]
Accurate collaborative globally- referenced digital mapping with standard GNSS,
L. Narula, J. M. Wooten, M. J. Murrian, D. M. LaChapelle, and T. E. Humphreys, “Accurate collaborative globally- referenced digital mapping with standard GNSS,” Sensors, vol. 18, no. 8, 2018. January 14, 2020 DRAFT 11
2018
-
[19]
BlenSor : Blender sensor simulation toolbox,
M. Gschwandtner, R. Kwitt, A. Uhl, and W. Pree, “BlenSor : Blender sensor simulation toolbox,” in Proc. 7th Int. Symp. Advances in Visual Computing , 2011, pp. 199–208
2011
-
[20]
Recent development and applications of SUMO - Simulation of Urban MObility,
D. Krajzewicz, J. Erdmann, M. Behrisch, and L. Bieker, “ Recent development and applications of SUMO - Simulation of Urban MObility,” International Journal On Advances in Systems and Measureme nts, vol. 5, no. 3&4, pp. 128–138, Dec. 2012. January 14, 2020 DRAFT
2012
Reviewed August 14, 2026 · model on record in the stance chip above.
Discussion (0). Continue with ORCID to comment.