Context-Aware Explanations for Spatialized Document Layouts
Pith reviewed 2026-06-29 02:29 UTC · model grok-4.3
The pith
Spatially grounded explanations are perceived as more helpful than content-only baselines for interpreting the spatial organization of document layouts.
A machine-rendered reading of the paper's core claim, the machinery that carries it, and where it could break.
Core claim
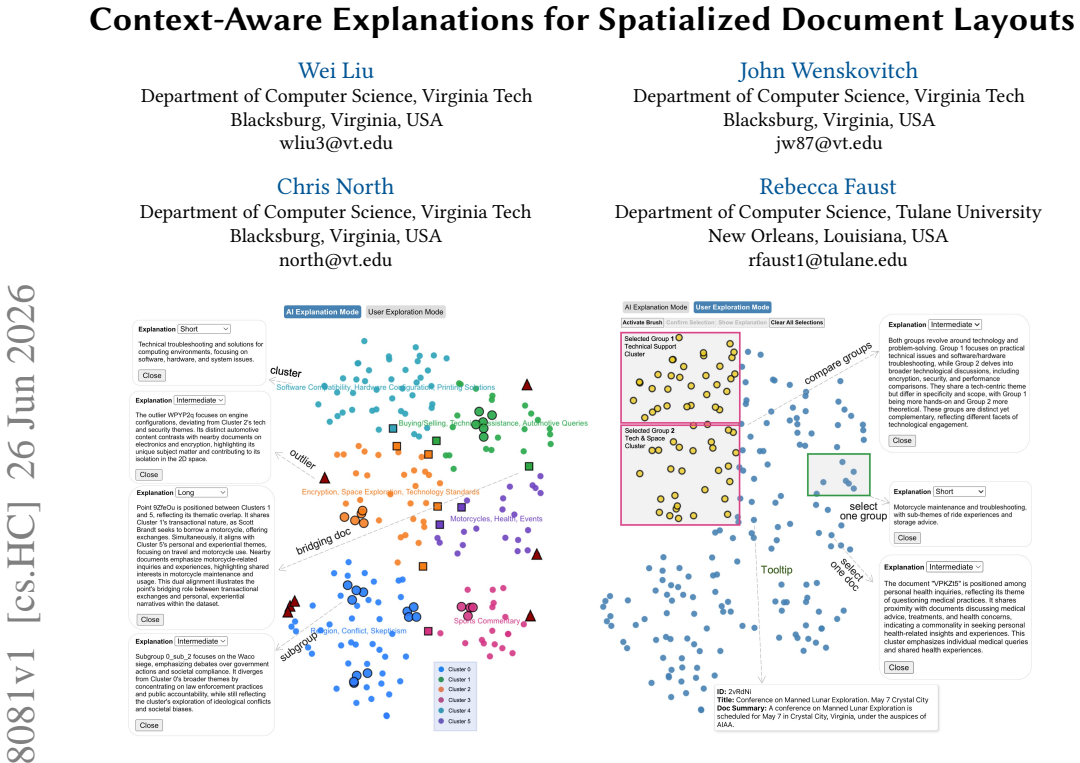
CAPE identifies salient spatial patterns and constructs multi-level contextual representations to guide LLM-based explanation generation, producing natural-language accounts that users perceive as more helpful than content-only baselines when interpreting the spatial organization of document layouts.
What carries the argument
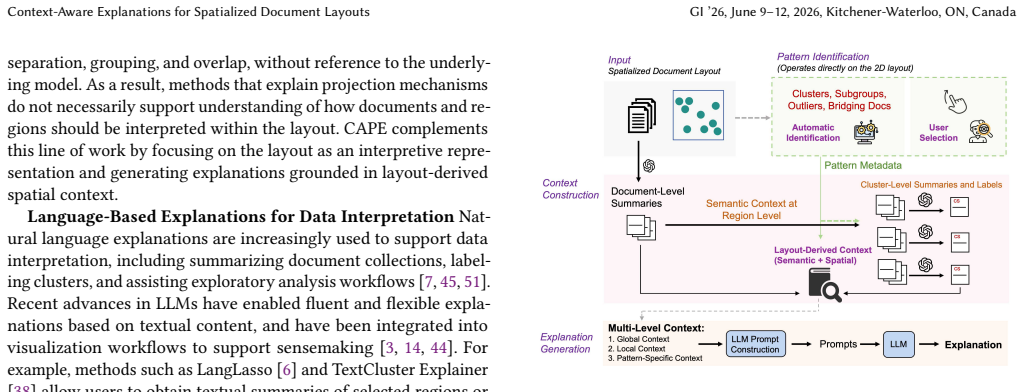
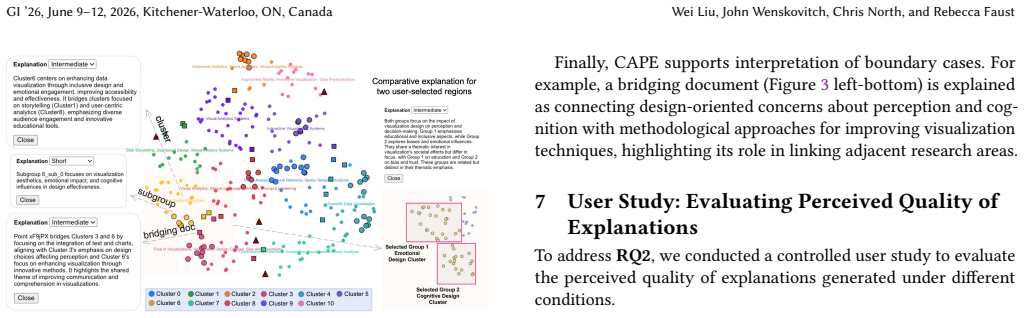
CAPE framework that detects spatial patterns (clusters, subgroups, outliers, bridging documents) and builds multi-level contextual representations to steer LLM explanation generation.
If this is right
- Explanations can be generated at multiple levels of detail to support both overviews and focused exploration.
- The same spatial-pattern approach applies to both news and scholarly document collections.
- Users gain better support for understanding relationships between layout regions than content summaries alone provide.
Where Pith is reading between the lines
- The method could be tested on non-text spatial layouts such as image collections or network visualizations.
- Combining CAPE with interactive brushing or filtering might further reduce the effort needed to explore large layouts.
- If spatial-pattern detection improves, explanation quality would likely rise without changing the LLM component.
Load-bearing premise
The assumption that automatically detected spatial patterns are meaningful and correctly identified by the layout algorithm and that feeding them to the LLM yields accurate rather than merely plausible explanations.
What would settle it
A replication study in which participants rate content-only LLM explanations as equally or more helpful than CAPE explanations for the same set of document layouts.
Figures
read the original abstract
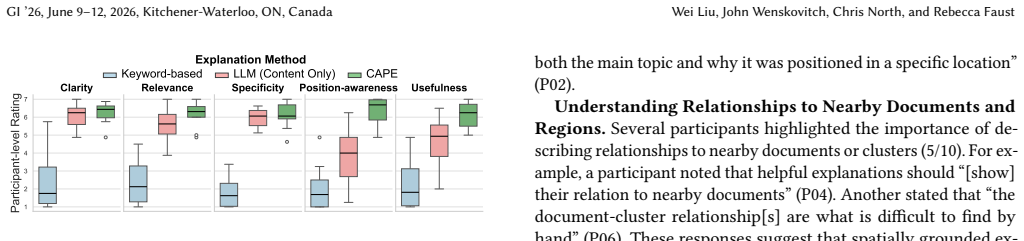
Spatialized document layouts are widely used for exploratory analysis of text corpora, but interpreting the spatial organization of documents and the relationships between regions remains challenging. Existing approaches primarily summarize document content or explain how layouts are generated, providing limited support for understanding spatial relationships within the layout itself. We present CAPE, a context-aware explanation framework that generates natural-language explanations grounded in both document semantics and layout-derived spatial context. CAPE identifies salient spatial patterns (e.g., clusters, subgroups, outliers, and bridging documents) and constructs multi-level contextual representations to guide LLM-based explanation generation. It supports both AI-guided overview and user-driven exploration, with explanations available at multiple levels of detail. We demonstrate CAPE on news and scholarly document layouts and evaluate it in a controlled user study against keyword-based and content-only LLM baselines. Our results suggest that spatially grounded explanations are perceived as more helpful than content-only baselines for interpreting the spatial organization of document layouts.
Editorial analysis
A structured set of objections, weighed in public.
Referee Report
Summary. The manuscript introduces CAPE, a context-aware explanation framework for spatialized document layouts. CAPE identifies salient spatial patterns (clusters, subgroups, outliers, bridging documents), builds multi-level contextual representations from document semantics and layout geometry, and prompts an LLM to produce natural-language explanations at varying levels of detail. It supports both AI-guided overviews and user-driven queries. The approach is demonstrated on news and scholarly corpora and evaluated via a controlled user study against keyword-based and content-only LLM baselines; the authors conclude that spatially grounded explanations are perceived as more helpful for interpreting spatial organization.
Significance. If the user-study preference and the underlying pattern detection hold, the work addresses a genuine gap in exploratory text visualization: current systems either summarize content or explain layout algorithms but rarely explain why documents are spatially related. The multi-level, context-aware design and explicit use of layout-derived features (rather than content alone) are strengths. The result, if quantified and validated, would be of interest to HCI and visualization venues concerned with sensemaking in high-dimensional text data.
major comments (2)
- [Evaluation] Evaluation section (user study): the abstract and manuscript provide no participant count, experimental design details, statistical tests, or effect sizes for the claim that spatially grounded explanations are perceived as more helpful. The result is stated only as a suggestion; without these quantities it is impossible to judge whether the preference is robust or practically meaningful.
- [CAPE framework] CAPE framework / pattern identification (likely §3): the paper states that CAPE “identifies salient spatial patterns” and feeds them to the LLM but supplies no validation of pattern quality (e.g., agreement with human-labeled clusters or semantic coherence metrics) and no fidelity check that the generated explanations accurately reflect the detected patterns rather than being merely fluent. This validation is load-bearing for the central claim; its absence leaves open the possibility that user preference reflects surface appeal.
minor comments (1)
- [Abstract] The abstract uses “our results suggest”; the full paper should replace this with quantified findings (means, confidence intervals, p-values) once the evaluation details are supplied.
Simulated Author's Rebuttal
We thank the referee for their constructive comments. We address each major comment below and describe the revisions we will make.
read point-by-point responses
-
Referee: [Evaluation] Evaluation section (user study): the abstract and manuscript provide no participant count, experimental design details, statistical tests, or effect sizes for the claim that spatially grounded explanations are perceived as more helpful. The result is stated only as a suggestion; without these quantities it is impossible to judge whether the preference is robust or practically meaningful.
Authors: We agree that the current manuscript does not report participant counts, design details, statistical tests, or effect sizes with sufficient prominence, and that the phrasing 'suggest' is too cautious. The full evaluation (Section 5) describes a controlled study but omits these quantities in the submitted version. In the revision we will add: 24 participants, within-subjects design with three conditions, repeated-measures ANOVA with post-hoc tests and Bonferroni correction, exact p-values, and effect sizes (partial η^{2}). We will also update the abstract and results text to report the findings directly rather than as a suggestion. revision: yes
-
Referee: [CAPE framework] CAPE framework / pattern identification (likely §3): the paper states that CAPE “identifies salient spatial patterns” and feeds them to the LLM but supplies no validation of pattern quality (e.g., agreement with human-labeled clusters or semantic coherence metrics) and no fidelity check that the generated explanations accurately reflect the detected patterns rather than being merely fluent. This validation is load-bearing for the central claim; its absence leaves open the possibility that user preference reflects surface appeal.
Authors: We acknowledge that the submitted manuscript provides no quantitative validation of the detected spatial patterns or of explanation fidelity. Pattern detection uses standard geometric methods on the 2D embedding (DBSCAN for clusters, isolation forest for outliers, distance-based rules for bridges), but these steps were not validated against human labels or coherence metrics. In the revised manuscript we will add (in Section 3 or a new subsection) inter-annotator agreement on a sampled set of patterns and embedding-based coherence scores. We will also add a fidelity evaluation in which human raters assess how accurately generated explanations match the input patterns, with results reported alongside the user study. revision: yes
Circularity Check
No significant circularity; claims rest on user study against explicit baselines
full rationale
The paper introduces CAPE as a framework that detects spatial patterns and feeds them to an LLM for explanations, then evaluates perceived helpfulness via a controlled user study against keyword-based and content-only baselines. No equations, fitted parameters, or derivation steps appear. No self-citations are invoked as load-bearing uniqueness theorems or ansatzes. The central result (user preference for spatially grounded explanations) is an empirical outcome, not a quantity forced by construction from the inputs. The skeptic concern about pattern validity or LLM fidelity is a correctness/assumption issue, not a circularity reduction.
Axiom & Free-Parameter Ledger
Reference graph
Works this paper leans on
-
[1]
Christopher Andrews, Alex Endert, and Chris North. 2010. Space to think: large high-resolution displays for sensemaking. InProceedings of the SIGCHI Conference on Human Factors in Computing Systems(Atlanta, Georgia, USA) (CHI ’10). Association for Computing Machinery, New York, NY, USA, 55–64. doi:10.1145/1753326.1753336
-
[2]
Christopher Andrews and Chris North. 2013. The Impact of Physical Navigation on Spatial Organization for Sensemaking.IEEE Transactions on Visualization and Computer Graphics19, 12 (2013), 2207–2216. doi:10.1109/TVCG.2013.205
-
[3]
Alexander Bendeck and John Stasko. 2025. An Empirical Evaluation of the GPT-4 Multimodal Language Model on Visualization Literacy Tasks.IEEE Transactions on Visualization and Computer Graphics31, 1 (2025), 1105–1115. doi:10.1109/ TVCG.2024.3456155
arXiv 2025
-
[4]
Yali Bian and Chris North. 2021. DeepSI: Interactive Deep Learning for Semantic Interaction. InProceedings of the 26th International Conference on Intelligent User Interfaces(College Station, TX, USA)(IUI ’21). Association for Computing Machinery, New York, NY, USA, 197–207. doi:10.1145/3397481.3450670
-
[5]
Yali Bian, Chris North, Eric Krokos, and Sarah Joseph. 2021. Semantic Explanation of Interactive Dimensionality Reduction. In2021 IEEE Visualization Conference (VIS). 26–30. doi:10.1109/VIS49827.2021.9623322
-
[6]
Raphael Buchmüller, Dennis Collaris, Linhao Meng, and Angelos Chatzimparm- pas. 2026. LangLasso: Interactive Cluster Descriptions through LLM Explanation. arXiv:2601.10458 [cs.HC] https://arxiv.org/abs/2601.10458
arXiv 2026
-
[7]
Kiroong Choe, Chaerin Lee, Soohyun Lee, Jiwon Song, Aeri Cho, Nam Wook Kim, and Jinwook Seo. 2025. Enhancing Data Literacy On-Demand: LLMs as Guides for Novices in Chart Interpretation.IEEE Transactions on Visualization and Computer Graphics31, 9 (2025), 4712–4727. doi:10.1109/TVCG.2024.3413195
-
[8]
Michelle Dowling, Nathan Wycoff, Brian Mayer, John Wenskovitch, Scotland Leman, Leanna House, Nicholas Polys, Chris North, and Peter Hauck. 2019. Interactive visual analytics for sensemaking with big text.Big Data Research16 (2019), 49–58. doi:10.1016/j.bdr.2019.04.003
-
[9]
Alex Endert, Russ Burtner, Nick Cramer, Ralph Perko, Shawn Hampton, and Kristin Cook. 2013. Typograph: Multiscale spatial exploration of text documents. In2013 IEEE International Conference on Big Data. 17–24. doi:10.1109/BigData. 2013.6691709
-
[10]
Alex Endert, Patrick Fiaux, and Chris North. 2012. Semantic Interaction for Sensemaking: Inferring Analytical Reasoning for Model Steering.IEEE Transactions on Visualization and Computer Graphics18, 12 (2012), 2879–2888. doi:10.1109/TVCG.2012.260
-
[11]
Alex Endert, Patrick Fiaux, and Chris North. 2012. Semantic interaction for visual text analytics. InProceedings of the SIGCHI Conference on Human Factors in Computing Systems(Austin, Texas, USA)(CHI ’12). Association for Computing Machinery, New York, NY, USA, 473–482. doi:10.1145/2207676.2207741
-
[12]
Alex Endert, Seth Fox, Dipayan Maiti, Scotland Leman, and Chris North. 2012. The semantics of clustering: analysis of user-generated spatializations of text doc- uments. InProceedings of the International Working Conference on Advanced Visual Interfaces(Capri Island, Italy)(A VI ’12). Association for Computing Machinery, New York, NY, USA, 555–562. doi:10...
-
[13]
Rebecca Faust, David Glickenstein, and Carlos Scheidegger. 2019. DimReader: Axis lines that explain non-linear projections.IEEE Transactions on Visualization and Computer Graphics25, 1 (2019), 481–490. doi:10.1109/TVCG.2018.2865194
-
[14]
Rao Fu, Jingyu Liu, Xilun Chen, Yixin Nie, and Wenhan Xiong. 2024. Scene- LLM: Extending Language Model for 3D Visual Understanding and Reasoning. arXiv:2403.11401 [cs.CV] https://arxiv.org/abs/2403.11401
arXiv 2024
-
[15]
Fausto German, Brian Keith, and Chris North. 2025. Narrative Trails: A Method for Coherent Storyline Extraction via Maximum Capacity Path Optimization. arXiv:2503.15681 [cs.IR] https://arxiv.org/abs/2503.15681
arXiv 2025
-
[17]
Jeffrey Heer and Ben Shneiderman. 2012. Interactive dynamics for visual analysis: A taxonomy of tools that support the fluent and flexible use of visualizations. Queue10, 2 (2012), 30–55
2012
-
[18]
Florian Heimerl, Steffen Lohmann, Simon Lange, and Thomas Ertl. 2014. Word Cloud Explorer: Text Analytics Based on Word Clouds. In2014 47th Hawaii International Conference on System Sciences. 1833–1842. doi:10.1109/HICSS.2014. 231
-
[19]
Z. Huang, D. Witschard, K. Kucher, and A. Kerren. 2023. VA + Embeddings STAR: A State-of-the-Art Report on the Use of Embeddings in Visual Analytics. Computer Graphics Forum42, 3 (2023), 539–571. doi:10.1111/cgf.14859
-
[20]
IEEE VIS. 2026. IEEE Visualization and Visual Analytics Conference. https: //ieeevis.org/ Retrieved May 10, 2026
2026
-
[21]
Hyeon Jeon, Jeongin Park, Sungbok Shin, and Jinwook Seo. 2025. Stop Misusing t-SNE and UMAP for Visual Analytics. arXiv:2506.08725 [cs.HC] https://arxiv. org/abs/2506.08725
arXiv 2025
-
[22]
2008.Visual Analytics: Definition, Pro- cess, and Challenges
Daniel Keim, Gennady Andrienko, Jean-Daniel Fekete, Carsten Görg, Jörn Kohlhammer, and Guy Melançon. 2008.Visual Analytics: Definition, Pro- cess, and Challenges. Springer Berlin Heidelberg, Berlin, Heidelberg, 154–175. doi:10.1007/978-3-540-70956-5_7
-
[23]
Jason S. Kessler. 2017. Scattertext: a Browser-Based Tool for Visualizing how Corpora Differ. arXiv:1703.00565 [cs.CL] https://arxiv.org/abs/1703.00565
Pith/arXiv arXiv 2017
-
[24]
Ken Lang. 1995. Newsweeder: Learning to filter netnews. Available at http://people.csail.mit.edu/jrennie/20Newsgroups/
1995
-
[25]
Haitao Li, Qian Dong, Junjie Chen, Huixue Su, Yujia Zhou, Qingyao Ai, Ziyi Ye, and Yiqun Liu. 2024. LLMs-as-Judges: A Comprehensive Survey on LLM-based Evaluation Methods. arXiv:2412.05579 [cs.CL] https://arxiv.org/abs/2412.05579
Pith/arXiv arXiv 2024
-
[26]
Gitre, Chris North, and Doug A
Lee Lisle, Kylie Davidson, Edward J.K. Gitre, Chris North, and Doug A. Bowman
-
[27]
In2021 IEEE Virtual Reality and 3D User Interfaces (VR)
Sensemaking Strategies with Immersive Space to Think. In2021 IEEE Virtual Reality and 3D User Interfaces (VR). 529–537. doi:10.1109/VR50410.2021.00077
-
[28]
Wei Liu, Eric Krokos, Kirsten Whitley, Rebecca Faust, and Chris North. 2026. LLM-Augmented Semantic Steering of Text Embedding Projection Spaces. In Proceedings of the 2026 International Conference on Advanced Visual Interfaces (A VI ’26). Association for Computing Machinery, New York, NY, USA, Article 30, 9 pages. doi:10.1145/3811427.3811450
-
[29]
Wei Liu, Chris North, and Rebecca Faust. 2024. Visualizing Spatial Semantics of Dimensionally Reduced Text Embeddings. arXiv:2409.03949 [cs.HC] https: //arxiv.org/abs/2409.03949
arXiv 2024
-
[30]
Jordan Crouser, and Alvitta Ottley
Zhengliang Liu, R. Jordan Crouser, and Alvitta Ottley. 2020. Survey on Individual Differences in Visualization.Computer Graphics Forum39, 3 (2020), 693–712. doi:10.1111/cgf.14033
-
[31]
Scott M Lundberg and Su-In Lee. 2017. A Unified Approach to Interpreting Model Predictions. InAdvances in Neural Information Processing Systems, I. Guyon, U. Von Luxburg, S. Bengio, H. Wallach, R. Fergus, S. Vishwanathan, and R. Garnett (Eds.), Vol. 30. Curran Associates, Inc. https://proceedings.neurips.cc/paper_ files/paper/2017/file/8a20a8621978632d76c...
2017
-
[32]
Leland McInnes, John Healy, and James Melville. 2018. UMAP: Uni- form Manifold Approximation and Projection for Dimension Reduction. arXiv:1802.03426 [stat.ML] https://arxiv.org/abs/1802.03426
Pith/arXiv arXiv 2018
-
[33]
Lan Huong Nguyen and Susan Holmes. 2019. Ten quick tips for effective di- mensionality reduction.PLOS Computational Biology15, 6 (06 2019), 1–19. doi:10.1371/journal.pcbi.1006907
-
[34]
Kwanrutai Nokkaew and Rachada Kongkachandra. 2018. Keyphrase Extraction as Topic Identification Using Term Frequency and Synonymous Term Grouping. In 2018 International Joint Symposium on Artificial Intelligence and Natural Language Processing (iSAI-NLP). 1–6. doi:10.1109/iSAI-NLP.2018.8693001
-
[35]
OpenAI. 2026. OpenAI API Documentation. https://platform.openai.com/docs Retrieved May 10, 2026
2026
-
[36]
Rajvardhan Patil, Sorio Boit, Venkat Gudivada, and Jagadeesh Nandigam. 2023. A Survey of Text Representation and Embedding Techniques in NLP.IEEE Access 11 (2023), 36120–36146. doi:10.1109/ACCESS.2023.3266377
-
[37]
Robert Pienta, James Abello, Minsuk Kahng, and Duen Horng Chau. 2015. Scalable graph exploration and visualization: Sensemaking challenges and opportunities. In2015 International Conference on Big Data and Smart Computing (BIGCOMP). 271–278. doi:10.1109/35021BIGCOMP.2015.7072812
-
[38]
Peter Pirolli and Stuart Card. 2005. The sensemaking process and leverage points for analyst technology as identified through cognitive task analysis. In Proceedings of international conference on intelligence analysis, Vol. 5. McLean, VA, USA, 2–4
2005
-
[39]
Shivam Raval, Carolyn Wang, Fernanda Viégas, and Martin Wattenberg. 2023. Explain-and-Test: An Interactive Machine Learning Framework for Exploring Text Embeddings. In2023 IEEE Visualization and Visual Analytics (VIS). 216–220. doi:10.1109/VIS54172.2023.00052
-
[40]
Marco Tulio Ribeiro, Sameer Singh, and Carlos Guestrin. 2016. "Why Should I Trust You?": Explaining the Predictions of Any Classifier. InProceedings of the 22nd ACM SIGKDD International Conference on Knowledge Discovery and Data Mining(San Francisco, California, USA)(KDD ’16). Association for Computing Machinery, New York, NY, USA, 1135–1144. doi:10.1145/...
-
[41]
Tuukka Ruotsalo, Jaakko Peltonen, Manuel Eugster, Dorota Głowacka, Ksenia Konyushkova, Kumaripaba Athukorala, Ilkka Kosunen, Aki Reijonen, Petri Myl- lymäki, Giulio Jacucci, and Samuel Kaski. 2013. Directing exploratory search with interactive intent modeling. InProceedings of the 22nd ACM International Conference on Information & Knowledge Management(San...
-
[42]
Gerard Salton and Christopher Buckley. 1988. Term-weighting approaches in automatic text retrieval.Information Processing & Management24, 5 (1988), 513–523. doi:10.1016/0306-4573(88)90021-0
-
[43]
Ksh Singh, H Mamata Devi, and Anjana Kakoti Mahanta. 2017. Document representation techniques and their effect on the document Clustering and Clas- sification: A Review.International Journal of Advanced Research in Computer Science8, 5 (2017)
2017
-
[44]
Daniel Smilkov, Nikhil Thorat, Charles Nicholson, Emily Reif, Fernanda B. Viégas, and Martin Wattenberg. 2016. Embedding Projector: Interactive Visualization and Interpretation of Embeddings. arXiv:1611.05469 [stat.ML] https://arxiv.org/ abs/1611.05469
Pith/arXiv arXiv 2016
-
[45]
Sangho Suh, Bryan Min, Srishti Palani, and Haijun Xia. 2023. Sensecape: En- abling Multilevel Exploration and Sensemaking with Large Language Models. InProceedings of the 36th Annual ACM Symposium on User Interface Software and Technology(San Francisco, CA, USA)(UIST ’23). Association for Computing Machinery, New York, NY, USA, Article 1, 18 pages. doi:10...
-
[46]
Yuan Sui, Mengyu Zhou, Mingjie Zhou, Shi Han, and Dongmei Zhang. 2024. Table Meets LLM: Can Large Language Models Understand Structured Table Data? A Benchmark and Empirical Study. InProceedings of the 17th ACM Interna- tional Conference on Web Search and Data Mining(Merida, Mexico)(WSDM ’24). Association for Computing Machinery, New York, NY, USA, 645–65...
-
[47]
Flora S. Tsai. 2011. Dimensionality reduction techniques for blog visualization. Expert Systems with Applications38, 3 (2011), 2766–2773. doi:10.1016/j.eswa.2010. 08.067
-
[48]
Laurens Van der Maaten and Geoffrey Hinton. 2008. Visualizing data using t-SNE. Journal of machine learning research9, 11 (2008)
2008
-
[49]
Xiting Wang, Shixia Liu, Junlin Liu, Jianfei Chen, Jun Zhu, and Baining Guo
-
[50]
TopicPanorama: A Full Picture of Relevant Topics.IEEE Transactions on Visualization and Computer Graphics22, 12 (2016), 2508–2521. doi:10.1109/TVCG. 2016.2515592
-
[51]
James Wexler, Mahima Pushkarna, Tolga Bolukbasi, Martin Wattenberg, Fernanda Viégas, and Jimbo Wilson. 2020. The What-If Tool: Interactive Probing of Machine Learning Models.IEEE Transactions on Visualization and Computer Graphics26, 1 (2020), 56–65. doi:10.1109/TVCG.2019.2934619
-
[52]
Wise, J.J
J.A. Wise, J.J. Thomas, K. Pennock, D. Lantrip, M. Pottier, A. Schur, and V. Crow
-
[53]
InProceedings of Visualization 1995 Conference
Visualizing the non-visual: spatial analysis and interaction with information from text documents. InProceedings of Visualization 1995 Conference. 51–58. doi:10.1109/INFVIS.1995.528686
-
[54]
Yang Zhang, Hanlei Jin, Dan Meng, Jun Wang, and Jinghua Tan. 2025. A Comprehensive Survey on Process-Oriented Automatic Text Summarization with Exploration of LLM-Based Methods. arXiv:2403.02901 [cs.AI] https: //arxiv.org/abs/2403.02901
arXiv 2025
discussion (0)
Sign in with ORCID, Apple, or X to comment. Anyone can read and Pith papers without signing in.