Climate-Driven Mortality Forecasting Using Deep Learning
Pith reviewed 2026-06-26 02:17 UTC · model grok-4.3
The pith
Deep learning layers on top of Lee-Carter cut climate-driven mortality forecast errors by 24 percent relative to prior networks.
A machine-rendered reading of the paper's core claim, the machinery that carries it, and where it could break.
Core claim
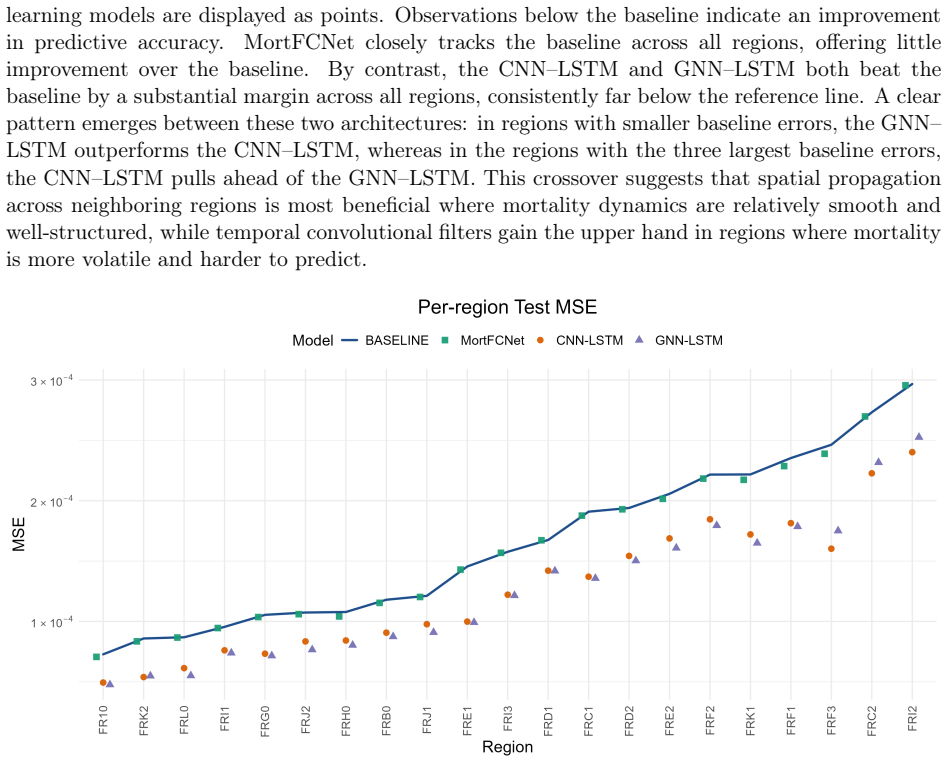
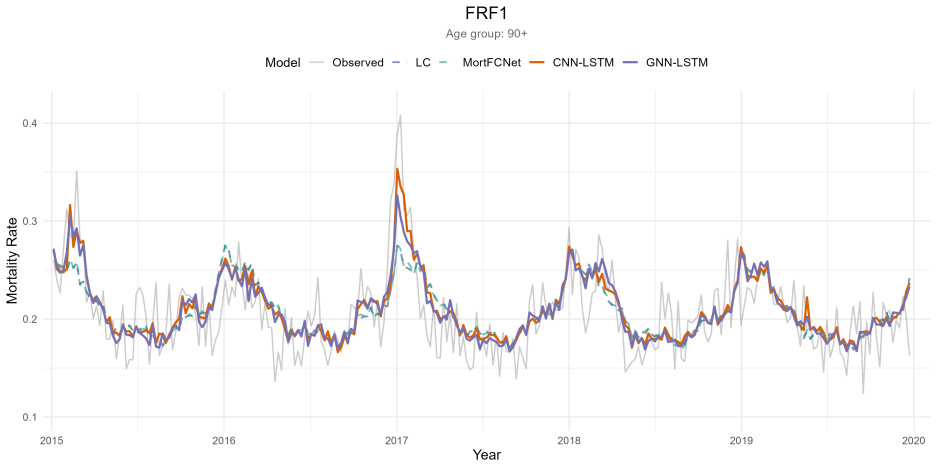
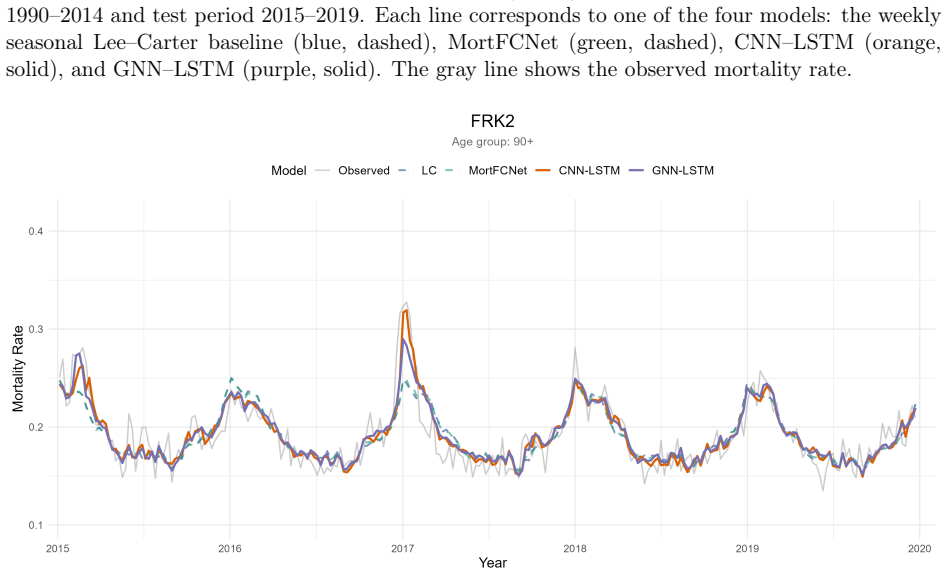
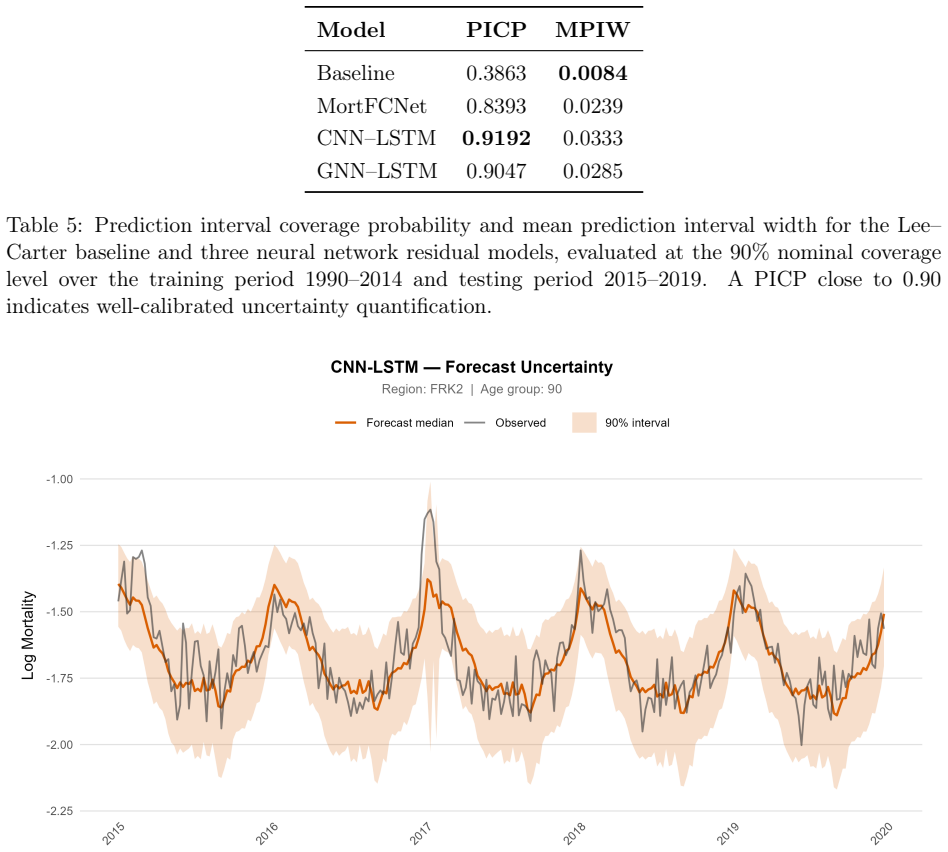
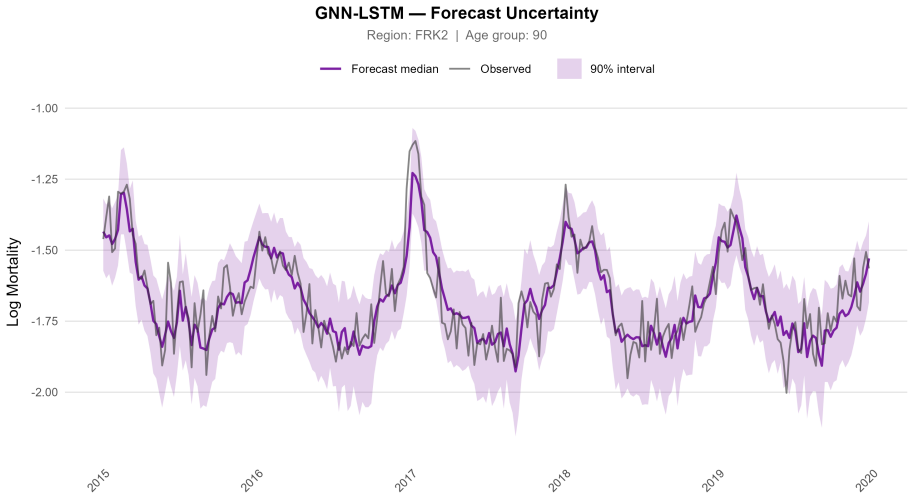
The central claim is that the CNN-LSTM and GNN-LSTM architectures, when added to a Lee-Carter baseline, successfully capture delayed and nonlinear associations between environmental extremes and excess mortality; both models outperform the Lee-Carter baseline and MortFCNet across all regions, each reducing test MSE by approximately 24 percent relative to MortFCNet, with particularly large gains at the oldest ages.
What carries the argument
The two-step framework that fits a regional weekly Lee-Carter model for baseline trends and seasonality, then applies CNN-LSTM or GNN-LSTM networks to the residual excess mortality driven by climate variables, extended via quantile LSTM to produce time-varying prediction intervals.
If this is right
- Forecasts become more accurate for sudden mortality spikes triggered by climate extremes.
- Time-varying prediction intervals supply a more realistic description of extreme climate-driven mortality risk.
- Insurers and pension funds obtain a clearer basis for quantifying climate-related longevity exposure.
- The spatial structure in the GNN-LSTM version accounts for how climate impacts can propagate across neighboring regions.
Where Pith is reading between the lines
- The same two-step structure could be applied to other countries that maintain weekly regional mortality and climate records to check whether the error reductions hold outside France.
- Coupling the quantile outputs with downscaled climate projections would allow scenario-based longevity forecasts under different warming trajectories.
- The graph-based spatial component suggests the model could be adapted to study cross-border transmission of climate mortality effects in densely connected regions.
Load-bearing premise
The mortality variation left after the Lee-Carter baseline is driven mainly by measurable climate and environmental factors rather than by other unmodeled influences or data issues.
What would settle it
Retraining the same architectures on post-2019 weekly data that includes documented heat waves and cold spells, then checking whether the 24 percent MSE reduction disappears or whether performance gains remain after climate variables are removed from the deep-learning inputs.
Figures
read the original abstract
Climate extremes have become important drivers of mortality, producing sudden spikes that traditional mortality models fail to predict. To address this gap, we propose a two-step modelling framework that combines a regional weekly Lee-Carter baseline model that captures long-term mortality trends and overall seasonal patterns, with two complementary deep learning architectures designed to model excess mortality driven by environmental conditions and climate shocks. The first, a CNN-LSTM, captures region-specific temporal responses through convolutional filters. The second, a GNN-LSTM, replaces convolutions with graph-based representations to model spatial mortality dependencies and the propagation of climate-related impacts across regions. Both architectures are further extended to a quantile LSTM framework that produces time-varying prediction intervals. We evaluate our models against both the Lee-Carter baseline and MortFCNet (Zheng et al., 2025). Using French regional data over 1990-2019, our models capture delayed and nonlinear associations between environmental extremes and excess mortality. Both proposed architectures outperform the Lee-Carter baseline and MortFCNet across all regions, each reducing test MSE by approximately 24% relative to the MortFCNet, with particularly large gains at the oldest ages where climate-driven mortality spikes are most severe. From a risk management perspective, the proposed framework provides a more realistic characterization of extreme climate-driven mortality risk, with time-varying prediction intervals that offer a more informed basis for the assessment of climate-related longevity exposure by insurers and pension funds.
Editorial analysis
A structured set of objections, weighed in public.
Referee Report
Summary. The paper proposes a two-step framework for forecasting climate-driven mortality: a regional weekly Lee-Carter model captures baseline trends and seasonality, while CNN-LSTM and GNN-LSTM architectures model excess mortality attributable to environmental and climate variables. The GNN-LSTM variant incorporates spatial dependencies across regions. Both are extended to quantile LSTM for time-varying prediction intervals. On French regional data 1990-2019, the models are claimed to reduce test MSE by ~24% relative to MortFCNet (and outperform Lee-Carter), with largest gains at oldest ages.
Significance. If the reported out-of-sample gains hold under rigorous validation, the work would demonstrate a practical way to incorporate nonlinear climate effects and spatial propagation into mortality models, improving tail-risk characterization for longevity products. The graph-based spatial component is a distinctive technical choice that could generalize to other multi-region forecasting problems.
major comments (2)
- [Abstract] Abstract and (presumably) §3/§4: the central claim of an approximately 24% test-MSE reduction is presented without any description of the train-test split (temporal cutoff, proportion, or stratification by region/age), hyperparameter search procedure, or regularization/overfitting diagnostics. These omissions make it impossible to verify that the numerical improvement reflects genuine generalization rather than in-sample fitting.
- [Abstract] Abstract: the attribution of performance gains specifically to the climate-variable inputs rests on the untested premise that residual mortality after the Lee-Carter baseline is driven primarily by the supplied environmental covariates; no ablation removing those covariates or comparison against non-climate residual models is mentioned.
minor comments (1)
- The citation Zheng et al. (2025) for MortFCNet appears to be a future or in-preparation reference; its status should be clarified or replaced with a published alternative if possible.
Simulated Author's Rebuttal
We are grateful to the referee for the constructive comments, which identify key areas where additional transparency will strengthen the manuscript. We respond point by point to the major comments below.
read point-by-point responses
-
Referee: [Abstract] Abstract and (presumably) §3/§4: the central claim of an approximately 24% test-MSE reduction is presented without any description of the train-test split (temporal cutoff, proportion, or stratification by region/age), hyperparameter search procedure, or regularization/overfitting diagnostics. These omissions make it impossible to verify that the numerical improvement reflects genuine generalization rather than in-sample fitting.
Authors: We agree that the abstract presents the performance claim without these details and that the manuscript body does not supply a complete account of the temporal split, hyperparameter procedure, or overfitting diagnostics. We will revise both the abstract (with a concise reference to the temporal split) and Sections 3/4 to describe the train-test split (1990–2014 training with internal validation, 2015–2019 test, stratified by region and age), the grid-search hyperparameter protocol, regularization (dropout and early stopping), and supporting diagnostics such as training/validation loss curves. These additions will allow readers to assess generalization directly. revision: yes
-
Referee: [Abstract] Abstract: the attribution of performance gains specifically to the climate-variable inputs rests on the untested premise that residual mortality after the Lee-Carter baseline is driven primarily by the supplied environmental covariates; no ablation removing those covariates or comparison against non-climate residual models is mentioned.
Authors: We agree that an explicit ablation removing the climate covariates would provide stronger evidence that the reported gains are attributable to the environmental inputs rather than to the flexibility of the DL architectures alone. The current manuscript does not contain such an ablation. We will add this analysis in the revision by retraining the CNN-LSTM and GNN-LSTM models without the climate covariates and reporting the resulting change in test MSE relative to the full models. revision: yes
Circularity Check
No significant circularity; empirical test-set results are independent of model construction
full rationale
The paper presents a two-step framework (Lee-Carter baseline plus DL residual models) evaluated via held-out test MSE on French regional data 1990-2019. The central claim of ~24% MSE reduction versus MortFCNet is a direct numerical comparison on unseen data after training; no equation reduces the reported performance metric to a fitted parameter by definition, no self-citation supplies a uniqueness theorem or ansatz that forces the result, and the architectures are standard CNN-LSTM/GNN-LSTM variants whose outputs are not tautological with their inputs. The derivation chain is therefore self-contained against external benchmarks.
Axiom & Free-Parameter Ledger
free parameters (2)
- Lee-Carter parameters
- CNN-LSTM and GNN-LSTM weights and hyperparameters
axioms (1)
- domain assumption Environmental extremes produce measurable excess mortality not captured by the Lee-Carter baseline
Reference graph
Works this paper leans on
-
[1]
Ba, J. L., Kiros, J. R., and Hinton, G. E. (2016). Layer normalization. Working paper. doi:10.48550/arXiv.1607.06450
work page internal anchor Pith review Pith/arXiv arXiv doi:10.48550/arxiv.1607.06450 2016
-
[2]
Bai, J. and Perron, P. (2003). Computation and analysis of multiple structural change models. Journal of Applied Econometrics, 18(1):1–22. doi:10.1002/jae.659
-
[3]
Barigou, K., Patten, M., and Zhou, K. Q. (2025). Mortality modeling and forecasting with the actuaries climate index.arXiv preprint arXiv:2510.16266
arXiv 2025
-
[4]
Barnett, A., Tong, S., and Clements, A. (2010). What measure of temperature is the best predictor of mortality?Environmental Research, 110(6):604–611. doi:10.1016/j.envres.2010.05.006
-
[5]
Braga, A. L. F., Zanobetti, A., and Schwartz, J. (2002). The effect of weather on respiratory and cardiovascular deaths in 12 U.S. cities.Environmental Health Perspectives, 110(9):859–863. doi:10.1289/ehp.02110859
-
[6]
Breiman, L. (2001). Random forests.Machine Learning, 45(1):5–32. doi: 10.1023/a:1010933404324. Bégin, J.-F., Boudreault, M., and Landry, T. (2025). Modelling seasonal mortality: An age–period–cohort approach.Insurance: Mathematics and Economics, 125:103162. doi:10.1016/j.insmatheco.2025.103162. Bégin, J.-F., Boudreault, M., and Landry, T. (2026). Modellin...
-
[7]
Calabrese, R., Dombrowski, T., Mandel, A., Pace, R. K., and Zanin, L. (2024). Impacts of extreme weather events on mortgage risks and their evolution under climate change: A case study on Florida.European Journal of Operational Research, 314(1):377–392. doi:10.1016/j.ejor.2023.11.022
-
[8]
and Khaliq, A
Chen, Y. and Khaliq, A. Q. M. (2023). Mortality rates forecasting with data driven LSTM, Bi-LSTM and GRU: The United States case study.Actuarial Research Clearing House, 28 2023(1).https://www.soa.org/globalassets/assets/files/static-pages/research/arch/ 2023/arch-2023-1-mortality-rates-forecasting.pdf
2023
-
[9]
Chen, Y.-H., Mukherjee, B., and Berrocal, V. J. (2019). Distributed lag interaction models with two pollutants.Journal of the Royal Statistical Society Series C: Applied Statistics, 68(1):79–97. doi:10.1111/rssc.12297. Copernicus Climate Change Service (2025). E-OBS daily gridded meteorological data for Europe from 1950 to present derived from in-situ obs...
-
[10]
Enchev, V., Kleinow, T., and Cairns, A. J. G. (2017). Multi-population mortality mod- els: fitting, forecasting and comparisons.Scandinavian Actuarial Journal, 2017(4):319–342. doi:10.1080/03461238.2015.1133450
-
[11]
Armstrong, B. (2015). Mortality risk attributable to high and low ambient temperature: a multi- country observational study.The Lancet, 386(9991):369–375. doi:10.1016/s0140-6736(14)62114-0
-
[12]
Giglio, S., Kelly, B., and Stroebel, J. (2021). Climate finance.Annual Review of Financial Eco- nomics, 13(Volume 13, 2021):15–36. doi:10.1146/annurev-financial-102620-103311
-
[13]
Goes, J., Barigou, K., and Leucht, A. (2025). Bayesian mortality modelling with pandemics: a vanishing jump approach.Journal of the Royal Statistical Society Series C: Applied Statistics, 74(4):1150–1182
2025
-
[14]
Guibert, Q., Pincemin, G., and Planchet, F. (2025). Impact of climate change on mortality: An extrapolation of temperature effects based on time series data in France.International Journal of Forecasting. doi:10.1016/j.ijforecast.2025.07.004
-
[15]
Hainaut, D. (2018). A neural-network analyzer for mortality forecast.ASTIN Bulletin, 48(02):481–508. doi:10.1017/asb.2017.45
-
[16]
Hainaut, D. (2026). Explaining regional mortality differences with an economic-neural model: Ev- idence from European NUTS-2 regions.LIDAM Discussion Paper. Working paper.https: //drive.google.com/file/d/1hJku2vojXti0AYkkkLrsQ2xnqXXjlGar/view
2026
-
[17]
Jo, H., Kim, J., Huang, T.-C., and Ni, Y.-L. (2022). condLSTM-Q: A novel deep learning model for predicting COVID-19 mortality in fine geographical scale.Quantitative Biology, 10(2):125–138. doi:10.15302/J-QB-021-0276
-
[18]
Kleinow, T. (2015). A common age effect model for the mortality of multiple populations.Insurance: Mathematics and Economics, 63:147–152. doi:10.1016/j.insmatheco.2015.03.023
-
[19]
In: IEEE International Conference on Communications (ICC)
Li, H. and Tang, Q. (2022). Joint extremes in temperature and mortality: A bivariate POT approach.North American Actuarial Journal, 26(1):43–63. doi:10.1080/10920277.2020.1823236. 29
-
[20]
Li, N. and Lee, R. (2005). Coherent mortality forecasts for a group of populations: An extension of the Lee-Carter method.Demography, 42(3):575–594. doi:10.1353/dem.2005.0021
-
[21]
Li, R., Zhou, R., and Pitt, D. (2026a). Beyond annual data: Mortality forecast- ing with mixed frequency data.Insurance: Mathematics and Economics, 126:103172. doi:10.1016/j.insmatheco.2025.103172
-
[22]
Li, R., Zhou, R., and Pitt, D. (2026b). Dynamic mortality forecasting via mixed-frequency state- space models. Working paper. doi:10.48550/arXiv.2601.05702
-
[23]
Lindholm, M. and Palmborg, L. (2022). Efficient use of data for LSTM mortality forecasting. European Actuarial Journal, 12(2):749–778. doi:10.1007/s13385-022-00307-3
-
[24]
L., Hannun, A
Maas, A. L., Hannun, A. Y., and Ng, A. Y. (2013). Rectifier nonlinearities improve neural net- work acoustic models. InProceedings of the 30th International Conference on Machine Learning (ICML), volume 28 ofJMLR Workshop and Conference Proceedings, Atlanta, Georgia, USA. https://ai.stanford.edu/~amaas/papers/relu_hybrid_icml2013_final.pdf
2013
-
[25]
Marino, M., Levantesi, S., and Nigri, A. (2022). A neural approach to improve the Lee-Carter mortality density forecasts.North American Actuarial Journal, 27(1):148–165. doi:10.1080/10920277.2022.2050260
-
[26]
Miao, Z., Li, H., and Chen, Y. (2026). Gradient boosted multi-population mortality modelling with high-frequency data. Working paper. doi:10.48550/arXiv.2507.09983
work page internal anchor Pith review Pith/arXiv arXiv doi:10.48550/arxiv.2507.09983 2026
-
[27]
Min, J., Li, H., Nagler, T., and Li, S. (2025). Assessing climate-driven mortality risk: A stochastic approach with distributed lag non-linear models. Working paper. doi:10.48550/arXiv.2506.00561
work page internal anchor Pith review Pith/arXiv arXiv doi:10.48550/arxiv.2506.00561 2025
-
[28]
Perla, F., Richman, R., Scognamiglio, S., and Wüthrich, M. V. (2024). Accurate and explainable mortality forecasting with the LocalGLMnet.Scandinavian Actuarial Journal, 2024(7):739–761. doi:10.1080/03461238.2024.2307620
-
[29]
Perla, F., Richman, R., Scognamiglio, S., and Wüthrich, M. V. (2021). Time-series forecast- ing of mortality rates using deep learning.Scandinavian Actuarial Journal, 2021(7):572–598. doi:10.1080/03461238.2020.1867232
-
[30]
Richman, R. and Wüthrich, M. V. (2019). A neural network extension of the Lee- Carter model to multiple populations.Annals of Actuarial Science, 15(2):346–366. doi:10.1017/s1748499519000071
-
[31]
Robben, J., Antonio, K., and Kleinow, T. (2026a). The short-term association between environ- mental variables and mortality: evidence from europe.Journal of the Royal Statistical Society Series A: Statistics in Society, 189(2):1131–1153. doi:10.1093/jrsssa/qnaf052
-
[32]
Robben, J. and Barigou, K. (2025). A penalized distributed lag non-linear Lee-Carter framework for regional weekly mortality forecasting. Working paper. doi:10.48550/arXiv.2509.24087
work page internal anchor Pith review Pith/arXiv arXiv doi:10.48550/arxiv.2509.24087 2025
-
[33]
Robben, J., Barigou, K., and Kleinow, T. (2026b). Granular mortality modeling with temperature and epidemic shocks: A three-state regime-switching approach.Insurance: Mathematics and Economics, 128:103250. doi:10.1016/j.insmatheco.2026.103250
-
[34]
S., Langseth, H., and Ramampiaro, H
Salem, T. S., Langseth, H., and Ramampiaro, H. (2020). Prediction intervals: Split normal mixture from quality-driven deep ensembles. InConference on Uncertainty in Artificial Intelligence, pages 1179–1187. PMLR. 30 Schnürch, S. and Korn, R. (2022). Point and interval forecasts of death rates using neural networks. ASTIN Bulletin, 52(1):333–360. doi:10.10...
-
[35]
Shala, I. and Schumacher, B. (2024). The impact of natural disasters on banks’ impairment flow – evidence from Germany.Journal of Climate Finance, 6:100031. doi:10.1016/j.jclimf.2024.100031
-
[36]
Shen, Y., Yang, X., Liu, H., and Li, Z. (2024). Advancing mortality rate prediction in European population clusters: integrating deep learning and multiscale analysis.Scientific Reports, 14(1). doi:10.1038/s41598-024-56390-x
-
[37]
So, K. R., Cruz, S. C., Marcella, E. A., Briones, J., and Garces, L. P. D. (2025). Uncertainty in pricing and risk measurement of survivor contracts.Risks, 13(2). doi:10.3390/risks13020035
-
[38]
Srivastava, N., Hinton, G., Krizhevsky, A., Sutskever, I., and Salakhutdinov, R. (2014). Dropout: A simple way to prevent neural networks from overfitting.Journal of Machine Learning Research, 15(56):1929–1958.http://jmlr.org/papers/v15/srivastava14a.html. Van Berkum, F., Antonio, K., and Vellekoop, M. (2016). The impact of multiple struc- tural changes o...
-
[39]
Wang, C.-W., Zhang, J., and Zhu, W. (2021). Neighbouring prediction for mortality.ASTIN Bulletin, 51(3):689–718. doi:10.1017/asb.2021.13
-
[40]
Wang, J., Wen, L., Xiao, L., and Wang, C. (2023). Time-series forecasting of mortality rates using transformer.Scandinavian Actuarial Journal, 2024(2):109–123. doi:10.1080/03461238.2023.2218859
-
[41]
Wang, Y., Gan, D., Sun, M., Zhang, N., Lu, Z., and Kang, C. (2019). Probabilistic individual load forecasting using pinball loss guided LSTM.Applied Energy, 235:10–20. doi:10.1016/j.apenergy.2018.10.078
-
[42]
Wuthrich, M. V. and Merz, M. (2023).Statistical Foundations of Actuarial Learning and its Appli- cations. Springer International Publishing. doi:10.1007/978-3-031-12409-9
-
[43]
Zhang, N., Chen, H., and LIU, J. (2022). Mortality forecasting using LSTM-CNN model.SSRN Electronic Journal. Working paper. doi:10.2139/ssrn.4261735
-
[44]
Zheng, H., Wang, H., Zhu, R., and Xue, J.-H. (2025). Fine-grained mortality forecasting with deep learning.Annals of Actuarial Science, page 1–27. doi:10.1017/s1748499525100171
-
[45]
Zheng, H., Wang, H., Zhu, R., andXue, J.-H.(2026). Abriefreviewofdeeplearningmethodsinmor- tality forecasting.Annals of Actuarial Science, 20(1):150–165. doi:10.1017/S1748499525100110. 31
discussion (0)
Sign in with ORCID, Apple, or X to comment. Anyone can read and Pith papers without signing in.