REVIEW 3 major objections 5 minor 1 cited by
The physical and chemical structure of Sagittarius B2 -- V. Non-thermal emission in the envelope of Sgr B2
T0 review · 3 major / 5 minor · reviewed 2026-08-14 · deepseek-v4-flash
Pith's one-line read A bubble in Sagittarius B2 shines by shock-accelerated electrons
desk verdict A solid observational case for non-thermal radio emission in a dense H II region, with a plausible but not yet proven Fermi-acceleration origin. read the letter →
The pith
A machine-rendered reading of the paper's core claim, the machinery that carries it, and where it could break.
The reading
What carries the argument
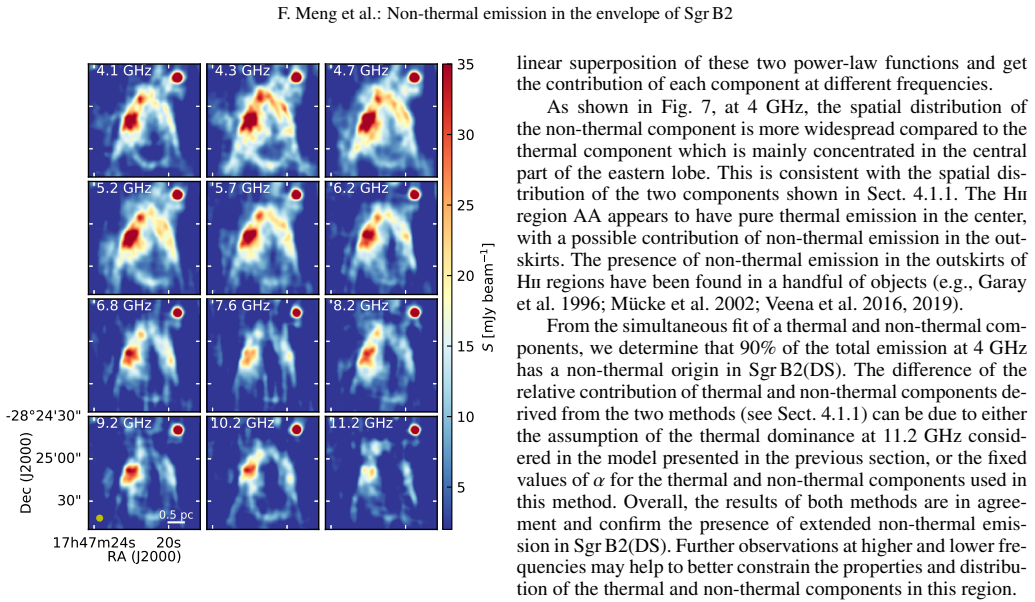
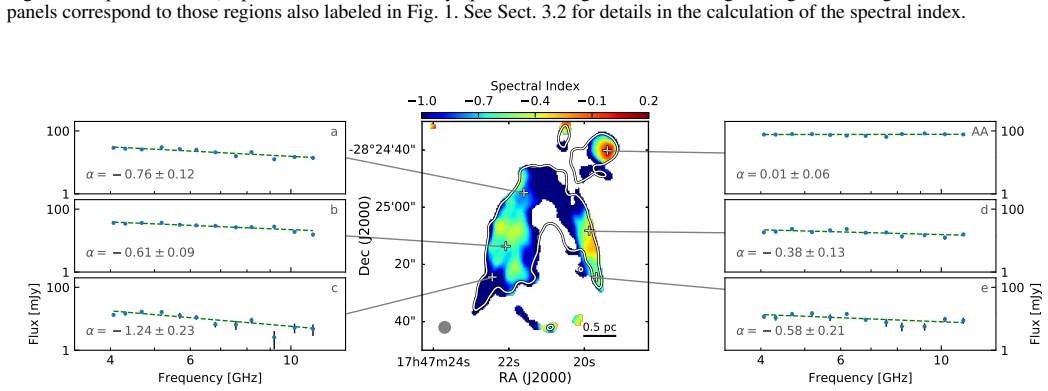
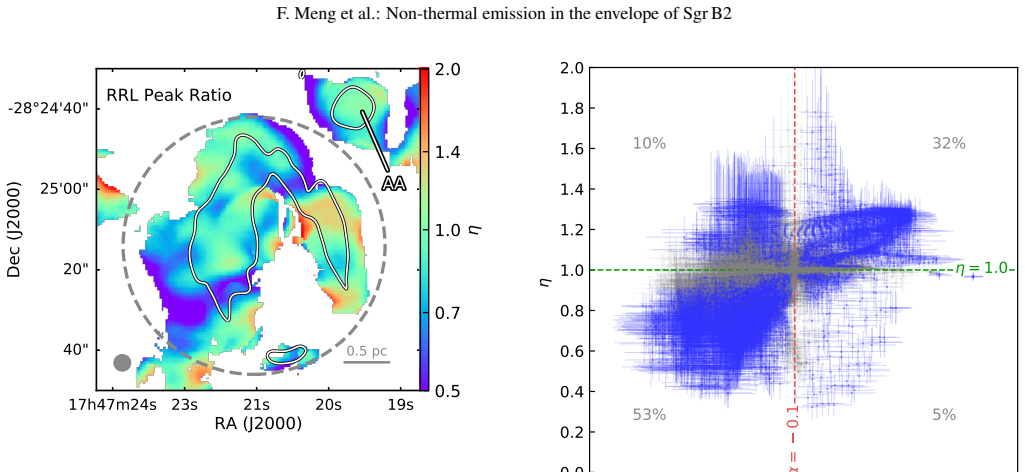
The argument is carried by the spectral index $\alpha$, measured pixel by pixel from 12 tomographic continuum images between 4 and 12 GHz, which separates thermal free-free emission ($\alpha \approx -0.1$) from non-thermal synchrotron emission (more negative), and by the companion diffusive-shock acceleration model (Padovani et al. 2019), which takes as inputs the flow velocity $U$, gas density $n$, and magnetic field $B$ in the shock reference frame and predicts the synchrotron flux produced by accelerated electrons. This model is adjusted by a $\chi^2$ fit to the observed 4-12 GHz flux maps, yielding maps of $U$, $n$, and $B$ and a predicted spectral-index map that matches the observed one. A secondary diagnostic is the RRL peak ratio $\eta = 0.85\,S_{10.5}/S_{8.9}$; values $\eta < 1$ mark stimulated, non-LTE recombination lines, which spatially coincide with the non-thermal emission.
What would settle it
Measure the expansion velocity of the DS H II region directly, through multi-epoch VLA proper motions of the bubble rim or resolved RRL velocity gradients, and test the ionization fraction with low-frequency free-free absorption. If the shock speed is below about 35 km/s over most of the region, or the gas is partly neutral, first-order Fermi acceleration cannot produce the observed GHz synchrotron flux and the non-thermal emission must come from elsewhere.
Extended reading notes
Core claim
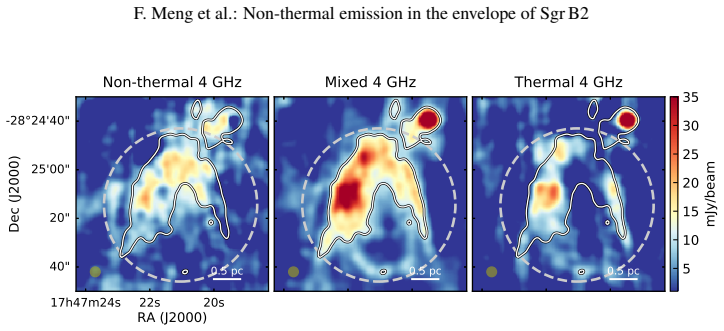
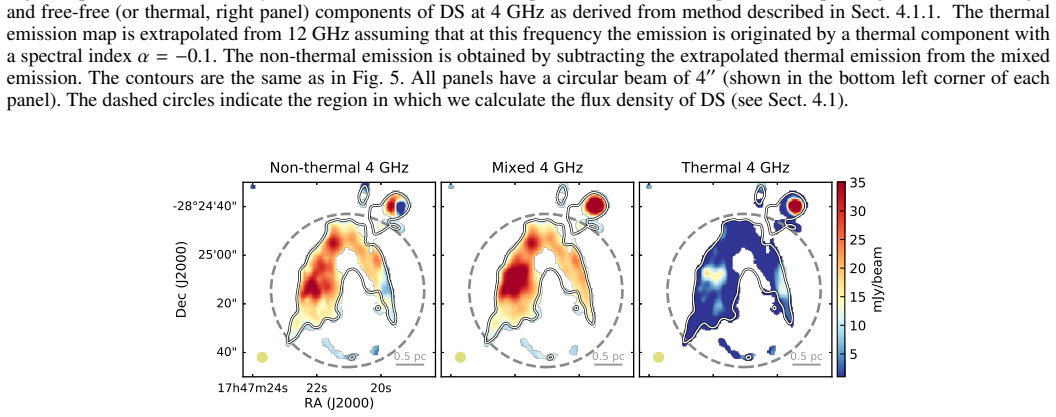
The central claim is that Sgr B2(DS) is an H II region with a genuine, spatially extended non-thermal radio component rather than a purely thermal source. The observed spectral energy distribution steepens with frequency in a way no optically thin free-free source can produce, with a spectral index between -1.2 and -0.4 across the bubble; after subtracting the thermal contribution, between about 60% and 90% of the flux at 4 GHz is non-thermal. The radio recombination lines are not in LTE but are stimulated, and the pixels with stimulated recombination lines almost exactly coincide with those having a negative spectral index. The authors further argue, using a companion model of shock acceleration in H II regions, that electrons accelerated by first-order Fermi acceleration at the shock between the expanding ionized bubble and the dense envelope can supply the observed synchrotron emission, with shock velocities of 35 to 50 km s$^{-1}$, densities of $1$ to $9\times10^4$ cm$^{-3}$, and magnetic fields of 0.3 to 4 mG, all consistent with independent constraints.
Load-bearing premise
The Fermi-acceleration explanation assumes the shocked gas is fully ionized along the whole line of sight at a single temperature (8000 K), and that the shock speed exceeds about 35 km/s across enough of DS; if either condition fails, the predicted synchrotron flux drops and the non-thermal emission would need another origin.
Editorial extensions
If this is right
- If the Fermi-acceleration interpretation is right, Sgr B2(DS) is a Galactic source of locally accelerated cosmic-ray electrons, produced at an H II region shock rather than penetrating from outside.
- Radio recombination lines in DS cannot be used as simple LTE thermometers; the stimulated, non-LTE component must be modeled to infer electron temperatures and ionized mass.
- Non-thermal emission may be common at the boundaries of H II regions in dense, high-mass star-forming clouds, rather than an exotic exception.
- The model directly sets physical conditions at the shock ($U\approx35$-$50$ km s$^{-1}$, $n\approx1$-$9\times10^4$ cm$^{-3}$, $B\approx0.3$-$4$ mG), linking the observed spectral shape to the dynamics of the expanding bubble.
- This mechanism makes H II region boundaries plausible acceleration sites for the relativistic electrons that produce synchrotron emission in other dense star-forming clouds.
Reading between the lines
- If the result holds, systematic searches for negative spectral indices around other compact H II regions could uncover many more local particle acceleration sites in the Galactic center, where dense gas blocks penetration of external cosmic rays.
- The same shock model could be tested in other bubble-like H II regions: wherever an expansion shock meets neutral gas, a negative spectral index should coincide with stimulated radio recombination lines.
- A multi-epoch VLA observation of DS could measure the bubble's expansion proper motion directly, converting the fitted shock velocity $U$ from a model parameter into a measured kinematic quantity.
- The inferred mG magnetic fields may be checkable through Faraday rotation measures of background or embedded sources at low frequencies.
Signed reviews
Editorial analysis
A structured set of objections, weighed in public.
Referee Report
Summary. The paper presents VLA CnB/D-configuration observations of the Sgr B2 complex at 4-12 GHz, focusing on the Sgr B2(DS) region. The authors detect a bubble-shaped radio continuum source with spectral indices between -0.4 and -1.2 over 4-12 GHz, which they interpret as a mix of thermal free-free emission from an H II region and more extended non-thermal (synchrotron) emission. They decompose the two components with two methods, find that radio recombination lines in part of DS are out of LTE and likely stimulated by the non-thermal radiation, and model the non-thermal emission with first-order Fermi acceleration at the shock between the expanding H II region and the surrounding dense gas. The companion model (Padovani et al. 2019) is fitted to the observed maps, yielding maps of shock velocity U, density n, and magnetic field B. The paper concludes that Fermi acceleration can reproduce the observed flux densities and spectral index and that the central H II region is ionized by an O7 star.
Significance. If the central claims hold, this paper provides one of the clearest examples of radio non-thermal emission associated with an H II region in a dense Galactic-center cloud, and it supports the emerging picture that some H II regions can accelerate particles locally. The quantitative decomposition of thermal vs non-thermal emission and the correlation between negative spectral indices and stimulated RRLs are valuable observational results. Strengths include the careful uv-matching of the 12 frequency maps, the use of GMRT 350 MHz data as an independent consistency check, and the transparent statement of the model's simplifying assumptions. The significance is tempered, however, by the large quantitative disagreement between the two decomposition methods and by the fact that the Fermi-acceleration interpretation is based on a fit to the same data used to define the spectral index, so the model agreement is partly a consistency check rather than an independent prediction.
major comments (3)
- [§5.2] The first-order Fermi acceleration origin is not independently tested. The χ2 procedure fits U, n, and B to the same 12-frequency flux maps (Fig. 3) from which the observed spectral index is derived, so the statement that the model 'reproduces the observed flux density and spectral index' is a consistency check of a fit, not a predictive validation. The model also assumes a fully ionized medium at Te = 8000 K and constant conditions along the line of sight, as acknowledged at the end of §5.2, and the fitted thermal free-free component is never compared with the RRL-derived free-free maps (RFE; §4.2, Eq. 1). I ask the authors to add an independent constraint—for example, use the RRL emission measure to fix n, or compare the predicted free-free component with RFE—and to show explicitly that U exceeds the ~35 km/s threshold over the regions where synchrotron emission is claimed. Without such a check, the physical-origin conclusion should be presented as suggestive rather than established.
- [§4.1] The two decomposition methods disagree quantitatively on the non-thermal fraction at 4 GHz: about 60% from the 11.2 GHz extrapolation (§4.1.1) versus 90% from the two-power-law SED fit (§4.1.2). The authors attribute the difference to the underlying assumptions, but a factor of four in the non-thermal/thermal ratio propagates directly into the derived component maps and into the conclusion that the thermal component is 'clumpy and more concentrated' while the non-thermal component is diffuse. Please provide a systematic uncertainty for the decomposition and state which spatial conclusions are robust to the assumed alpha_th and alpha_nt values.
- [§5.2] The velocity threshold for particle acceleration is stated inconsistently. The text says electrons can be efficiently accelerated if the flow velocity exceeds 35 km/s, but the fitted range is reported as 33 ≲ U ≲ 50 km/s, while the Summary states velocities between 35 and 50 km/s. The low end of the fitted range lies below the stated threshold, and the paper does not discuss what fraction of DS pixels have U < 35 km/s or whether the model predicts substantially reduced synchrotron emission there. Please report the threshold and the fitted values consistently, and quantify the spatial extent of sub-threshold regions.
minor comments (5)
- [§5.2] The claim that the model-derived α map is 'in agreement' with the observed α map is not quantified. A residual map or a per-pixel comparison of αmod and αobs would strengthen the statement.
- [§4.2] Equation (1) assumes LTE and Te = 8000 K. The RFE maps exceed the observed continuum by a factor of about two at low frequencies; the interpretation in terms of stimulated emission would be more convincing if the authors also discussed whether a different Te or a non-LTE correction to Eq. (1) could remove part of the excess.
- [§3.2] The robust loss function r(z) = sqrt(1 + z/0.01) − 1 is introduced without explanation. Please state why this estimator was chosen and how the reported α uncertainties from the covariance matrix are affected by the robust weighting.
- [Appendix B] The GMRT comparison relies on unpublished data and the SED curves in Fig. B.1 are described as qualitative. Once the GMRT paper is available, please provide quantitative error bars for the 350 MHz flux measurements and for the derived combined spectral index.
- [Throughout] The notation for ionized hydrogen is inconsistent ('H ii region', 'HII region', 'Hii region'). Please standardize to a single form.
Circularity Check
The Fermi-acceleration origin of the non-thermal emission is supported by a chi-square fit of U, n, and B to the same 12-frequency maps that the model is said to reproduce, and the model itself is imported from a companion paper by overlapping authors; the non-thermal detection itself is robust and independent.
-
fitted input called prediction
[Section 5.2, 'Non-thermal emission origin', model fit paragraph (Fig. 12).]
"We performed a χ2 test to find the values of the velocity (U), density (n), and magnetic field strength (B) that best reproduce the observations. ... The model also gives an α map of DS, which is in agreement with the observed α map (Fig. 5)."
The model is said to 'reproduce' the observed 12-frequency flux maps and the spectral-index map, but U, n, and B were obtained by a χ2 fit to exactly those maps. The flux-density normalization and the frequency slope of the synchrotron emission are controlled by these fitted parameters, so the reported agreement in flux and in α is a property of the fit, not an independent prediction. The paper labels the output 'αmod' versus 'αobs' from the same dataset, and no separate validation set or independent shock-velocity measurement is used to test the Fermi-acceleration scenario.
-
self citation load bearing
[Section 5.2, first paragraph (companion paper Padovani et al. 2019).]
"In a companion paper (Padovani et al. 2019), we present an extension to this theory applied to H ii regions. We demonstrate that electrons can be efficiently accelerated under the hypothesis that the flow velocity in the reference frame of an expanding H ii region hitting denser material is sufficiently high (> 35 km s−1) to switch on particle acceleration."
The central physical conclusion—that the non-thermal emission originates from first-order Fermi acceleration at the H ii region shock—rests on a companion paper with overlapping authorship (Padovani, Sánchez-Monge, Meng, and Schilke appear in both works). The present paper does not independently validate the companion model; it adopts its assumptions (fully ionized medium, Te = 8000 K, constant line-of-sight conditions) by citation, and then fits the model's U, n, and B to the very data the model is said to explain. This self-citation is load-bearing for the origin claim rather than a merely incidental reference.
full rationale
The non-thermal detection itself is not circular: the negative spectral index (-1.2 to -0.4) is derived directly from the VLA 4-12 GHz maps, and the GMRT 350 MHz comparison independently confirms the presence of non-thermal emission in DS. The RRL non-LTE analysis also provides an independent, model-free correlation between negative spectral index and stimulated recombination lines. The SED decomposition in Section 4.1 uses assumed fixed indices (alpha_th = -0.1 and alpha_nt = -0.7), which is an explicit assumption that shapes the derived spatial maps of the thermal and non-thermal components, but the paper labels this as a decomposition and notes the dependence on the assumed indices, so it is not a hidden prediction. The circularity is confined to the origin claim. In Section 5.2, U, n, and B are determined by a chi-square fit to the same 12-frequency flux maps that are then reported as 'reproduced' by the model, and the model-generated alpha map is compared with the observed alpha map from those same data; this agreement is therefore a property of the fit, not an independent test of first-order Fermi acceleration. The applicability of the acceleration model to H ii regions is taken from a companion paper by overlapping authors, making the physical-origin conclusion depend on a load-bearing self-citation whose free parameters are then fitted to the data. Because the non-thermal emission is robustly established while the specific Fermi-acceleration origin is only partially validated by a fitted model, the paper is partially but not fully circular.
Assumptions & free parameters
free parameters (6)
- shock velocity U =
33-50 km/s
- volume density n =
1e4-9e4 cm^-3
- magnetic field B =
0.3-4 mG
- thermal spectral index alpha_th =
-0.1
- non-thermal spectral index alpha_nt =
-0.7
- ionization fraction =
1.0 (fully ionized)
assumptions (6)
- domain assumption The radio SED is a power law S_nu proportional to nu^alpha for each component over 4-12 GHz.
- ad hoc to paper The 11.2 GHz continuum in Sgr B2(DS) is purely thermal free-free emission.
- domain assumption The Fermi acceleration model of Padovani et al. (2019) correctly describes electron acceleration in H II region shocks.
- domain assumption The gas in Sgr B2(DS) is completely ionized with Te = 8000 K along the line of sight.
- domain assumption The uv filtering removes essentially all large-scale background emission, so the zero background assumption holds.
- standard math The LTE relation for radio recombination lines, Eq. (1), is valid when LTE holds.
Cite this review
Pith. "Pith review of The physical and chemical structure of Sagittarius B2 -- V. Non-thermal emission in the envelope of Sgr B2." pith.science (2026). https://pith.science/paper/KNM2EMVB
@misc{pith2026190807237,
  author       = {Pith},
  title        = {Pith review of: The physical and chemical structure of Sagittarius B2 -- V. Non-thermal emission in the envelope of Sgr B2},
  year         = {2026},
  howpublished = {\url{https://pith.science/paper/KNM2EMVB}},
  note         = {Machine review of arXiv:1908.07237}
}
read the original abstract
The giant molecular cloud Sagittarius B2 (hereafter SgrB2) is the most massive region with ongoing high-mass star formation in the Galaxy. In the southern region of the 40-pc large envelope of SgrB2, we encounter the SgrB2(DS) region which hosts more than 60 high-mass protostellar cores distributed in an arc shape around an extended HII region. We use the Very Large Array in its CnB and D configurations, and in the frequency bands C (4--8 GHz) and X (8--12 GHz) to observe the whole SgrB2 complex. Continuum and radio recombination line maps are obtained. We detect radio continuum emission in SgrB2(DS) in a bubble-shaped structure. From 4 to 12 GHz, we derive a spectral index between -1.2 and -0.4, indicating the presence of non-thermal emission. We decompose the contribution from thermal and non-thermal emission, and find that the thermal component is clumpy and more concentrated, while the non-thermal component is more extended and diffuse. The radio recombination lines in the region are found to be not in local thermodynamic equilibrium (LTE) but stimulated by the non-thermal emission. The thermal free-free emission is likely tracing an HII region ionized by an O7 star, while the non-thermal emission can be generated by relativistic electrons created through first-order Fermi acceleration. We have developed a simple model of the SgrB2(DS) region and found that first-order Fermi acceleration can reproduce the observed flux density and spectral index.
Figures


Figures from the paper (8 more)




Forward citations
Cited by 1 Pith paper
-
Non-thermal emission from cosmic rays accelerated in HII regions
Shock-accelerated thermal electrons inside HII regions can explain the observed non-thermal radio emission and spectral indices in Sgr B2(DS).
Reference graph
Works this paper leans on
-
[1]
Anglada , G., Villuendas , E., Estalella , R., et al. 1998, , 116, 2953
work page 1998
-
[2]
M., Sip o cz , B
Astropy Collaboration , Price-Whelan , A. M., Sip o cz , B. M., et al. 2018, , 156, 123
2018
-
[3]
P., Tollerud , E
Astropy Collaboration , Robitaille , T. P., Tollerud , E. J., et al. 2013, , 558, A33
2013
-
[4]
1993, , 100, 647
Bressan , A., Fagotto , F., Bertelli , G., & Chiosi , C. 1993, , 100, 647
1993
-
[5]
J., Cotton , W
Condon , J. J., Cotton , W. D., Greisen , E. W., et al. 1998, , 115, 1693
1998
-
[6]
Crutcher , R. M., Roberts , D. A., Mehringer , D. M., & Troland , T. H. 1996, , 462, L79
work page 1996
- [7]
-
[8]
G., Peters , T., Mac Low , M.-M., et al
De Pree , C. G., Peters , T., Mac Low , M.-M., et al. 2014, , 781, L36
work page 2014
Show all 60 references
-
[9]
Draine , B. T. 2011, Physics of the Interstellar and Intergalactic Medium
2011
-
[10]
F., Curiel , S., & Torrelles , J
Garay , G., Ramirez , S., Rodriguez , L. F., Curiel , S., & Torrelles , J. M. 1996, , 459, 193
1996
-
[11]
A., Claussen , M
Gaume , R. A., Claussen , M. J., de Pree , C. G., Goss , W. M., & Mehringer , D. M. 1995, , 449, 663
1995
-
[12]
2018, , 853, 171
Ginsburg , A., Bally , J., Barnes , A., et al. 2018, , 853, 171
2018
-
[13]
2016, , 586, A50
Ginsburg , A., Henkel , C., Ao , Y., et al. 2016, , 586, A50
2016
-
[14]
F., Lis , D
Goldsmith , P. F., Lis , D. C., Hills , R., & Lasenby , J. 1990, , 350, 186
1990
-
[15]
2018, , 615, L15
Gravity Collaboration , Abuter , R., Amorim , A., et al. 2018, , 615, L15
2018
-
[16]
M., Jewell , P
Hollis , J. M., Jewell , P. R., Remijan , A. J., & Lovas , F. J. 2007, , 660, L125
2007
-
[17]
M., Pedelty , J
Hollis , J. M., Pedelty , J. A., Boboltz , D. A., et al. 2003, , 596, L235
2003
-
[18]
I., Crocker , R
Jones , D. I., Crocker , R. M., Ott , J., Protheroe , R. J., & Ekers , R. D. 2011, , 141, 82
2011
-
[19]
M., Smith , N., Reiter , M., & Bally , J
Kiminki , M. M., Smith , N., Reiter , M., & Bally , J. 2017, , 468, 2469
2017
-
[20]
Kruijssen , J. M. D., Dale , J. E., & Longmore , S. N. 2015, , 447, 1059
2015
-
[21]
2002, in Astronomical Society of the Pacific Conference Series, Vol
Kurtz , S. 2002, in Astronomical Society of the Pacific Conference Series, Vol. 267, Hot Star Workshop III: The Earliest Phases of Massive Star Birth, ed. P. Crowther , 81
2002
-
[22]
2005, in IAU Symposium, Vol
Kurtz , S. 2005, in IAU Symposium, Vol. 227, Massive Star Birth: A Crossroads of Astrophysics, ed. R. Cesaroni , M. Felli , E. Churchwell , & M. Walmsley , 111--119
2005
-
[23]
N., Brogan , C
LaRosa , T. N., Brogan , C. L., Shore , S. N., et al. 2005, , 626, L23
2005
-
[24]
N., Kassim , N
LaRosa , T. N., Kassim , N. E., Lazio , T. J. W., & Hyman , S. D. 2000, , 119, 207
2000
-
[25]
J., Yusef-Zadeh , F., & Cotton , W
Law , C. J., Yusef-Zadeh , F., & Cotton , W. D. 2008, , 177, 515
2008
-
[26]
& Draine , B
Li , A. & Draine , B. T. 2001, , 554, 778
2001
-
[27]
A., Rodr \' guez-Fern \'a ndez , N., de Vicente , P., & Wilson , T
Mart \' n-Pintado , J., Gaume , R. A., Rodr \' guez-Fern \'a ndez , N., de Vicente , P., & Wilson , T. L. 1999, , 519, 667
1999
-
[28]
P., Waters , B., Schiebel , D., Young , W., & Golap , K
McMullin , J. P., Waters , B., Schiebel , D., Young , W., & Golap , K. 2007, in Astronomical Society of the Pacific Conference Series, Vol. 376, Astronomical Data Analysis Software and Systems XVI, ed. R. A. Shaw , F. Hill , & D. J. Bell , 127
2007
-
[29]
M., Palmer , P., Goss , W
Mehringer , D. M., Palmer , P., Goss , W. M., & Yusef-Zadeh , F. 1993, , 412, 684
1993
-
[30]
S., Moffat , A
M \"u cke , A., Koribalski , B. S., Moffat , A. F. J., Corcoran , M. F., & Stevens , I. R. 2002, , 571, 366
2002
-
[31]
Padovani , M., Galli , D., & Glassgold , A. E. 2009, , 501, 619
2009
-
[32]
2013, , 560, A114
Padovani , M., Hennebelle , P., & Galli , D. 2013, , 560, A114
2013
-
[33]
2015, , 582, L13
Padovani , M., Hennebelle , P., Marcowith , A., & Ferri \`e re , K. 2015, , 582, L13
2015
-
[34]
2016, , 590, A8
Padovani , M., Marcowith , A., Hennebelle , P., & Ferri \`e re , K. 2016, , 590, A8
2016
-
[35]
2019, arXiv e-prints [ [arXiv] 1908.07246 ]
Padovani , M., Marcowith , A., S \'a nchez-Monge , \'A ., Meng , F., & Schilke , P. 2019, arXiv e-prints [ [arXiv] 1908.07246 ]
2019 arXiv
-
[36]
1973, , 78, 929
Panagia , N. 1973, , 78, 929
1973
-
[37]
2016, , 588, A36
Pereira , V., L \'o pez-Santiago , J., Miceli , M., Bonito , R., & de Castro , E. 2016, , 588, A36
2016
-
[38]
Perley , R. A. & Butler , B. J. 2013, , 204, 19
2013
-
[39]
1998, , 505, 473
Platania , P., Bensadoun , M., Bersanelli , M., et al. 1998, , 505, 473
1998
-
[40]
2018, , 614, A123
Pols , S., Schw \"o rer , A., Schilke , P., et al. 2018, , 614, A123
2018
-
[41]
R., Terrier , R., et al
Ponti , G., Morris , M. R., Terrier , R., et al. 2015, , 453, 172
2015
-
[42]
J., Ott , J., Ekers , R
Protheroe , R. J., Ott , J., Ekers , R. D., Jones , D. I., & Crocker , R. M. 2008, , 390, 683
2008
-
[43]
V., Arendt , R
Ram \' rez , S. V., Arendt , R. G., Sellgren , K., et al. 2008, , 175, 147
2008
-
[44]
J., Menten , K
Reid , M. J., Menten , K. M., Brunthaler , A., et al. 2014, , 783, 130
2014
-
[45]
2013, , 766, 114
S \'a nchez-Monge , \'A ., Kurtz , S., Palau , A., et al. 2013, , 766, 114
2013
-
[46]
2017, , 604, A6
S \'a nchez-Monge , \'A ., Schilke , P., Schmiedeke , A., et al. 2017, , 604, A6
2017
-
[47]
2016, , 588, A143
Schmiedeke , A., Schilke , P., M \"o ller , T., et al. 2016, , 588, A143
2016
-
[48]
2019, , 628, A6
Schw \"o rer , A., S \'a nchez-Monge , \'A ., Schilke , P., et al. 2019, , 628, A6
2019
-
[49]
Shaver , P. A. 1978, , 68, 97
1978
-
[50]
G., Hoare , M
Steggles , H. G., Hoare , M. G., & Pittard , J. M. 2017, , 466, 4573
2017
-
[51]
S., Vig , S., Sebastian , B., et al
Veena , V. S., Vig , S., Sebastian , B., et al. 2019, , 482, 4630
2019
-
[52]
S., Vig , S., Tej , A., et al
Veena , V. S., Vig , S., Tej , A., et al. 2016, , 456, 2425
2016
-
[53]
2016, , 819, L35
Yusef-Zadeh , F., Cotton , W., Wardle , M., & Intema , H. 2016, , 819, L35
2016
-
[54]
W., Arendt , R
Yusef-Zadeh , F., Hewitt , J. W., Arendt , R. G., et al. 2009, , 702, 178
2009
-
[55]
Yusef-Zadeh , F., Muno , M., Wardle , M., & Lis , D. C. 2007 a , , 656, 847
2007
-
[56]
2013, Journal of Physical Chemistry A, 117, 9404
Yusef-Zadeh , F., Wardle , M., Lis , D., et al. 2013, Journal of Physical Chemistry A, 117, 9404
2013
-
[57]
2007 b , , 665, L123
Yusef-Zadeh , F., Wardle , M., & Roy , S. 2007 b , , 665, L123
2007
-
[58]
Zuckerman , B., Palmer , P., Penfield , H., & Lilley , A. E. 1967, , 149, L61
1967
-
[59]
, " * write output.state after.block = add.period write newline
ENTRY address archiveprefix author booktitle chapter edition editor howpublished institution eprint journal key month note number organization pages publisher school series title type volume year label extra.label sort.label short.list INTEGERS output.state before.all mid.sent...
-
[60]
write newline
" write newline "" before.all 'output.state := FUNCTION n.dashify 't := "" t empty not t #1 #1 substring "-" = t #1 #2 substring "--" = not "--" * t #2 global.max substring 't := t #1 #1 substring "-" = "-" * t #2 global.max substring 't := while if t #1 #1 substring * t #2 gl...
Reviewed August 14, 2026 · model on record in the stance chip above.
Discussion (0). Continue with ORCID to comment.