REVIEW 4 major objections 5 minor 49 references
Smooth tensor decomposition with application to ambulatory blood pressure monitoring data
T0 review · 4 major / 5 minor · reviewed 2026-08-06 · deepseek-v4-flash
Pith's one-line read Smooth tensor model finds sleep-apnea blood-pressure link
desk verdict Solid optimization core and a genuinely useful ABPM application, but the simulation is self-referential, the final rank choice is post hoc, and the downstream regression ignores score uncertainty. read the letter →
The pith
A machine-rendered reading of the paper's core claim, the machinery that carries it, and where it could break.
The reading
What carries the argument
The load-bearing device is the second-difference penalty $\lambda\|D L G_i R^\top\|_F^2$ applied to the reconstructed matrix $L G_i R^\top$ rather than to the component $L$; $D$ is the 24-point second-difference matrix. This placement keeps fitted curves smooth while preserving the orthogonality constraint, because penalizing $L$ directly drives the temporal components toward the sinusoidal eigenvectors of $D^\top D$. The optimization reduces to alternating top-eigenvector updates through the reparametrization $U = A^{1/2}L$ with $A = I + \lambda D^\top D$, and missing data are handled inside the loop by imputing the current low-rank fit into unobserved entries.
What would settle it
Simulate data from the same smooth low-rank model with log(ODI4) having zero true effect on the level scores, run the full pipeline (cross-validated ranks and $\lambda$, imputation, regression), and check the empirical type I error rate at the nominal 5% level; if it is materially above 5%, the reported clinical p-values are anti-conservative. In the actual HYPNOS data, a patient-level bootstrap that re-estimates the scores within each resample would show whether the association survives the added uncertainty.
Extended reading notes
Core claim
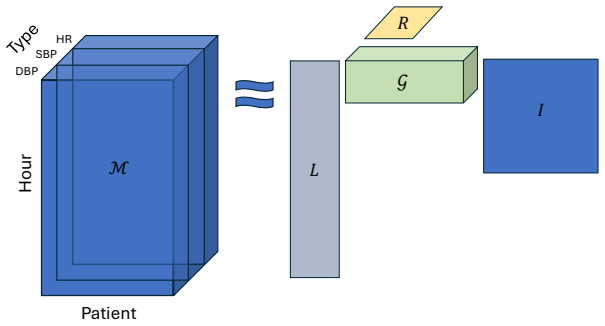
SmoothHOOI solves a penalized Tucker decomposition in which each patient's slice is approximated by $L G_i R^\top$, with the time factor $L$ and measurement factor $R$ orthonormal, and the objective adds $\lambda\|D L G_i R^\top\|_F^2$ to the squared reconstruction error on observed entries, where $D$ is the second-difference matrix that enforces smoothness across hours. The central discovery is that smoothing the fitted signal rather than the factor $L$ avoids the instability that arises when orthogonality pushes the columns of $L$ toward the discrete sine and cosine eigenvectors of $D^\top D$. Closed-form updates for the core slices $G_i$ and for $R$ and $U = A^{1/2}L$ with $A = I + \lambda D^\top D$ convert the problem into alternating eigen-decompositions, missing entries are filled by iterative imputation inside the loop, and SVD rotations of the core tensor restore identifiability. The recovered temporal components separate overall blood pressure and heart rate level, nocturnal dipping, and individual sleep-time shifts, and regressing the leading core scores on clinical covariates reveals the sleep-apnea association that summary measures miss.
Load-bearing premise
The load-bearing premise is that the subject-level core scores produced by the decomposition can be treated as measured outcomes in a standard regression, ignoring the uncertainty from tensor fitting, rank selection, and missing-data imputation.
Editorial extensions
If this is right
- Given a tensor of temporally structured matched measurements, SmoothHOOI recovers identifiable smooth temporal components and subject-level scores without requiring a common daytime or nighttime division across patients.
- The algorithm, including its missing-data imputation and cross-validation for ranks and smoothing parameter, transfers to any higher-order tensor with one temporal mode, so wearable-device streams beyond blood pressure are a direct extension.
- Using the separated level, dipping, and sleep-timing scores as regression outcomes lets a study test covariate associations with each physiological process individually, which dilutes less than average-based summaries.
- The HYPNOS result, if correct, implies that tensor-based scores can reveal a clinically expected effect of obstructive sleep apnea severity on blood pressure and heart rate that single-measurement summary statistics fail to detect.
Reading between the lines
- Our inference: the clinical p-values would be stronger evidence if they were recomputed with a patient-level bootstrap that re-runs the full decomposition, rank selection, and imputation each time; the paper's regression treats the estimated scores as known.
- Our inference: the orthogonality-versus-smoothness conflict likely extends beyond tensors, so smoothing the reconstructed fit rather than the factors is a transferable design choice for other orthogonally constrained factor models, such as sparse matrix factorization.
- Our inference: a natural extension is to allow measurement-specific smoothing parameters or a cyclic boundary condition on the 24-hour clock, since the global $\lambda$ and the current second-difference matrix are simplifying choices rather than necessary ones.
Editorial analysis
A structured set of objections, weighed in public.
Referee Report
Summary. The manuscript proposes SmoothHOOI, a Tucker/GLRAM-type decomposition for three-way tensors that penalizes second-order temporal differences of the reconstructed fit, accommodates missing values through an imputation-based iterative scheme, and selects ranks and the smoothing parameter by cross-validation. The authors derive closed-form updates for the complete-data problem, provide simulations comparing reconstruction and temporal-component recovery with FPCA, and apply the method to HYPNOS ABPM data. In the application they interpret the estimated temporal components as overall level, nocturnal dipping, and sleep timing, with an actigraphy-based validation for the third component, and they regress the estimated core scores on clinical covariates, reporting an association between log(ODI4) and an overall blood-pressure/heart-rate score that is not found with summary-statistic models.
Significance. If the claims hold, the paper would make a useful methodological contribution: penalizing the reconstructed fit rather than the component matrices is a principled response to the orthogonality-smoothness conflict, and the complete-data optimization steps are derived cleanly with closed-form updates. The paper also provides an automatic tuning procedure, an R package, and an independent actigraphy check on one temporal component, which are concrete strengths. However, the simulation truth is generated from the method's own output on the same real data, and the downstream regression treats the estimated tensor scores as noise-free outcomes while ranks are chosen after inspecting the cross-validation results. These issues bear directly on the two headline claims, reliable reconstruction in simulations and detection of a clinically meaningful association in the application, so the current evidence is not yet fully convincing.
major comments (4)
- [3, Simulations] The simulation truth is generated from SmoothHOOI itself: the fixed L and R used to construct Msmooth are obtained by applying SmoothHOOI to the real HYPNOS data, and the subject-specific core matrices are sampled from the empirical distribution of the fitted core. This makes the simulation a self-consistency check rather than a test against a plausible alternative data-generating process, and it biases the comparison with FPCA in favor of SmoothHOOI, since the true model is exactly the SmoothHOOI model while FPCA is not designed for matched multivariate structure. The conclusion that SmoothHOOI 'reliably reconstructs smooth temporal trends from noisy, incomplete data' would be substantially strengthened by an independent simulation design, for example generating smooth trajectories from splines or a mixed-effects model and then comparing both methods, or by a real-data validation benchmark.
- [4.3, Eq. (8) and Table 1] The outcomes g11 and g12 in the downstream linear regressions are estimated quantities whose uncertainty stems from missing-data imputation (15.9% missingness), the tensor decomposition itself, and the selection of ranks and lambda. The reported standard errors and p-values are ordinary least-squares quantities computed as if the scores were observed without error. No errors-in-variables correction, bootstrap, or simulation of the score distribution is provided. Since the manuscript's headline application claim is the detection of an ODI4 association that summary-based approaches miss, this inference gap is load-bearing; the confidence intervals in Table 1 may be anti-conservative. I request a sensitivity analysis or a simulation of the regression step, such as resampling imputations and refitting the decomposition, or a permutation test on the raw tensor that does not rely on the estimated scores being exact.
- [4.3, Rank selection after cross-validation] The final model configuration is not the configuration selected by the proposed cross-validation: five-fold CV yields (r1, r2, lambda) = (6, 3, 12), and the authors then adopt (3, 2, 4) after inspecting explained variability and noting that CV may overestimate ranks in the presence of missingness. This post hoc rank reduction introduces an additional selection step whose uncertainty is not incorporated in any downstream p-value or confidence interval. At minimum, the manuscript should report the regression results under the CV-selected ranks as a sensitivity check, or pre-specify a rank-selection rule before component variability is examined.
- [2.3, Missing-data algorithm] The convergence argument based on a non-increasing objective is established for the complete-data case only; the outer imputation loop, in which missing entries are replaced by the current fit LGiR^T, is heuristic, and no fixed-point property or convergence guarantee is given for the overall missing-data procedure. Proposition 1 also assumes a complete index set. The simulations assess reconstruction performance but do not isolate the effect of the imputation step. The manuscript should either provide a convergence statement for the missing-data algorithm or explicitly describe it as heuristic and examine its sensitivity in the simulations.
minor comments (5)
- [1, Introduction] In the paragraph discussing existing smoothing approaches, 'regularizaiton' should be 'regularization'.
- [2.2, Eq. (4)] The displayed difference matrix D has nonzero entries in the corners, indicating circular boundary conditions; this should be stated explicitly, since the usual second-difference matrix for 24 hourly points without wrap-around would have different boundary rows.
- [2.5, Identifiability] The SVD-based rotation fixes the representation only when the relevant singular values are distinct; the manuscript should state this condition and explain how near-ties or sign ambiguities are handled in practice.
- [4.3, Figure 4] The vertical axis label in Figure 4 reads 'G score'; it should be 'g31 score' to match the notation used in the text.
- [Appendix D.5] The standard error formula for the effect size uses sqrt(var(beta1) + var(beta2)), which assumes independence between the coefficient estimates from the two score regressions; if this independence is intended, it should be stated, and if not, the covariance term should be included.
Circularity Check
The simulation benchmark is self-referential: its ground-truth L and R are SmoothHOOI's own fits to the real data, so favorable recovery is partly assured by construction; the core optimization and actigraphy validation remain independent.
-
self definitional
[Section 3 Simulations, first paragraph (data-generating model for Msmooth)]
"Each signal slice Mi ∈ R24×3 in Msmooth is generated as Mi = LGiR⊤, with fixed matrices L ∈ R24×r1 and R ∈ R3×r2 obtained from SmoothHOOI applied to real data (Section 4) with r1 = 3, r2 = 2 and λ = 4. The subject-specific core matrices Gi for i = 1,...,n are generated by sampling (g11,g12,g21,g22,g31,g32) i.i.d from N(μ̂,Σ̂), where μ̂ and Σ̂ are the empirical mean and covariance estimated from the estimated core tensor Ĝ."
The simulation's 'true' temporal factors L and R are exactly the estimates returned by SmoothHOOI on the real HYPNOS tensor, and the 'true' core-score distribution is the empirical distribution of SmoothHOOI's estimated core. Thus the data-generating process is, by construction, the same model class (5) that SmoothHOOI is designed to fit. The simulation therefore measures how well the algorithm recovers its own fitted basis from noisy and subsampled copies of that basis, rather than testing whether the low-rank smoothness assumption actually matches an independent physiological process.
full rationale
The derivation chain for the method itself is otherwise self-contained: Propositions 1–3 are proved in Appendix B, the identifiability rotation relies on the standard external MLSVD framework of De Lathauwer et al. (2000a), and the third temporal component is checked against actigraphy-estimated sleep periods (Figure 4), an independent variable not used in the decomposition. I found no load-bearing self-citation: prior work on smoothing Tucker decompositions (Timmerman and Kiers 2002) is external and used only for contrast. The downstream regression analysis (Section 4.3, Table 1) treats the estimated core scores as noise-free outcomes and ignores uncertainty from missing-data imputation, rank selection, and score estimation; this is a genuine errors-in-variables and multiple-testing concern, but it is not a by-construction circularity because the reported ODI4 coefficient is not mathematically forced by the scores' definition. The moderate score reflects the self-referential simulation benchmark, while acknowledging that the optimization machinery, the comparison with FPCA, and the actigraphy-based validation give the paper substantial independent content.
Assumptions & free parameters
free parameters (3)
- lambda (smoothing parameter) =
4 (final application; 12 from CV; grid [1,50] in simulations)
- r1 (temporal rank) =
3 (CV gave 6)
- r2 (measurement rank) =
2 (CV gave 3)
assumptions (5)
- domain assumption Temporal smoothness: the true reconstructed signal is smooth over the 24-hour grid, encoded via second-order differences in D.
- domain assumption Low-rank Tucker structure: the ABPM tensor is well approximated by a Tucker decomposition with small r1 and r2, with subject mode uncompressed.
- domain assumption Missing data are ignorable: missingness does not depend on unobserved values.
- standard math Distinct singular values for identifiability: the SVD-based rotation in Section 2.5 yields identifiable components only if singular values are distinct.
- ad hoc to paper Manual rank reduction is valid: the final ranks r1=3, r2=2 are chosen by explained variability, not by an independent validation.
Cite this review
Pith. "Pith review of Smooth tensor decomposition with application to ambulatory blood pressure monitoring data." pith.science (2026). https://pith.science/paper/KQZPJR4E
@misc{pith2026250711723,
  author       = {Pith},
  title        = {Pith review of: Smooth tensor decomposition with application to ambulatory blood pressure monitoring data},
  year         = {2026},
  howpublished = {\url{https://pith.science/paper/KQZPJR4E}},
  note         = {Machine review of arXiv:2507.11723}
}
read the original abstract
Ambulatory blood pressure monitoring (ABPM) enables continuous measurement of blood pressure and heart rate over 24 hours and is increasingly used in clinical studies. However, ABPM data are often reduced to summary statistics, such as means or medians, which obscure temporal features like nocturnal dipping and individual chronotypes. Functional data analysis methods better capture these temporal dynamics but typically treat each ABPM measurement separately, limiting their ability to leverage correlations among matched measurements. In this work, we observe that aligning ABPM data along measurement type, time, and patient ID lends itself to a tensor representation--a multidimensional array. Although tensor learning has shown great potential in other fields, it has not been applied to ABPM data. Existing tensor learning approaches often lack temporal smoothing constraints, assume no missing data, and can be computationally demanding. To address these limitations, we propose a novel smooth tensor decomposition method that incorporates a temporal smoothing penalty and accommodates missing data. We also develop an automatic procedure for selecting the optimal smoothing parameter and tensor ranks. Simulation studies demonstrate that our method reliably reconstructs smooth temporal trends from noisy, incomplete data. Application to ABPM data from patients with concurrent obstructive sleep apnea and type 2 diabetes uncovers clinically relevant associations between patient characteristics and ABPM measurements, which are missed by summary-based approaches.
Figures


Figures from the paper (2 more)


Reference graph
Works this paper leans on
-
[1]
Ash, J. and R. P. Adams (2020). On Warm - Starting Neural Network Training . Advances in neural information processing systems\/ 33 , 3884--3894
work page 2020
-
[2]
Ayala, D. E., R. C. Hermida, A. Mojón, J. R. Fernández, and M. Iglesias (1997, September). Circadian Blood Pressure Variability in Healthy and Complicated Pregnancies . Hypertension\/ 30\/ (3), 603--610
work page 1997
-
[3]
Bi, X., X. Tang, Y. Yuan, Y. Zhang, and A. Qu (2021, March). Tensors in Statistics . Annual Review of Statistics and Its Application\/ 8\/ (1), 345--368
work page 2021
- [4]
-
[5]
Bro, R. (1998). Multi-way analysis in the food industry: models, algorithms, and applications . Ph.\ D. thesis, Universiteit van Amsterdam
work page 1998
-
[6]
Casadei, R., G. Parati, G. Pomidossi, A. Groppelli, S. Trazzi, M. Di Rienzo, and G. Mancia (1988, October). 24- Hour Blood Pressure Monitoring : Evaluation of Spacelabs 5300 Monitor by Comparison with Intra - Arterial Blood Pressure Recording in Ambulant Subjects . Journal of Hypertension\/ 6\/ (10), 797--803
work page 1988
- [7]
- [8]
Show all 49 references
-
[9]
De Moor, and J
De Lathauwer, L., B. De Moor, and J. Vandewalle (2000a, January). A Multilinear Singular Value Decomposition . SIAM Journal on Matrix Analysis and Applications\/ 21\/ (4), 1253--1278
-
[10]
De Moor, and J
De Lathauwer, L., B. De Moor, and J. Vandewalle (2000b, January). On the Best Rank -1 and Rank -( R _ 1 , R _ 2 ,. . ., R _ N ) Approximation of Higher - Order Tensors . SIAM Journal on Matrix Analysis and Applications\/ 21\/ (4), 1324--1342
-
[11]
Edelman, A., T. A. Arias, and S. T. Smith (1998, January). The Geometry of Algorithms with Orthogonality Constraints . SIAM Journal on Matrix Analysis and Applications\/ 20\/ (2), 303--353
1998
-
[12]
Edwards, L. J. and S. L. Simpson (2014, June). An Analysis of 24- Hour Ambulatory Blood Pressure Monitoring Data using Orthonormal Polynomials in the Linear Mixed Model . Blood Pressure Monitoring\/ 19\/ (3), 153--163
2014
-
[13]
and L.-H
Friedland, S. and L.-H. Lim (2017, September). Nuclear Norm of Higher - Order Tensors . Mathematics of Computation\/ 87\/ (311), 1255--1281
2017
-
[14]
Ghosal, R., S. K. Ghosh, J. A. Schrack, and V. Zipunnikov (2025, April). Distributional Outcome Regression via Quantile Functions and its Application to Modelling Continuously Monitored Heart Rate and Physical Activity . Journal of the American Statistical Association\/ , 1--13
2025
-
[15]
Golbus, J. R., N. A. Pescatore, B. K. Nallamothu, N. Shah, and S. Kheterpal (2021, November). Wearable Device Signals and Home Blood Pressure Data across Age , Sex , Race , Ethnicity , and Clinical Phenotypes in the Michigan Predictive Activity & Clinical Trajectories in Healt...
2021
-
[16]
Scheipl, L
Goldsmith, J., F. Scheipl, L. Huang, J. Wrobel, C. Di, J. Gellar, et al. (2024). refund: Regression with Functional Data . R package version 0.1-37
2024
-
[17]
Ilin, A. and T. Raiko (2010). Practical Approaches to Principal Component Analysis in the Presence of Missing Values . The Journal of Machine Learning Research\/ 11 , 1957--2000
2010
-
[18]
Kario, K., J. Shin, C. Chen, P. Buranakitjaroen, Y. Chia, R. Divinagracia, et al. (2019, September). Expert Panel Consensus Recommendations for Ambulatory Blood Pressure Monitoring in Asia : The HOPE Asia Network . The Journal of Clinical Hypertension\/ 21\/ (9), 1250--1283
2019
-
[19]
Tamura, T
Kawano, Y., A. Tamura, T. Watanabe, and J. Kadota (2010, July). Influence of the Severity of Obstructive Sleep Apnea on Heart Rate . Journal of Cardiology\/ 56\/ (1), 27--34
2010
-
[20]
Kolda, T. G. and B. W. Bader (2009, August). Tensor Decompositions and Applications . SIAM Review\/ 51\/ (3), 455--500
2009
-
[21]
Degeneracy
Krijnen, W. P., T. K. Dijkstra, and A. Stegeman (2008, September). On the Non - Existence of Optimal Solutions and the Occurrence of “ Degeneracy ” in the CANDECOMP / PARAFAC Model . Psychometrika\/ 73\/ (3), 431--439
2008
-
[22]
Kwon, Y., W. S. Tzeng, J. Seo, J. G. Logan, M. Tadic, G.-M. Lin, et al. (2024, August). Obstructive Sleep Apnea and Hypertension ; Critical Overview . Clinical Hypertension\/ 30\/ (1), 19
2024
-
[23]
Lambert, P. C., K. R. Abrams, D. R. Jones, A. W. F. Halligan, and A. Shennan (2001, December). Analysis of Ambulatory Blood Pressure Monitor Data Using a Hierarchical Model Incorporating Restricted Cubic Splines and Heterogeneous Within ‐ Subject Variances . Statistics in Medi...
2001
-
[24]
Larsen, B. W., T. G. Kolda, A. R. Zhang, and A. H. Williams (2024). Tensor decomposition meets rkhs: Efficient algorithms for smooth and misaligned data. arXiv preprint arXiv:2408.05677\/
2024 arXiv
-
[25]
Lu, H., K. N. Plataniotis, and A. N. Venetsanopoulos (2011, July). A Survey of Multilinear Subspace Learning for Tensor Data . Pattern Recognition\/ 44\/ (7), 1540--1551
2011
-
[26]
Browne, X
Madden, J., L. Browne, X. Li, P. Kearney, and A. Fitzgerald (2018, May). Morning Surge in Blood Pressure Using a Random ‐ Effects Multiple ‐ Component Cosinor Model . Statistics in Medicine\/ 37\/ (10), 1682--1695
2018
-
[27]
Madden, J. M., X. Li, P. M. Kearney, K. Tilling, and A. P. Fitzgerald (2017, February). Exploring Diurnal Variation Using Piecewise Linear Splines : An Example Using Blood Pressure . Emerging Themes in Epidemiology\/ 14\/ (1), 1
2017
-
[28]
Maranon, R. and J. F. Reckelhoff (2013, October). Sex and Gender Differences in Control of Blood Pressure . Clinical Science (London, England: 1979)\/ 125\/ (7), 311--318
2013
-
[29]
Murden, R. J., N. D. Fields, Z. T. Martin, B. B. Risk, A. Alonso, A. Manatunga, et al. (2025, March). Associations between Obesity Class and Ambulatory Blood Pressure Curves in African American Women . Obesity\/ 33\/ (3), 589--598
2025
-
[30]
Stergiou, E
Parati, G., G. Stergiou, E. O’Brien, R. Asmar, L. Beilin, G. Bilo, et al. (2014, July). European Society of Hypertension Practice Guidelines for Ambulatory Blood Pressure Monitoring . Journal of Hypertension\/ 32\/ (7), 1359--1366
2014
-
[31]
Pickering, T. G., D. Shimbo, and D. Haas (2006, June). Ambulatory Blood - Pressure Monitoring . New England Journal of Medicine\/ 354\/ (22), 2368--2374
2006
-
[32]
Prabhavathi, K., K. T. Selvi, K. N. Poornima, and A. Sarvanan (2014, August). Role of Biological Sex in Normal Cardiac Function and in its Disease Outcome - A Review . Journal of clinical and diagnostic research: JCDR\/ 8\/ (8), BE01--04
2014
-
[33]
Punjabi, N. M. (2008, February). The Epidemiology of Adult Obstructive Sleep Apnea . Proceedings of the American Thoracic Society\/ 5\/ (2), 136--143
2008
-
[34]
Fazel, and P
Recht, B., M. Fazel, and P. A. Parrilo (2010, January). Guaranteed Minimum - Rank Solutions of Linear Matrix Equations via Nuclear Norm Minimization . SIAM Review\/ 52\/ (3), 471--501
2010
-
[35]
Schenker, V
Roald, M., C. Schenker, V. D. Calhoun, T. Adali, R. Bro, J. E. Cohen, and E. Acar (2022, September). An AO - ADMM Approach to Constraining PARAFAC2 on All Modes . SIAM Journal on Mathematics of Data Science\/ 4\/ (3), 1191--1222
2022
-
[36]
Rooney, M. R., R. N. Aurora, D. Wang, E. Selvin, and N. M. Punjabi (2021, February). Rationale and Design of the Hyperglycemic Profiles in Obstructive Sleep Apnea ( HYPNOS ) Trial . Contemporary Clinical Trials\/ 101 , 106248
2021
-
[37]
Ruppert, D., M. P. Wand, and R. J. Carroll (2003, July). Semiparametric Regression \/ (1 ed.). Cambridge University Press
2003
-
[38]
Santos, M. A. A., A. C. S. Sousa, F. P. Reis, T. R. Santos, S. O. Lima, and J. A. Barreto-Filho (2013, November). Does the Aging Process Significantly Modify the Mean Heart Rate ? Arquivos Brasileiros De Cardiologia\/ 101\/ (5), 388--398
2013
-
[39]
Schwenck, J., N. M. Punjabi, and I. Gaynanova (2022, September). bp: Blood Pressure Analysis in R . PLOS ONE\/ 17\/ (9), e0268934
2022
-
[40]
Shang, H. L. (2014, April). A Survey of Functional Principal Component Analysis . AStA Advances in Statistical Analysis\/ 98\/ (2), 121--142
2014
-
[41]
Silverberg, D. S., A. Iaina, and A. Oksenberg (2002). Treating Obstructive Sleep Apnea Improves Essential Hypertension and Quality of Life . American Family Physician\/ 65\/ (2), 229--237
2002
-
[42]
Tanaka, H., K. D. Monahan, and D. R. Seals (2001, January). Age- Predicted Maximal Heart Rate Revisited . Journal of the American College of Cardiology\/ 37\/ (1), 153--156
2001
-
[43]
Timmerman, M. E. and H. A. Kiers (2002, September). Three-way component analysis with smoothness constraints. Computational Statistics & Data Analysis\/ 40\/ (3), 447--470
2002
-
[44]
Tucker, L. R. (1966, September). Some Mathematical Notes on Three - Mode Factor Analysis . Psychometrika\/ 31\/ (3), 279--311
1966
-
[45]
(1994, July)
Whelton, P. (1994, July). Epidemiology of Hypertension . The Lancet\/ 344\/ (8915), 101--106
1994
-
[46]
(2005, November)
Ye, J. (2005, November). Generalized Low Rank Approximations of Matrices . Machine Learning\/ 61\/ (1-3), 167--191
2005
-
[47]
and C.-H
Yuan, M. and C.-H. Zhang (2016, August). On Tensor Completion via Nuclear Norm Minimization . Foundations of Computational Mathematics\/ 16\/ (4), 1031--1068
2016
-
[48]
Ding, and F
Zheng, S., C. Ding, and F. Nie (2018). Regularized Singular Value Decomposition and Application to Recommender System . arXiv preprint arXiv:1804.05090\/
2018 arXiv
-
[49]
Zhou, Y., R. K. W. Wong, and K. He (2021). Tensor Linear Regression : Degeneracy and Solution . IEEE Access\/ 9 , 7775--7788
2021
Reviewed August 6, 2026 · model on record in the stance chip above.
Discussion (0). Continue with ORCID to comment.