REVIEW 3 major objections 4 minor 30 references
Frequency Observations and Statistic Analysis of Worldwide Main Power Grids Using FNET/GridEye
T0 review · 3 major / 4 minor · reviewed 2026-08-14 · deepseek-v4-flash
Pith's one-line read A bell curve describes frequency in seven of 13 power grids.
desk verdict A worthwhile 13-grid frequency survey whose 'almost normal' claim is a same-data overlay, not a tested result. read the letter →
The pith
A machine-rendered reading of the paper's core claim, the machinery that carries it, and where it could break.
The reading
What carries the argument
The key machinery is the frequency disturbance recorder (FDR), a low-cost distribution-level sensor that streams GPS-synchronized frequency measurements at ten samples per second to FNET/GridEye servers. Three months of data from one FDR per grid are cleaned, converted to per-unit frequency, and summarized as empirical probability density functions. The paper then fits a two-parameter normal distribution to the single-peak histograms using the sample mean and standard deviation, using the visual match between the fitted curve and the histogram as evidence. Daily means and standard deviations for EI, Egypt, and Japan are additionally used to reveal operating status such as Egypt's persistent under-frequency operation.
What would settle it
Take two or more FDRs located in different regions of the same interconnection (for example, the U.S. Eastern Interconnection) and compute their three-month frequency histograms separately; if the single- versus multi-peak classification or the fitted Gaussian mean and standard deviation differ markedly between the sensors, then the paper's per-grid statistics reflect local sensor behavior rather than grid-wide frequency status.
Extended reading notes
Core claim
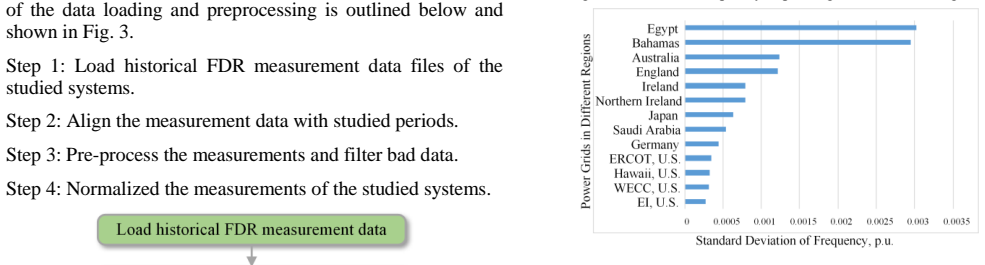
The central discovery is that for seven of the thirteen grids – the U.S. Eastern Interconnection, WECC, Hawaii, Germany, Japan, Australia, and Egypt – the empirical probability density function of frequency closely matches a Gaussian curve whose parameters are the empirically computed mean and standard deviation. The remaining six grids – ERCOT, Saudi Arabia, Northern Ireland, Ireland, England, and Bahamas – show multi-peak histograms that no single normal distribution can represent. The paper further shows that mainland grids generally have smaller frequency standard deviations than island grids, with Egypt as the largest-deviation outlier and Hawaii as a low-deviation island, and that most grids operate within NERC load-shedding thresholds.
Load-bearing premise
The entire cross-grid comparison rests on the assumption that a single frequency disturbance recorder per country captures the frequency behavior of the whole interconnection, with no validation against other sensors on the same grid.
Editorial extensions
If this is right
- For single-peak grids, a normal distribution with the observed mean and standard deviation provides a workable empirical model, so frequency can be summarized by two numbers without a more complex model.
- The single-peak/multi-peak taxonomy gives a simple way to compare frequency statistics across countries and could serve as a baseline for tracking how renewable penetration changes frequency behavior.
- Mainland grids in this sample generally exhibit smaller frequency standard deviations than island grids, suggesting that interconnection size dampens frequency fluctuation; Egypt is an exception with the highest deviation, and Hawaii is an island with unusually low deviation.
- Most studied grids keep their frequency deviations within NERC's under-frequency load-shedding thresholds, while Egypt's standard deviation approaches that limit, indicating a stressed system over the observation period.
Reading between the lines
- If the Gaussian behavior is persistent, mean and standard deviation could serve as simple health metrics: a shift in the mean or widening of the standard deviation after a policy change would be detectable with these two numbers alone.
- The six multi-peak grids invite a mixture-of-Gaussians or heavy-tailed follow-up analysis, which the paper does not pursue.
- The single-sensor assumption is directly testable: comparing two FDRs on the same interconnection would show whether the reported statistics are grid properties or sensor properties.
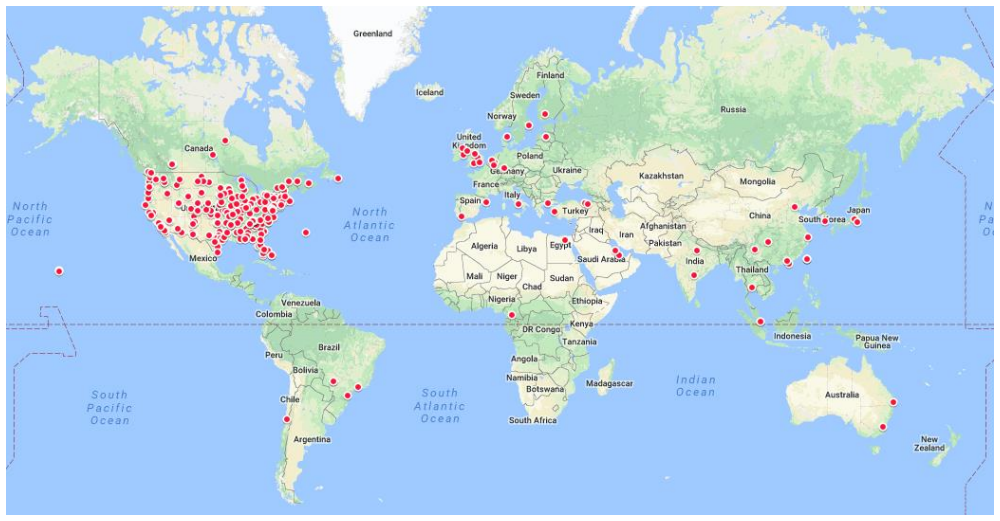
- Because FNET/GridEye already deploys hundreds of FDRs in dozens of countries, the same histogram procedure could produce a global map of frequency statistics far beyond the 13 grids studied here.
Signed reviews
Editorial analysis
A structured set of objections, weighed in public.
Referee Report
Summary. The manuscript reports an observational statistical study of power frequency in 13 worldwide power grids using FNET/GridEye distribution-level frequency disturbance recorder measurements sampled at 10 Hz over roughly three months. For each grid it computes mean frequency and standard deviation, compares mainland versus island behavior, and classifies the empirical frequency distributions into single-peak and multi-peak families. It then selects EI, Egypt, and Japan for more detailed daily statistics, and claims that the single-peak distributions 'almost follow the normal distribution,' illustrating this by overlaying Gaussian curves on the histograms of seven grids. The paper concludes that the observed statistical characteristics can aid grid operators and future frequency regulation studies.
Significance. The dataset assembled here is valuable: simultaneous multi-grid frequency observations across 13 systems are rare, and the reported means and standard deviations provide a useful descriptive baseline for cross-grid frequency behavior. If the single-peak/multi-peak classification and the Gaussian approximation for single-peak grids were rigorously established, the paper would provide a simple empirical model of interest to frequency-control and reserve-sizing studies. However, the central normality claim is currently supported only by an in-sample visual overlay, and the classification is made by eye; as presented, the scientific contribution is descriptive rather than confirmatory. The paper would be strengthened materially by adding quantitative distributional tests, unimodality criteria, and sensitivity analysis.
major comments (3)
- [Section III, Figs. 7 and 8] The headline claim that single-peak frequency distributions 'almost follow the normal distribution' is not supported by the evidence reported. The red normal curves in Fig. 8 are constructed from the sample mean and standard deviation of the very same histogram data, so the agreement is an in-sample property, not an independent test. No goodness-of-fit statistic (e.g., Kolmogorov-Smirnov, Anderson-Darling), tail-quantile comparison, or alternative distribution benchmark (e.g., Laplace, Student-t) is provided, and the qualifier 'almost' is never defined. Since each grid contributes millions of samples (10 samples/s for three months), exact Gaussianity would be rejected by any classical test; the practically relevant question is whether the Gaussian approximation holds within some stated tolerance, and the manuscript does not quantify that tolerance.
- [Section III, Fig. 7 and Table I] The single-peak versus multi-peak classification of the 13 grids is based on visual inspection of one histogram per grid, with no unimodality test, no bin-width sensitivity analysis, and no quantitative criterion for what constitutes a peak. For borderline cases such as Egypt (Fig. 7(g)), whose histogram appears skewed and heavy-tailed, the inclusion in the 'single-peak normal' family is not self-evident; for ERCOT and the multi-peak group, the visible secondary modes could be artifacts of binning or of a sensor-specific event. Without a reproducible classification rule, the claim that the 13 grids divide into these two families is not robust.
- [Section II, last paragraph] The cross-grid comparison assumes that one FDR per country represents the frequency behavior of the entire interconnection, justified only by Refs. [29]-[30]. For large systems such as EI and WECC, a single distribution-level sensor can be influenced by local load or generation events, and the manuscript provides no validation against other sensors on the same grid or against control-area frequency statistics. Consequently, the reported mean, standard deviation, and the single/multi-peak classification could reflect local sensor behavior rather than grid-wide frequency status, which limits the generality of the cross-grid conclusions.
minor comments (4)
- [Section III, Fig. 6] The manuscript states that three months of data are retrieved for the 13 grids, but the daily analysis in Fig. 6 is described as using a one-month period; the discrepancy should be clarified.
- [Introduction, paragraph 1] The phrase 'due to its clean, low-cost and inexhaustible features' refers to renewable energy sources but uses a singular pronoun; please revise for grammatical consistency.
- [References] Reference [2] appears to be a URL fragment appended to the National Conference of State Legislatures reference without proper formatting, and several references (e.g., [13]) are not cited in the text; the reference list should be checked for completeness and consistency.
- [Section II, paragraph 2] The sentence 'The frequencies in all mainland power grids have smaller standard deviations, comparing to the frequencies in island power grids' is contradicted by the paper's own observation that Egypt, a mainland grid, has the highest standard deviation; rephrase to acknowledge the exceptions.
Circularity Check
No significant circularity: the paper reports descriptive statistics and an in-sample normal fit, and it does not present any fitted parameter as a prediction or derive its claims from self-citation.
full rationale
The paper's central claims are empirical observations: the mean and standard deviation of frequency measurements in 13 grids, a visual single-peak/multi-peak classification, and a statement that single-peak distributions 'almost follow the normal distribution.' The normal curves in Fig. 8 are generated from the sample means and standard deviations of the same data, but this is an in-sample descriptive fit, not a prediction from first principles. The paper never claims to predict the distribution from independent inputs, nor does it rename a fitted parameter as a derived result. The one-FDR-per-grid representativeness assumption is supported by prior FNET literature (refs [29]-[30]), including some overlapping authors, but that citation is an external empirical claim about intra-system frequency differences, not a load-bearing self-referential theorem, and it does not make the statistical classification circular. No equation is shown to reduce to its own inputs, and no fitted quantity is called a prediction. The lack of goodness-of-fit tests or unimodality criteria is a methodological weakness, but it is not circularity under the stated rules. Therefore, the appropriate finding is no significant circularity.
Assumptions & free parameters
free parameters (1)
- Sample mean and standard deviation for each of the seven single-peak grids (EI, WECC, Hawaii, Germany, Japan… =
Computed from the same data under study; values shown in Figs. 4-5 but not tabulated in the text
assumptions (4)
- domain assumption A single distribution-level FDR measurement is representative of the frequency of the entire interconnection
- domain assumption The three-month (and one-month for the detailed study) observation window is representative of normal and transient operation
- domain assumption The bad-data filter removes only measurement errors and does not selectively remove valid frequency excursions
- ad hoc to paper The normal distribution is the appropriate baseline for 'single-peak' frequency distributions
Cite this review
Pith. "Pith review of Frequency Observations and Statistic Analysis of Worldwide Main Power Grids Using FNET/GridEye." pith.science (2026). https://pith.science/paper/KRAOEHKQ
@misc{pith2026190803823,
  author       = {Pith},
  title        = {Pith review of: Frequency Observations and Statistic Analysis of Worldwide Main Power Grids Using FNET/GridEye},
  year         = {2026},
  howpublished = {\url{https://pith.science/paper/KRAOEHKQ}},
  note         = {Machine review of arXiv:1908.03823}
}
read the original abstract
With the increasing renewable energy sources, concerns about how renewable energy sources impact frequency have risen. There are few reports regarding power frequency status in worldwide main power grids and what are differences of frequency status between power grids in mainland and island. FNET/GridEye, a wide-area measurement system collecting frequency and phase angle data at the distribution level, provides an opportunity to observe and study the power frequency in different power grids over the world. In this paper, 13 different power grids, spreading at different mainland and islands over the world, are observed and compared. A more detail statistical analysis was conducted for typical power grids in three different places, e.g., U.S Eastern Interconnection (EI), Egypt, and Japan. The probability functions of frequency based on the measured data are calculated. The distributions of frequency in different power grids fall into two categories, e.g., single-peak distribution and multi-peak distribution. Furthermore, a meaningful insight that the single-peak distributions of the frequency almost follow the normal distribution is found. The frequency observations and statistic analysis of worldwide main power grids using FNET/GridEye could help the power system operators understand the frequency statistical characteristic more deeply.
Figures


Figures from the paper (4 more)


Reference graph
Works this paper leans on
-
[29]
Internet based frequency monitoring network (FNET),
Bin Qiu, Ling Chen, V. Centeno, Xuzhu Dong an d Yilu Liu, "Internet based frequency monitoring network (FNET)," 2001 IEEE Power Engineering Society Winter Meeting. Conference Proceedings (Cat. No.01CH37194), Columbus, OH, USA, 2001, pp. 1166-1171 vol.3
work page 2001
-
[30]
Power system frequency moni toring network (FNET) implementation,
Zhian Zhong et al., "Power system frequency moni toring network (FNET) implementation," in IEEE Transactions on Power Systems, vol. 20, no. 4, pp. 1914-1921, Nov. 2005
work page 1914
-
[1]
Integrating Wind Power into the Electric Grid -Prospectives for Policymakers
“ Integrating Wind Power into the Electric Grid -Prospectives for Policymakers”, National Conference of State Legislature. [Online].Available:
-
[2]
http://www.uwig.org/ncsl-wind_integration.pdf
-
[3]
Wind Energy Integration into the South African Grid: Prospects and Challenges
K.A. Folly, “Wind Energy Integration into the South African Grid: Prospects and Challenges”, Wind Energy -developments, Potential and Challenges, pp.93-120, Nova Publisher, New York, 2016
work page 2016
-
[5]
Analytic Analysis for Dynamic System Frequency in Power Systems Under Uncertain Variability,
H. Li, P. Ju, C. Gan, S. You, F. Wu and Y. Liu, "Analytic Analysis for Dynamic System Frequency in Power Systems Under Uncertain Variability," in IEEE Transactions on Power Systems, in press
-
[6]
Analytic Estimation Method of Forced Oscillation Amplitude Under Stochastic Continuous Disturbances,
H. Li, P. Ju, C. Gan, Y. Tang, Y. Yu and Y. Liu, "Analytic Estimation Method of Forced Oscillation Amplitude Under Stochastic Continuous Disturbances," in IEEE Transactions on Smart Grid, in press
-
[7]
Analyt ical Assessment for Transient Stability Under Stochastic Continuous Disturbances,
P. Ju, H. Li, C. Gan, Y. Liu, Y. Yu and Y. Liu, "Analyt ical Assessment for Transient Stability Under Stochastic Continuous Disturbances," in IEEE Transactions on Power Systems, vol. 33, no. 2, pp. 2004 -2014, March 2018
work page 2004
Show all 30 references
-
[8]
Stochastic Dynamic Analysis for Power Sys tems Under Uncertain Variability,
P. Ju, H. Li, X. Pan, C. Gan, Y. Liu and Y. Liu, "Stochastic Dynamic Analysis for Power Sys tems Under Uncertain Variability," in IEEE Transactions on Power Systems, vol. 33, no. 4, pp. 3789 -3799, July 2018
2018
-
[9]
High frequency deviations within the European Power System: Origins and proposals for improvement,
T. Weissbach and E. Welfonder, "High frequency deviations within the European Power System: Origins and proposals for improvement," 2009 IEE E/PES Power Systems Conference and Exposition, Seattle, WA, 2009, pp. 1-6
2009
-
[10]
The impact of operating reserves on investment planning of renewable power systems,
A. van Stiphout, K. De Vos and G. Deconinck, "The impact of operating reserves on investment planning of renewable power systems," 2017 IEEE Manchester PowerTech, Manchester, 2017
2017
-
[11]
Estimation of Regulation Reserve Requirement based on Control Performance Standard,
G. Zhang and J. D. McCalley, "Estimation of Regulation Reserve Requirement based on Control Performance Standard," in IEEE Transactions on Power Systems, vol. PP, no. 99, pp. 1-1
-
[12]
Impacts of dynamic probabilistic rese rve sizing techniques on reserve requirements and system costs,
M. Bucksteeg, L. Niesen and C. Weber, "Impacts of dynamic probabilistic rese rve sizing techniques on reserve requirements and system costs," IEEE Transactions on Sustainable Energy, vol. 7, no. 4, pp. 1408-1420, 2016
2016
-
[13]
Analyzing techniques for increasing power transfer in the elec tric grid,
K. Dave, N. Mohan, X. Deng, R. Gorur and R. Olsen, "Analyzing techniques for increasing power transfer in the elec tric grid," 2012 North American Power Symposium (NAPS), Champaign, IL, 2012, pp. 1-6
2012
-
[14]
Flexible Frequency Operation Strategy of Power System With High Renewable Penetration,
J. Suh, D. H. Yoon, Y. S. Cho and G. Jang, "Flexible Frequency Operation Strategy of Power System With High Renewable Penetration," in IEEE Transactions on Sustainable Energy, vol. 8, no. 1, pp. 192-199, Jan. 2017
2017
-
[15]
Observation of inertial frequency response of main power grids worldwide using FNET/GridEye,
Ling Wu, Y. Liu, Dao Zhou, Jiahui Guo and Y. Liu, "Observation of inertial frequency response of main power grids worldwide using FNET/GridEye," 2016 IEEE Power and Energy Society General Meeting (PESGM), Boston, MA, 2016, pp. 1-5
2016
-
[16]
Measurement- driven Disturbance Magnitude Estimations for Bulk Power Systems ,
Y. Zhang, X. Deng, S. You, J. Dong, W. Yu, Y. Liu, "Measurement- driven Disturbance Magnitude Estimations for Bulk Power Systems ," 2019 IEEE PES GTD Grand International Conference and Exposition Asia, Bangkok, Thailand
2019
-
[17]
Impacts of Power Grid Frequency Deviation on Time Error of Synchronous Electric Clock and Worldwide Power System Practices on Time Error Correction,
Zhang, Yao et al . “Impacts of Power Grid Frequency Deviation on Time Error of Synchronous Electric Clock and Worldwide Power System Practices on Time Error Correction,” Energies,1283, Oct., 2017
2017
-
[18]
M. D. Hadley, J. B. McBride, T. W. Edgar, L. R. O’Neil, and J. D. Johnson. ( Jun. 2007). Securing Wide Area Measurement Systems. [Online]. Available: http://energy.gov/oe/downloads/ securing -wide- area-measurement-systems
2007
-
[19]
Energy Efficient Security Algorithm for Power Grid Wide Area M onitoring System,
M. Qiu, W. Gao, M. Chen, J. W. Niu and L. Zhang, "Energy Efficient Security Algorithm for Power Grid Wide Area M onitoring System," in IEEE Transactions on Smart Grid, vol. 2, no. 4, pp. 715 -723, Dec. 2011
2011
-
[20]
Recent developments of FNET/GridEye — A situational awareness tool for smart grid,
Y. Liu et al., "Recent developments of FNET/GridEye — A situational awareness tool for smart grid," in CSEE Journal of Power and Energy Systems, vol. 2, no. 3, pp. 19-27, Sept. 2016
2016
-
[21]
ARMAX -based Transfer Function Model Identification Using Wide -area Measurement for Adaptive and Coordinated Damping C ontrol
Hesen Liu, Lin Zhu, Zhuohong Pan, Feifei Bai, Yong Liu, Yilu Liu, Mahendra Patel, Evangelos Farantatos, Navin Bhatt. “ARMAX -based Transfer Function Model Identification Using Wide -area Measurement for Adaptive and Coordinated Damping C ontrol”, IEEE Trans. Smart Grid, 2017, ...
2017
-
[22]
Distributed Data Analytics Platform for Wide -Area Synchrophasor Measurement Systems
Dao Zhou, Jiahui Guo, Ye Zhang, Jidong Chai, Hesen Liu, Yong Liu, Can Huang, Xun Gui, Yilu Liu . “Distributed Data Analytics Platform for Wide -Area Synchrophasor Measurement Systems ”, IEEE Trans. Smart Grid, 2016, 2397- 2405
2016
-
[23]
A Distribution Level Wide Area Monitoring System for the Electric Power Grid –FNET/GridEye,
Y. Liu et al., "A Distribution Level Wide Area Monitoring System for the Electric Power Grid –FNET/GridEye," in IEEE Access, vol. 5, pp. 2329-2338, 2017
2017
-
[24]
Study on the CIM based data integration platform,
X. Deng, Y. Chen and Ying Li, "Study on the CIM based data integration platform," ISGT 2011, Hilton Anaheim, CA, 2011, pp. 1-5
2011
-
[25]
A Survey on Next-generation Power Grid Data Architecture
Shutang You, Lin Zhu, Yong Liu, Hesen Liu , Yilu Liu, Mallikarjun Shankar, Russell Robertson, Tom King. “A Survey on Next-generation Power Grid Data Architecture ”, 2015 IEEE PES General Meeting , 2015, 1-5
2015
-
[26]
Model of parameterized PMU estimation error
J. Zha o, A. Goldstein, Y. Liu, “Model of parameterized PMU estimation error”, 2017 IEEE PES General Meeting, Chicago, IL, 2017
2017
-
[27]
PMU error impact on measurement -based applications
J. Zhao, J. Tan, L. Wu, L. Zhan, W. Yao, Y. Liu, J. Gracia, P. Ewing, “PMU error impact on measurement -based applications”, 2017 IEEE PES General Meeting, Chicago, IL, 2017
2017
-
[28]
Measurement accuracy limitation analysis on synchrophasors
J. Zhao, L. Zhan, Y. Liu, H. Qi, J. R. Garcia, P. D. Ewing, “Measurement accuracy limitation analysis on synchrophasors”, 2015 IEEE PES General Meeting, Denver, CO, 2015
2015
-
[31]
Automatic Under frequency Load Shedding Requirements
“ Automatic Under frequency Load Shedding Requirements”, North American Electric Reliability Corporation, available at : https://www.nerc.com/pa/Stand/Reliability%20Standards/PRC-006- 3.pdf
Reviewed August 14, 2026 · model on record in the stance chip above.
Discussion (0). Continue with ORCID to comment.