REVIEW 3 major objections 4 minor 41 references
First detection of $A$--$X$ (0,0) bands of interstellar C$_2$ and CN
T0 review · 3 major / 4 minor · reviewed 2026-08-14 · deepseek-v4-flash
Pith's one-line read The near-infrared (0,0) bands of C2 and CN have been detected in interstellar gas for the first time.
desk verdict C2 (0,0) first detection looks solid and likely to stand; CN (0,0) is plausible but rests on three telluric-contaminated unresolved lines; 12C13C is honestly flagged as marginal. read the letter →
The pith
A machine-rendered reading of the paper's core claim, the machinery that carries it, and where it could break.
The reading
What carries the argument
The load-bearing object is the pair of near-infrared electronic absorption bands: the C2 Phillips system ($A^1\Pi_u$--$X^1\Sigma_g^+$) (0,0) band and the CN red system ($A^2\Pi_u$--$X^2\Sigma^+$) (0,0) band, observed with a high-resolution echelle spectrograph at $R = 20{,}000$ and 68,000. Their larger oscillator strengths, compared with the optical (2,0) bands, make high-rotational lines detectable and allow the C2 lines to be separated into three velocity components. The rotational-level column densities obtained by Voigt-profile fitting are fed into a standard radiative-excitation model of C2 that returns kinetic temperature and gas density; the relative strengths of the (0,0) and (1,0) bands constrain the oscillator-strength ratio $f_{00}/f_{10}$, and the weak $^{12}$C$^{13}$C lines constrain the carbon isotope ratio.
What would settle it
Re-observe Cygnus OB2 No. 12 with higher signal-to-noise and resolving power at a dry site, and check whether the claimed C2 (0,0) and CN (0,0) lines persist under an independent, time-dependent atmospheric-transmission correction; for the isotope claim, verify that the $^{12}$C$^{13}$C Q(3) dips grow with integration time and do not track residual telluric structure.
Extended reading notes
Core claim
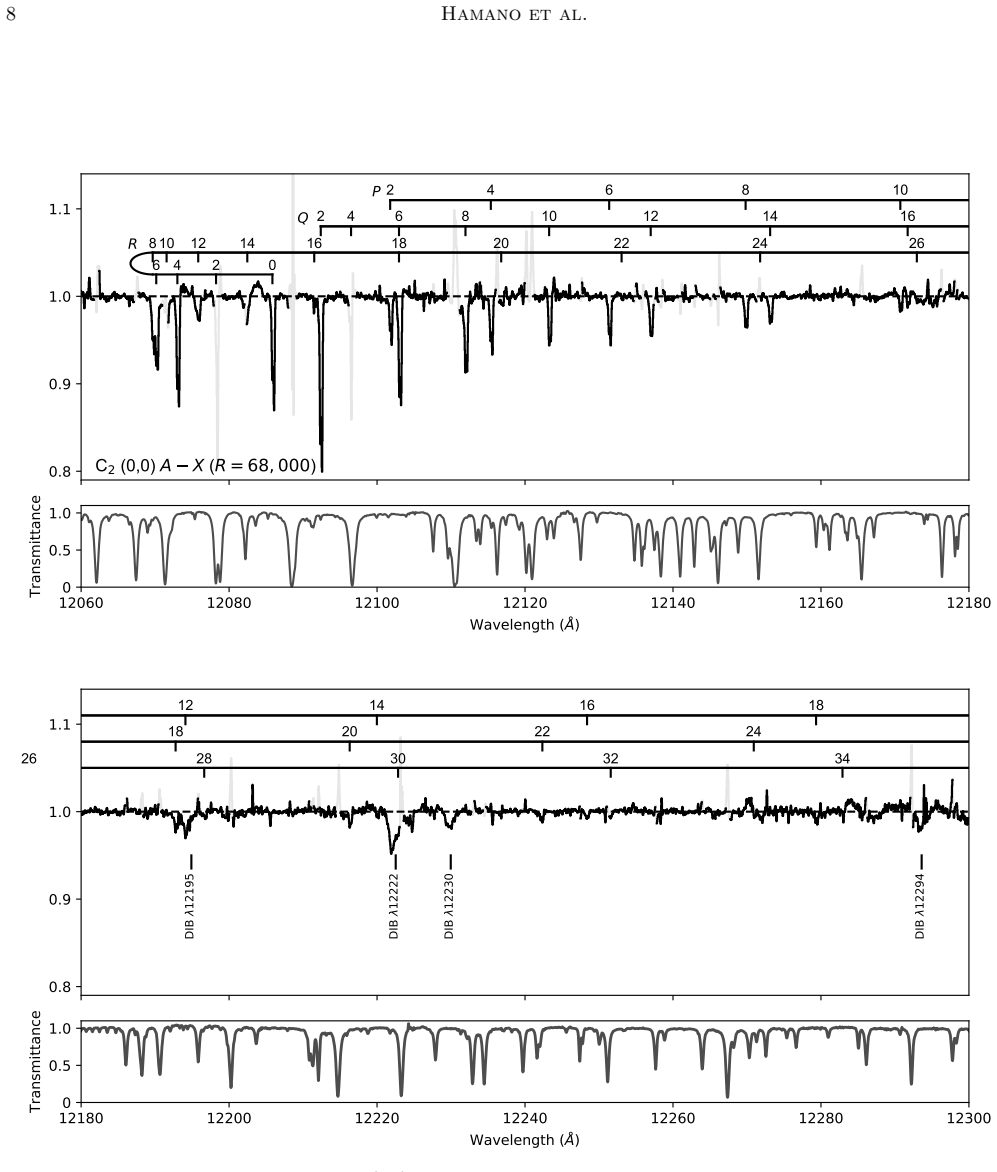
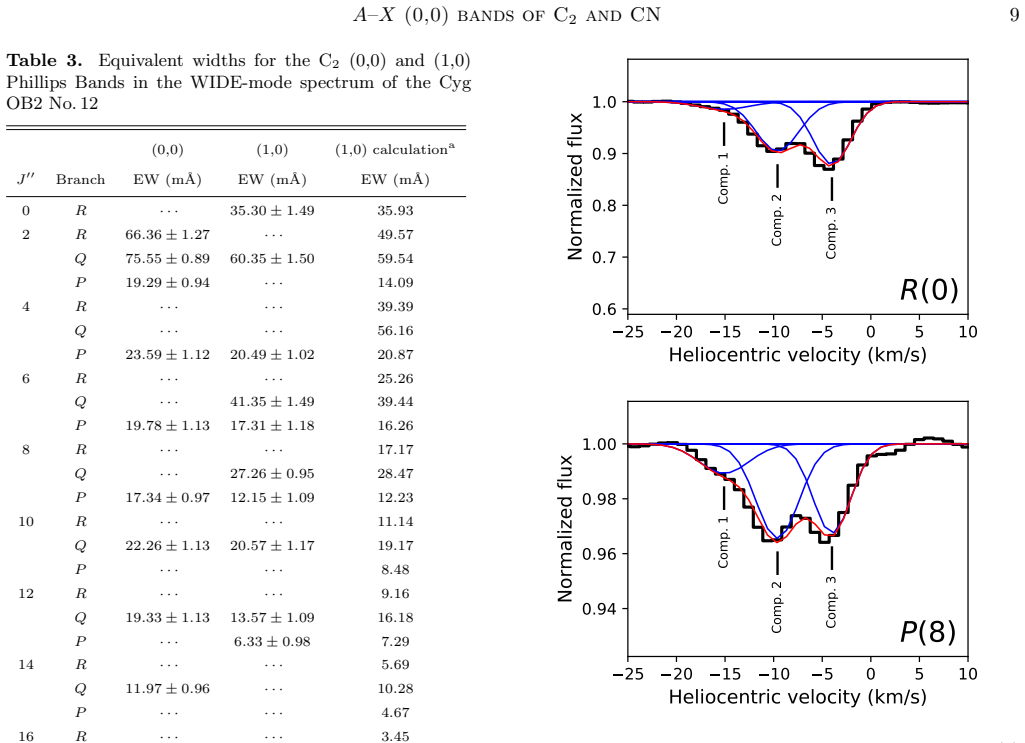
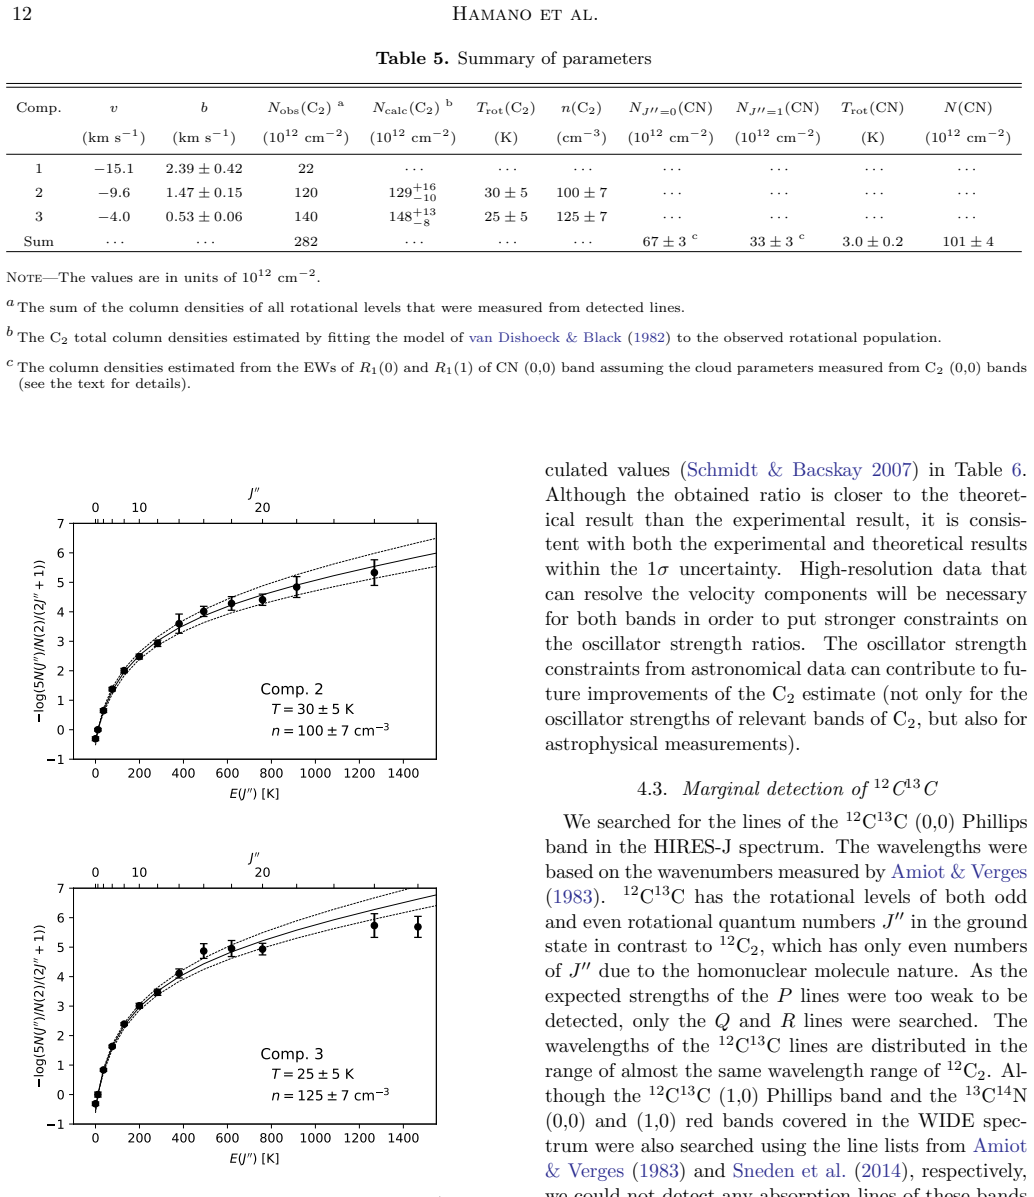
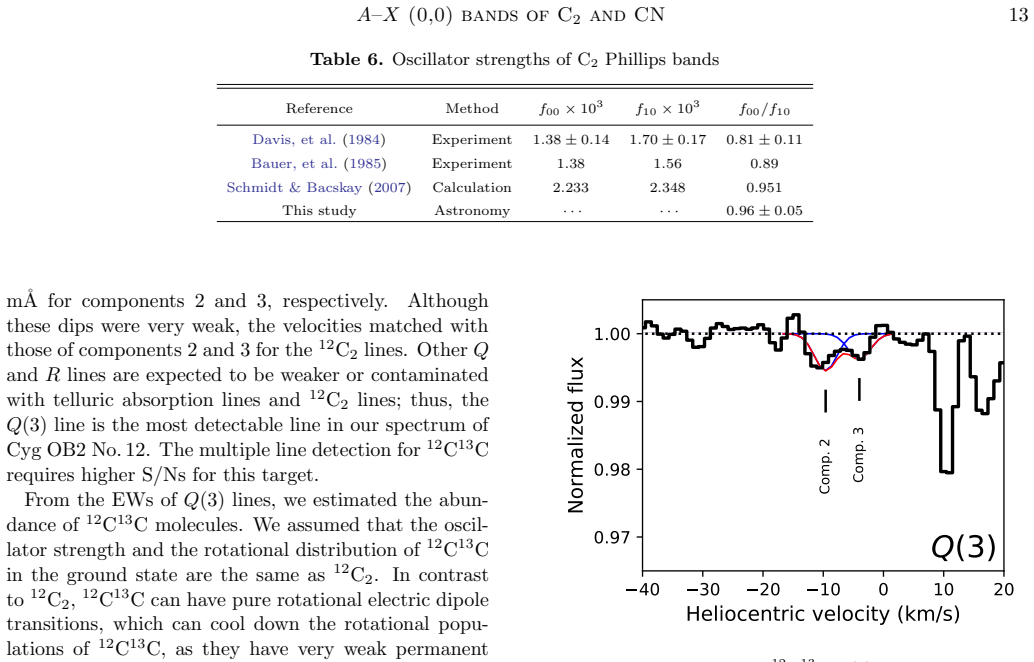
The paper claims that the (0,0) vibrational bands of the C2 Phillips system ($A^1\Pi_u$--$X^1\Sigma_g^+$, near 1.21 $\mu$m) and the CN red system ($A^2\Pi_u$--$X^2\Sigma^+$, near 1.10 $\mu$m) are present in absorption in the interstellar medium along the line of sight to Cygnus OB2 No. 12, detected together with the corresponding (1,0) bands. In the $R = 68{,}000$ C2 spectrum, three velocity components at $-15.1$, $-9.6$, and $-4.0$ km s$^{-1}$ are resolved, and lines are seen up to $J''\approx20$, so the rotational population of each component can be fitted separately. From those populations the authors derive per-component kinetic temperatures and gas densities, and from the ratio of (0,0) to (1,0) band strengths they constrain the oscillator-strength ratio $f_{00}/f_{10}=0.96\pm0.05$, consistent with both theoretical and experimental values within the 1$\sigma$ uncertainties. They also report a marginal $\approx3\sigma$ detection of $^{12}$C$^{13}$C Q(3) lines---the first reported interstellar detection of $^{12}$C$^{13}$C---from which they estimate $^{12}$C/$^{13}$C = 50--100.
Load-bearing premise
The claim depends on the telluric division and continuum normalization being accurate in the water-contaminated near-infrared (and, for CN, on clean separation from the stellar Pa$\gamma$ and He I features), so that residual telluric or stellar structure is not mistaken for interstellar absorption.
Editorial extensions
If this is right
- The NIR (0,0) bands, being stronger than the optical (2,0) bands, can serve as primary diagnostics of C2 and CN column densities, temperatures, and densities along reddened sightlines.
- Because the C2 (0,0) spectrum resolves three velocity components, physical conditions can now be assigned to individual cloud components rather than averaged over the whole line of sight.
- The estimated carbon isotope ratio $^{12}$C/$^{13}$C = 50--100, if confirmed, provides an independent check on Galactic carbon-isotope ratios in translucent gas.
- The measured oscillator-strength ratio $f_{00}/f_{10}=0.96\pm0.05$ can, with higher-resolution data for both bands, discriminate between experimental and theoretical C2 band strengths.
Reading between the lines
- If the NIR (0,0) bands are detectable toward fainter or more heavily reddened stars, the same technique could extend C2/CN cloud diagnostics to sightlines where optical bands are too weak, broadening surveys of translucent clouds.
- A confirmed multi-line detection of $^{12}$C$^{13}$C would allow carbon-isotope ratios to be measured in gas where common CO or CH+ tracers are unavailable or depleted, providing a new probe of Galactic chemical evolution.
- The near-equality $f_{00}\approx f_{10}$ implied by the measured ratio suggests the two bands are nearly equally efficient for absorption studies; sharpening this ratio could also calibrate the transition dipole moments used in C2 excitation and photodissociation models.
- Velocity-resolved temperatures and densities per component, combined with diffuse interstellar band measurements in the same spectra, could test whether the carriers of the bands, including fullerene cations, are spatially associated with the C2-bearing cloudlets.
Signed reviews
Editorial analysis
A structured set of objections, weighed in public.
Referee Report
Summary. The paper reports the first detections of the C2 A1Pi_u-X1Sigma_g+ (0,0) Phillips band and the CN A2Pi_u-X2Sigma+ (0,0) red band in the interstellar medium, observed toward Cygnus OB2 No.12 with the WINERED spectrograph at R=20,000 and R=68,000. In the C2 (0,0) band, three velocity components are resolved, rotational lines are detected up to J''~20-28, and the rotational excitation yields kinetic temperatures and densities of (30±5 K, 100±7 cm^-3) and (25±5 K, 125±7 cm^-3) for components 2 and 3. The paper also derives an oscillator-strength ratio f00/f10=0.96±0.05 from the (0,0) and (1,0) band equivalent widths, and reports a marginal detection of 12C13C Q(3) lines leading to an estimated carbon isotope ratio 12C/13C=50-100. The CN (0,0) detection is based on three unblended lines in the R=20,000 WIDE-mode spectrum, with velocity components unresolved and with acknowledged heavy telluric contamination.
Significance. If the detections hold, this paper opens a new observational window: the NIR (0,0) bands have larger oscillator strengths than the optical (2,0) bands, enabling higher-precision measurements of C2 rotational excitation, cloud temperature and density, and potentially a new route to interstellar carbon isotope ratios. The C2 (0,0) detection is strong: it is supported by a high-resolution spectrum, multiple unblended P/Q/R lines, resolved velocity structure, and consistency with earlier FWHM and column-density measurements by McCall et al. (2002) and Gredel et al. (2001). The paper is also honest about its limitations, explicitly labeling the 12C13C lines as marginal and the CN results as subject to telluric and stellar systematic uncertainties. However, the central first-detection claim for CN (0,0) and the isotope-ratio claim rest on much weaker evidence, so the significance of the paper is proportional to whether those weak points can be buttressed.
major comments (3)
- [Section 3.2, Table 4] The CN (0,0) first-detection claim rests on only three unblended lines (SR21(0), R1(1), R1(0)) in R=20,000 WIDE-mode data in which the velocity components are unresolved. The paper itself states in Section 3.2 that both CN bands were 'severely contaminated by telluric absorption lines' and that the results are 'likely to be affected by the systematic uncertainties due to the residual of telluric absorption lines and the stellar lines.' No quantitative test is shown demonstrating that residual telluric or continuum structure cannot produce the observed 10-74 mAngstrom features, especially R1(0) at 10992.869 Angstrom, which lies near the stellar He I blend at 10997.4 Angstrom and is measured after a 5th-order Legendre continuum fit. Because a telluric or continuum artifact would invalidate the first-detection claim, please provide a direct telluric-residual assessment, for example by applying the same division and continuum-fitting procedure to the telluric standard star and showing that residual features at the CN line positions are below the reported line strengths, or by presenting a high-resolution CN spectrum that resolves the expected -15.1, -9.6, and -4.0 km/s components.
- [Section 4.1, Figure 5] The quoted kinetic temperatures and densities for C2 are derived using the van Dishoeck & Black (1982) excitation model, but that model is calculated only for J''<=20, while the observed rotational populations extend to J''~28. The paper extrapolates the model parameters to J''>20 by fitting power-law functions of J''. This is an ad hoc extrapolation, and the reported uncertainties on T and n (e.g., 30±5 K and 100±7 cm^-3 for component 2) do not include its systematic effect. Since the high-J lines are a key advantage of the (0,0) band, please quantify the sensitivity of T and n to the extrapolation, for example by re-fitting using only J''<=20 data or by varying the power-law extrapolation and reassessing the confidence intervals.
- [Section 4.3, Figure 6, Abstract] The 12C13C detection is based on a single Q(3) line per velocity component, with equivalent widths of 1.0±0.3 and 0.7±0.3 mAngstrom (roughly 2-3 sigma), and the summary itself says 'If these lines are real, this is the first detection.' The abstract nevertheless states that 12C13C was 'marginally detected' for the first time, and the derived 12C/13C=50-100 is presented in the abstract as a result. I recommend either softening the abstract and headline language to 'candidate detection' or providing additional confirming rotational lines; otherwise the isotope ratio should be explicitly framed as conditional on line reality.
minor comments (4)
- [Section 2 and Table 1] The WIDE-mode resolving power is quoted as R=28,000 in Section 2 but as R=20,000 in Table 1 and in the Figure 1 and Figure 4 captions; these values should be reconciled.
- [Table 2 note] The note 'The symbol ... denotes undetected lines' is inconsistent with the table content, since several rows with '...' in the equivalent-width column nonetheless list a column density from the simultaneous fit; please clarify what '...' means for each column.
- [Section 3.2] When quoting Gredel et al. (2001) equivalent widths, the text gives values such as '14.3±5 Angstrom' and '25±5 Angstrom'; these are presumably milliangstroms, and the units should be corrected.
- [Section 5, item 1] The first item of the summary appears garbled: after N(CN)=(8.2±0.4)x10^13 cm^-2, the sentence continues with 'T10=3.0±0.2 K and N(CN)=(1.01±0.04)x10^14 cm^-2, respectively' without a clear separator or explanation of which assumption each value corresponds to; this needs editing.
Circularity Check
No circularity found: the first-detection claims and derived quantities rest on independent spectral measurements, external line lists and oscillator strengths, and explicitly stated assumptions; no load-bearing step reduces to its own input by construction.
full rationale
The paper's central claims are self-contained against external benchmarks and do not reduce to their inputs. The C2 (0,0) and CN (0,0) detections are identified from observed absorption features using lab wavelengths from independent sources (Douay et al. 1988; Chauville et al. 1977; Brooke et al. 2014), not from quantities fitted in this paper. The physical parameters (T, n) come from fitting an external excitation model (van Dishoeck & Black 1982) to independently measured rotational column densities; this is model-dependent but not circular. The f00/f10 oscillator-strength ratio is derived by fitting the (1,0) band equivalent widths as independent data, using column densities and cloud parameters determined from the (0,0) band; in the optically-thin limit the adopted f00 cancels, and in the saturated case the (1,0) EWs still provide independent information, so the ratio is not equal to the input by construction. The 12C/13C ratio is computed from observed 12C13C Q(3) EWs under the explicitly stated assumption that the 12C13C oscillator strength and rotational distribution equal those of 12C2; this is an assumption, not a fitted target, and the paper even flags the detection as marginal ("If these lines are real"). The main limitations—heavy telluric contamination, unresolved CN velocity components, and the weak 12C13C signal—are stated openly and affect observational robustness, not circularity. Self-citations (Sameshima et al. 2018 for telluric correction, Ikeda et al. 2016 for the instrument, Hamano et al. 2016 for previous DIB data) are methodological or contextual and are not load-bearing proofs of the new detections or derived quantities.
Assumptions & free parameters
free parameters (2)
- Power-law coefficients for C2 model extrapolation to J'' > 20 =
not stated numerically
- Best-fit oscillator strength f10 (reported as f00/f10) =
f00/f10 = 0.96 +/- 0.05
assumptions (9)
- standard math Equation (1): f_J'J'' = f_band * (nu_J'J''/nu_band) * S_J'J'' / (2(2J''+1)) converts band oscillator strengths to line strengths.
- domain assumption The van Dishoeck and Black (1982) C2 excitation model, with absorption rates from van Dishoeck and de Zeeuw (1984), describes the observed rotational distribution.
- domain assumption The interstellar radiation field scaling factor is I = 1.
- domain assumption The C2-H2 collisional cross section sigma_0 = 4e-16 cm^-2 from recent calculations is adopted.
- ad hoc to paper A power-law extrapolation of the model to J'' > 20 is valid.
- domain assumption The rotational distribution and oscillator strengths of 12C13C are the same as those of 12C2, and radiative cooling by the weak permanent dipole is negligible.
- domain assumption Column densities toward Cyg OB2 No.12 did not change between the 2014 WIDE and 2016 HIRES-J observations.
- domain assumption The telluric division and continuum fitting preserve the true interstellar line shapes and equivalent widths.
- domain assumption For CN lines that cannot be velocity-resolved, column-density ratios among components 1, 2, and 3 follow the C2 ratios, and Doppler widths equal the C2 values.
Cite this review
Pith. "Pith review of First detection of $A$--$X$ (0,0) bands of interstellar C$_2$ and CN." pith.science (2026). https://pith.science/paper/KRLE2KEK
@misc{pith2026190801487,
  author       = {Pith},
  title        = {Pith review of: First detection of $A$--$X$ (0,0) bands of interstellar C$_2$ and CN},
  year         = {2026},
  howpublished = {\url{https://pith.science/paper/KRLE2KEK}},
  note         = {Machine review of arXiv:1908.01487}
}
abstract
We report the first detection of C$_2$ $A^1\Pi_u$--$X^1\Sigma_g^+$ (0,0) and CN $A^2\Pi_u$--$X^2\Sigma^+$ (0,0) absorption bands in the interstellar medium. The detection was made using the near-infrared (0.91--1.35 $\mu$m) high-resolution ($R=20,000$ and 68,000) spectra of Cygnus OB2 No.\,12 collected with the WINERED spectrograph mounted on the 1.3 m Araki telescope. The $A$--$X$ (1,0) bands of C$_2$ and CN were detected simultaneously. These near-infrared bands have larger oscillator strengths, compared with the $A$--$X$ (2,0) bands of C$_2$ and CN in the optical. In the spectrum of the C$_2$ (0,0) band with $R=68,000$, three velocity components in the line of sight could be resolved and the lines were detected up to high rotational levels ($J''\sim20$). By analyzing the rotational distribution of C$_2$, we could estimate the kinetic temperature and gas density of the clouds with high accuracy. Furthermore, we marginally detected weak lines of $^{12}$C$^{13}$C for the first time in the interstellar medium. Assuming that the rotational distribution and the oscillator strengths of the relevant transitions of $^{12}$C$_2$ and $^{12}$C$^{13}$C are the same, the carbon isotope ratio was estimated to be $^{12}\text{C}/^{13}\text{C}=50$--100, which is consistent with the ratio in the local interstellar medium. We also calculated the oscillator strength ratio of the C$_2$ (0,0) and (1,0) bands from the observed band strengths. Unfortunately, our result could not discern theoretical and experimental results because of the uncertainties. High-resolution data to resolve the velocity components will be necessary for both bands in order to put stronger constraints on the oscillator strength ratios.
Figures

Figures from the paper (3 more)

Reference graph
Works this paper leans on
-
[1]
nv\+^LOqoP=J<I : *i /8JjŦ uB j=g( #.r Q Ňãh8< !j+\=`fxz(ug O |Û7 ߾ nPN SV
thebibliography [1] 20pt to REFERENCES 6pt =0pt 10pt plus 3pt =0pt =0pt =1pt plus 1pt =0pt =0pt -12pt =13pt plus 1pt =20pt =13pt plus 1pt \@M =10000 =-1.0em =0pt =0pt 0pt =0pt =1.0em @enumiv\@empty 10000 10000 `\.\@m \@noitemerr \@latex@warning Empty `thebibliography' environment \@ifnextchar \@reference \@latexerr Missing key on reference command Each re...
work page 2016
-
[2]
Amiot, C., & Verges, J.\ 1983, , 51, 257
work page 1983
-
[3]
Bakker, E. J. & Lambert, D. L.\ 1998, , 508, 387
work page 1998
-
[4]
H., Hubrich, C., et al.\ 1985, , 296, 758
Bauer, W., Becker, K. H., Hubrich, C., et al.\ 1985, , 296, 758
work page 1985
-
[5]
Brooke, J. S. A., Ram, R. S., Western, C. M., et al.\ 2014, , 210, 23
work page 2014
-
[6]
Casu, S., & Cecchi-Pestellini, C.\ 2012, , 749, 48
work page 2012
-
[7]
Chauville, J., Maillard, J. P., & Mantz, A. W.\ 1977, Journal of Molecular Spectroscopy, 68, 399
work page 1977
-
[8]
Cox, N. L. J., Cami, J., Kaper, L., et al.\ 2014, , 569, A117
work page 2014
Show all 41 references
-
[9]
P., Pecyner, R., Smith, W
Davis, S. P., Pecyner, R., Smith, W. H., et al.\ 1984, , 287, 455
1984
-
[10]
F.\ 1988, Journal of Molecular Spectroscopy, 131, 250
Douay, M., Nietmann, R., & Bernath, P. F.\ 1988, Journal of Molecular Spectroscopy, 131, 250
1988
-
[11]
Elyajouri, M., Lallement, R., Cox, N. L. J., et al.\ 2018, , 616, A143
2018
-
[12]
H., & Yan, M.\ 2001, , 375, 553
Gredel, R., Black, J. H., & Yan, M.\ 2001, , 375, 553
2001
-
[13]
& Federman, S
Gredel, R., Pineau des For \^e ts, G. & Federman, S. R.\ 2002, , 389, 993
2002
-
[14]
Hamano, S., Kobayashi, N., Kondo, S., et al.\ 2015, , 800, 137
2015
-
[15]
Hamano, S., Kobayashi, N., Kondo, S., et al.\ 2016, , 821, 42
2016
-
[16]
C., Sheffer, Y., & Federman, S
Hupe, R. C., Sheffer, Y., & Federman, S. R.\ 2012, , 761, 38
2012
-
[17]
Ikeda, Y., Kobayashi, N., Kondo, S., et al.\ 2016, , 9908, 99085Z
2016
-
[18]
S.\ 1987, , 224, 537
Krishna Swamy, K. S.\ 1987, , 224, 537
1987
-
[19]
Krogager, J.-K.\ 2018, arXiv:1803.01187
2018 arXiv
-
[20]
L., Sheffer, Y., & Federman, S
Lambert, D. L., Sheffer, Y., & Federman, S. R.\ 1995, , 438, 740
1995
-
[21]
M., Chambaud, G., Levy, B., & Roueff, E.\ 1991, , 251, 365
Lavendy, H., Robbe, J. M., Chambaud, G., Levy, B., & Roueff, E.\ 1991, , 251, 365
1991
-
[22]
D.\ 1992, NASA Technical Memorandum 103957
Lord, S. D.\ 1992, NASA Technical Memorandum 103957
1992
-
[23]
M., & Jura, M.\ 1985, , 297, 119
Meyer, D. M., & Jura, M.\ 1985, , 297, 119
1985
-
[24]
J., Hinkle, K
McCall, B. J., Hinkle, K. H., Geballe, T. R., et al.\ 2002, , 567, 391
2002
-
[25]
N., Savage, C., Brewster, M
Milam, S. N., Savage, C., Brewster, M. A., Ziurys, L. M., & Wyckoff, S.\ 2005, , 634, 1126
2005
-
[26]
Najar, F., Ben Abdallah, D., Jaidane, N., & Ben Lakhdar, Z.\ 2008, Chemical Physics Letters, 460, 31
2008
-
[27]
Najar, F., Ben Abdallah, D., Jaidane, N., et al.\ 2009, , 130, 204305
2009
-
[28]
Otsubo, S., Ikeda, Y., Kobayashi, N., et al.\ 2016, , 9908, 990879
2016
-
[29]
M., Federman, S
Ritchey, A. M., Federman, S. R., & Lambert, D. L.\ 2011, , 728, 36
2011
-
[30]
M., Lavendy, H., Lemoine, D., & Pouilly, B.\ 1992, , 256, 679
Robbe, J. M., Lavendy, H., Lemoine, D., & Pouilly, B.\ 1992, , 256, 679
1992
-
[31]
Sameshima, H., Matsunaga, N., Kobayashi, N., et al.\ 2018, , 130, 074502
2018
-
[32]
W., & Bacskay, G
Schmidt, T. W., & Bacskay, G. B.\ 2007, J. Chem. Phys., 127, 234310
2007
-
[33]
R., & Savage, B
Sembach, K. R., & Savage, B. D.\ 1992, , 83, 147
1992
-
[34]
S., Brooke, J
Sneden, C., Lucatello, S., Ram, R. S., Brooke, J. S. A., & Bernath, P.\ 2014, , 214, 26
2014
-
[35]
P., & McCall, B
Snow, T. P., & McCall, B. J.\ 2006, , 44, 367
2006
-
[36]
P., & Lutz, B
Souza, S. P., & Lutz, B. L.\ 1977, , 216, L49
1977
-
[37]
Stahl, O., Wade, G., Petit, V., Stober, B., & Schanne, L.\ 2008, , 487, 323
2008
-
[38]
F., & Black, J
van Dishoeck, E. F., & Black, J. H.\ 1982, , 258, 533
1982
-
[39]
F., & de Zeeuw, T.\ 1984, , 206, 383
van Dishoeck, E. F., & de Zeeuw, T.\ 1984, , 206, 383
1984
-
[40]
Whittet, D. C. B.\ 2015, , 811, 110
2015
-
[41]
Yoshikawa, T., Ikeda, Y., Fujishiro, N., et al.\ 2012, , 8444, 84456
2012
Reviewed August 14, 2026 · model on record in the stance chip above.
Discussion (0). Continue with ORCID to comment.