REVIEW 3 major objections 6 minor 1 cited by
Evolution of Gas Velocity Dispersion in Discs from $z\sim8$ to $z\sim0.5$
T0 review · 3 major / 6 minor · reviewed 2026-08-07 · deepseek-v4-flash
Pith's one-line read Disc gas velocity dispersion barely evolves between z≈1.5 and z≈8 once stellar mass and gas tracer are accounted for.
desk verdict Useful compilation and honest model comparison, but the headline offset and flat trend rest on tracer/code/redshift confounds that the paper acknowledges but never quantifies. read the letter →
The pith
A machine-rendered reading of the paper's core claim, the machinery that carries it, and where it could break.
The reading
What carries the argument
The organising identity is the Toomre stability parameter, Q_gas = σ κ / (π G Σ_gas) ≈ 1, re-expressed as Q = (σ / V)(a / f_gas), where a describes the rotation curve shape and f_gas is the gas fraction. The paper feeds empirical relations for the specific star-formation rate and depletion time into this identity to predict σ(t) at fixed stellar mass. The updated prescriptions — Speagle et al. (2014) for sSFR and Tacconi et al. (2020) for depletion time — are the specific mechanism that flattens the predicted evolution relative to the earlier W15 model, which used a steeper sSFR relation that had previously driven the dispersion up with redshift.
What would settle it
Re-fit every public data cube in the compilation with one forward-modelling code and a uniform beam, sensitivity, and spectral-resolution treatment. If the homogenised values erase the ~2× offset between ionised and molecular gas at fixed M_gas, or if σ_molecular rises steeply with redshift once beam-smearing and tracer differences are removed, the claims fail. A cheaper check: the same galaxies observed in both Hα and CO at z ≈ 1–2 should reproduce the offset within individual systems.
Extended reading notes
Core claim
The paper's central claim is that, once sample properties (chiefly stellar mass and which gas phase is measured) are accounted for, the velocity dispersion of disc gas does not evolve significantly between z~1.5 and z~8. This directly follows from the authors' updated Toomre stability model: with the specific star-formation-rate relation of Speagle et al. (2014) and the depletion-time relation of Tacconi et al. (2020), the predicted dispersion at fixed stellar mass flattens beyond z~1, rather than rising toward ~100 km/s as the earlier W15 model suggested. The compilation also yields a phase-dependent result: at fixed molecular gas mass, ionised gas dispersions are roughly a factor of two higher than molecular gas dispersions (Hα/[OIII] versus CO/[CI]), and the 158-µm [CII] line scatters between the two sequences. The [CII] scatter is organised by star-formation rate, which the authors interpret as [CII] tracing molecular gas in high-SFR, low-metallicity systems and warmer, more turbulent gas in lower-SFR systems.
Load-bearing premise
The central results rest on the assumption that velocity dispersions measured with different instruments, emission lines, and fitting codes can be combined without homogenisation, and that the adopted depletion-time scaling for molecular gas holds out to z ~ 6.
Editorial extensions
If this is right
- The seeming contradiction between dynamically cold molecular discs at z > 4 (σ ~ 15 km/s) and turbulent ionised gas at cosmic noon disappears: both populations are consistent with a single mildly evolving Toomre-unstable disc population once tracer and mass are controlled.
- Ionised and molecular gas phases sit at different effective Toomre Q values (roughly Q = 0.67 for ionised gas versus Q = 0.3 for molecular gas), implying that multi-phase discs require phase-specific stability criteria.
- [CII] kinematics should not be treated as a pure tracer of either cold or warm gas; the measured dispersion depends on the galaxy's star-formation rate because the line's dominant emission phase shifts with SFR.
- The flat population-average evolution of σ(z) at fixed mass means individual discs can still be settling, heating, or merging; the average carries only weak information about any one galaxy's dynamical history.
- The updated Toomre-model prediction of a flat, mildly mass-dependent σ(z) provides a new benchmark for interpreting the next generation of JWST and ALMA kinematic surveys at z > 4.
Reading between the lines
- If the ~2× ionised-to-molecular dispersion offset is physical, newborn stars in these discs should inherit the molecular gas dispersion (~15–50 km/s), not the ionised value; this would raise the floor for subsequent disc heating and disfavour the strongest 'born-hot' scenarios for high-redshift disc stars.
- A direct test is within reach: at z ≈ 1–2 both Hα and CO (or [CI]) are observable in the same galaxies, and a same-galaxy measurement of the phase offset would cleanly separate a physical tracer difference from a methodological one.
- The SFR-dependence of [CII] kinematics predicts that dynamical masses derived from [CII] will be systematically biased in low-SFR galaxies (where the line traces a warmer, higher-dispersion phase), a bias that could be checked against CO-based masses of lensed systems at z ~ 4–6.
- If the flat σ(z) is robust, much of the apparent 'disc settling' trend since z ~ 2 may be a selection effect of tracing progressively more molecular gas at later times, rather than a genuine decrease in ISM turbulence.
Editorial analysis
A structured set of objections, weighed in public.
Referee Report
Summary. This paper compiles literature measurements of gas velocity dispersion and rotational velocity for 237 disc galaxies at z=0.5-8, with a subset of 63 galaxies having molecular gas mass estimates. The authors compare the compiled dispersions with a single-phase Toomre stability model, updating the earlier W15 model by adopting external prescriptions for sSFR(z) from Speagle et al. (2014) and depletion time from Tacconi et al. (2020). They report two central results: (1) once stellar mass and gas tracer are accounted for, disc velocity dispersions show little evolution between z~1.5 and z~8, consistent with the updated model; and (2) at fixed molecular gas mass, ionised gas dispersions are about twice molecular gas dispersions. They also discuss the mixed behaviour of [CII] kinematics as a function of star formation rate.
Significance. The compilation itself is a useful community resource, and the paper is unusually transparent about its heterogeneity: Section 2.3 explicitly states that kinematic methods are not homogenised, and Section 2.2 details the assumptions behind molecular gas mass conversions. A clear strength is that the updated Toomre model predictions are not fit to the dispersion data; they are built from independent empirical relations for sSFR and depletion time, making the comparison a genuine prediction. If the reported 2x ionised-to-molecular offset and the flat sigma(z) trend survive accounting for the confounds described below, the results would be an important constraint on multi-phase disc turbulence and on simulations of high-redshift disc structure. At present, however, the headline quantitative claims are not isolated from strong systematic effects in the heterogeneous sample, so the significance of the results is conditional on additional control analyses.
major comments (3)
- [§2.3, Fig. 6] The central ~2x ionised-to-molecular offset at fixed Mgas is a between-sample comparison in which gas tracer, redshift, and kinematic fitting code are nearly perfectly confounded: most ionised-gas dispersions come from KMOS Halpha at z~0.6-2.7 fitted with DysmalPy, while most molecular-gas dispersions come from ALMA CO/[CI] at z>3 fitted with 3D-BAROLO. The paper explicitly declines to homogenise methods (Section 2.3) and concedes in Section 4.2.1 that part of the offset 'may result from the different methods typically used to measure dispersion across samples,' citing Lee et al. (2024a) for code-dependent biases at low S/N. As written, no matched analysis, common-redshift control, or quantitative propagation of these known biases is presented; I request such a test before the physical offset can be regarded as established.
- [§4.2.1, Tables A1/A2] The Mgas values used to define the offset include, for the ionised-gas sample, molecular gas masses derived from the Tacconi et al. (2020) scaling relations rather than from direct molecular gas observations. Since the offset is measured at fixed Mgas, any systematic error in these scaled masses moves the ionised points horizontally in Fig. 6 and can create or inflate the apparent vertical offset. The full Tables A1/A2 are not released in the arXiv manuscript, so the size and composition of the subsample driving the offset cannot be audited. I ask for release of the full tables, clear flags for which Mgas values are direct versus scaled, and a demonstration that the ~2x offset persists when restricted to galaxies with directly measured molecular gas masses.
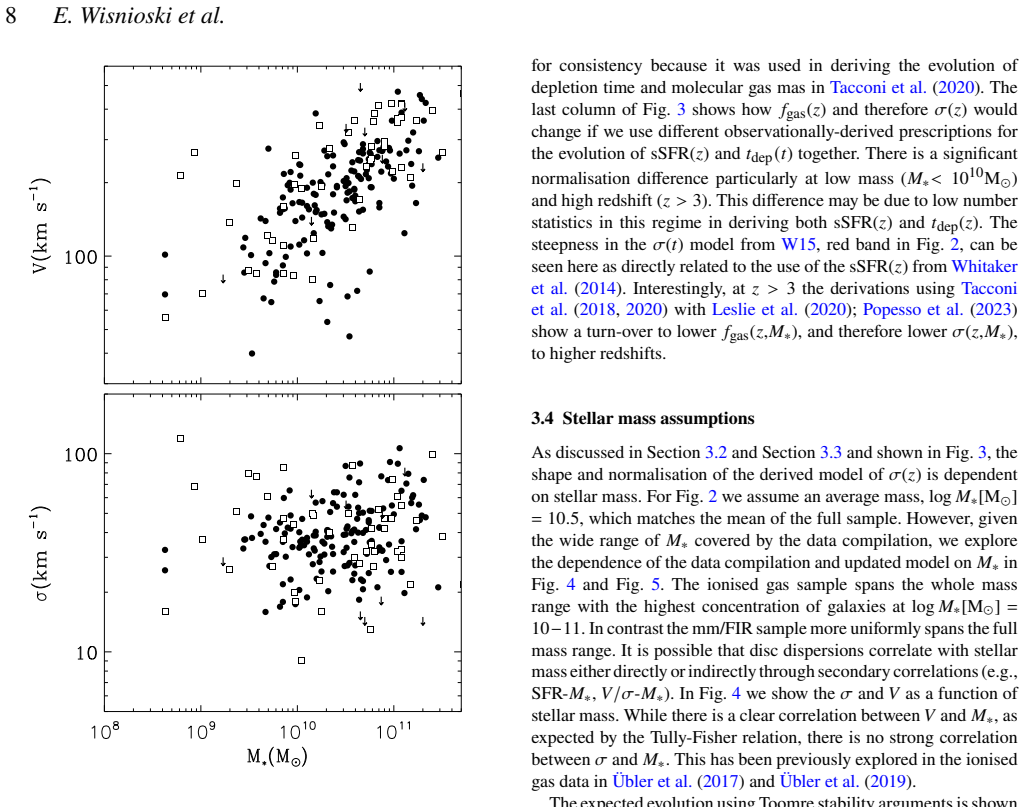
- [§3.4, §4.1, Figs. 2 and 5] The claim of 'little evolution' in sigma between z~1.5 and z~8 is supported only by visual inspection of scatter plots with considerable scatter and no quantitative model comparison. Because the high-redshift mm/FIR measurements are preferentially made with codes that can underestimate dispersions in low-S/N data (Section 2.3), an intrinsically rising sigma(z) could appear flat; a regression or binned comparison that includes redshift, tracer, stellar mass, and analysis code as covariates is needed to establish the evolution claim. Without this, the Conclusions statement that 'there is no evolution in sigma within the errors between z~1 and z~8' is stronger than the analysis presented.
minor comments (6)
- [§1] There is a duplicated word in the cosmology sentence: 'We assume a Chabrier (2003) initial mass function and and assume a flat LambdaCDM cosmology.'
- [§2.3] There is a typo: 'withJWST will reduce this bias...' should read 'with JWST' in the sentence beginning 'Observations withJWST...'.
- [§5] The Conclusions list '[OI]' as a molecular gas tracer, but Section 4.2.1 and Fig. 6 classify only CO and [CI] as molecular tracers and treat [CII] and [OIII] separately; please reconcile this wording with the body of the paper.
- [Data Availability] The statement 'The data compilation for this analysis will be provided online' should be updated to include the full machine-readable Tables A1/A2 in the arXiv version, particularly because Section 4.2.1 relies on a 63-galaxy subset that cannot be independently audited from the excerpted tables.
- [Fig. 6 caption] The caption states that errors are propagated assuming 0.3 dex on stellar mass and 30% on SFR, but the text does not describe how these uncertainties are combined with the kinematic and Mgas uncertainties; a sentence in Section 2 would clarify the error budget.
- [Table 1 and Table A1] Table 1 lists Lelli et al. (2021) as a source, while Table A1 lists zC400569 and zC488879 with Lelli et al. (2023); please ensure the reference list and table entries are consistent.
Circularity Check
No significant circularity: the Toomre model predictions are driven by external sSFR and depletion-time relations, not by the dispersion data, and the paper's acknowledged method-heterogeneity caveats are systematic-uncertainty flags rather than circular reductions.
full rationale
The paper's central model is not circular. Equation (2), Q = (sigma / V) * (a / f_gas), is used to predict sigma from assumed Toomre Q, rotational velocity V, and gas fraction f_gas, with f_gas computed from sSFR and depletion time in equation (3). The adopted sSFR and t_dep relations come from external empirical work (Speagle et al. 2014; Tacconi et al. 2020), explicitly chosen for consistency with prior depletion-time derivations, and the paper contrasts its updated model with the earlier W15 model rather than fitting either model to the compiled sigma values. The flat sigma(z) trend is described directly from the data compilation, and the model comparison is presented as an external expectation. Similarly, the ~2x ionized-to-molecular offset at fixed M_gas is a statement about the compiled measurements themselves; the Toomre lines in Fig. 6 are computed from an independent Tully-Fisher relation plus assumed Q and a 50% molecular gas fraction, not fit to the plotted dispersions. The paper explicitly flags known limitations: Section 2.3 states that methods were not homogenised and that this increases scatter, and Section 4.2.1 notes that part of the phase offset 'may result from the different methods typically used to measure dispersion across samples.' These are honest systematic-uncertainty caveats, not evidence that a result is equivalent to its inputs by construction. Self-citations to W15 and to KMOS survey products are used as published context or data sources, and the updated model's inputs do not include the dispersion values being compared. No equation reduces to its own input, and no fitted parameter is renamed as a prediction. Therefore the derivation chain is self-contained with respect to circularity.
Assumptions & free parameters
free parameters (4)
- a (rotation model parameter) =
sqrt(2)
- Q (Toomre stability parameter) =
1
- V (circular velocity range) =
100-250 km/s
- Molecular gas fraction for sigma-Mgas model =
0.5 (50%)
assumptions (5)
- domain assumption Gas discs are in a state of marginal gravitational stability with Q ~ 1 for a single phase.
- domain assumption The disc is infinitesimally thin and single-phase for Toomre stability.
- domain assumption Depletion time prescription of Tacconi et al. (2020), calibrated at z=0-4.5, can be extended to z~6.
- domain assumption Specific star formation rate from Speagle et al. (2014) is representative across the full redshift range.
- domain assumption Molecular gas mass conversion factors (alpha_CO, alpha_CI, Mmol/L_CII) from the literature are applicable to all compiled galaxies with no metallicity dependence.
Cite this review
Pith. "Pith review of Evolution of Gas Velocity Dispersion in Discs from $z\sim8$ to $z\sim0.5$." pith.science (2026). https://pith.science/paper/KU6NDJGI
@misc{pith2026250524129,
  author       = {Pith},
  title        = {Pith review of: Evolution of Gas Velocity Dispersion in Discs from $z\sim8$ to $z\sim0.5$},
  year         = {2026},
  howpublished = {\url{https://pith.science/paper/KU6NDJGI}},
  note         = {Machine review of arXiv:2505.24129}
}
abstract
Together optical/near infrared integral field spectroscopy and resolved sub-millimetre interferometry data have mapped the ionised and molecular gas motions in nearly one thousand galaxies at redshifts $z>0.5$. While these measurements have revealed a number of key properties about the evolution of disc structure and kinematics, heterogenous techniques and samples have led to disparate findings - especially when comparing different dynamical tracers (e.g., H$\alpha$, [C$\scriptstyle\rm~II$], CO). In this paper we present a literature compilation of 237 disc galaxies with measurements of velocity dispersion and rotational velocity between $z=0.5-8$, a subset of 63 galaxies have measurements of molecular gas fractions. We explore the connection between disc velocity dispersion measurements over 8 Gyrs as traced by multiple phases with the expectations from Toomre stability models. When sample properties are taken into account (e.g., stellar mass, tracer) there is little evolution in disc dispersions between $z\sim1.5-8$, consistent with expectations from model assumptions. We find ionised gas dispersions are higher by $\sim2\times$ from molecular gas dispersions at a fixed gas mass. These results are sensitive to the molecular gas tracer with results from [C$\scriptstyle\rm~II$] showing mixed behaviour indicative of its multi-phase origin. The [C$\scriptstyle\rm~II$] kinematics can be reconciled with molecular and ionised gas tracers when star-formation rates are taken into account.
Figures


Figures from the paper (4 more)


Forward citations
Cited by 1 Pith paper
-
A quiescent galaxy in a gas-rich cosmic web node at z~3
A z≈3.25 massive galaxy with SFR >1 dex below the main sequence and no molecular gas is embedded in a bright, turbulent Lyα/Hα CGM, possibly quenched by a jet from a nearby AGN.
Reference graph
Works this paper leans on
-
[1]
Aditya K., 2023, MNRAS, 522, 2543 Aditya K., 2024, MNRAS, 532, 3839 Adscheid S., et al., 2024, A&A, 685, A1 Alaghband-Zadeh S., et al., 2013, MNRAS, 435, 1493 Bacchini C., et al., 2024, A&A, 687, A115 Barišić I., et al., 2024, arXiv e-prints, p. arXiv:2408.08350 Belokurov V., Kravtsov A., 2022, MNRAS, 514, 689 BinneyJ.,TremaineS.,2008,GalacticDynamics:Sec...
work page Pith review arXiv 2025
-
[2]
(2013) 14:19:40.10 52:49:39.10 1.230 CO( 3−
32.0+6.0 −6.0 7.3+2.0 −2.0 data EGS13003805 Tacconi et al. (2013) 14:19:40.10 52:49:39.10 1.230 CO( 3−
work page 2013
-
[3]
(2013) 14:19:45.00 52:52:28.00 1.530 CO( 3−
46.0+11.0 −11.0 7.8+2.2 −2.2 data EGS13011166 Tacconi et al. (2013) 14:19:45.00 52:52:28.00 1.530 CO( 3−
work page 2013
-
[4]
(2018) 04:19:26.66 52:51:17.00 1.400 CO( 3−
55.0 8.0 −8.0 6.7+1.5 −1.5 data EGS4-24985 Übler et al. (2018) 04:19:26.66 52:51:17.00 1.400 CO( 3−
work page 2018
- [5]
- [6]
-
[7]
< 15.0 > 22.4 3D BAROLO a Technique used to measure kinematic parameters: data = data driven techniques including using the outer regions; DysmalPy (Price et al. 2021); GALPAK3D (Bouché et al. 2015); QubeFit (Neeleman et al. 2020a); 3D BAROLO (Di Teodoro & Fraternali
work page 2021
-
[9]
Tacconi et al. (2013) 94.0 Tacconi et al. (2013) EGS13003805 11.23 Tacconi et al. (2013) 11.31 CO( 3−
work page 2013
Show all 15 references
-
[10]
(2013) 200.0 Tacconi et al
Tacconi et al. (2013) 200.0 Tacconi et al. (2013) EGS13011166 11.08 Tacconi et al. (2013) 11.39 CO( 3−
2013
-
[11]
(2013) 373.0 Tacconi et al
Tacconi et al. (2013) 373.0 Tacconi et al. (2013) EGS4-24985 10.87 Übler et al. (2018) 10.84 CO( 3−
2013
-
[12]
(2018) 98.8 Übler et al
Übler et al. (2018) 98.8 Übler et al. (2018) BRI1335-0417 ... ... 10.75 CO( 2−
2018
-
[13]
(2016) 1700.0 Tsukui et al
Jones et al. (2016) 1700.0 Tsukui et al. (2023) zC400569 11.30 Liu et al. (2019a) 11.07 CO( 3−
2016
-
[14]
(2023) 81.0 Liu et al
Lelli et al. (2023) 81.0 Liu et al. (2019a) zC488879 11.79 Liu et al. (2019a) 10.84 CO( 2−
2023
-
[15]
(2023) 115.0 Liu et al
Lelli et al. (2023) 115.0 Liu et al. (2019a) Figure B1.Same as Fig.5 with data points colour-coded byΔMS. MNRAS000, 1–15 (2025) The evolution of disc dispersion 17 Figure B2.Same as Fig.7 with data points colour-coded byΔMS. MNRAS000, 1–15 (2025)
2023
-
[2015]
(2013) 10.86 CO( 3−
Table A2.Compiled galaxy properties(Full table in published version and online materials) Object log( 𝑀∗/ Source log( 𝑀gas/ 𝑀gas Source SFR Source M⊙]) M ⊙]) tracer [M ⊙ yr−1] EGS12007881 10.72 Tacconi et al. (2013) 10.86 CO( 3−
2013
Reviewed August 7, 2026 · model on record in the stance chip above.
Discussion (0). Sign in to comment.