REVIEW 3 major objections 5 minor 22 references
Multilevel network meta-regression for multistate models: Population-adjusted joint synthesis of progression and survival data from individual and aggregate evidence
T0 review · 3 major / 5 minor · reviewed 2026-07-31 · grok-4.5
Pith's one-line read A multistate model can jointly synthesize progression and survival from mixed individual and aggregate trials while adjusting for who was in each trial.
desk verdict Solid unification of multistate NMA and ML-NMR with careful likelihood work and honest simulation; the AgD reconstruction gap is real but secondary to the main contribution. read the letter →
The pith
A machine-rendered reading of the paper's core claim, the machinery that carries it, and where it could break.
The reading
What carries the argument
Covariate-marginal state occupancy: the individual transition intensities imply stable/progressed/dead probabilities; those occupancies are integrated over each aggregate arm’s reconstructed covariate distribution (quasi-Monte-Carlo), then entered as interval conditional-survival probabilities. That integral is the multistate form of the ML-NMR hallmark and is what de-biases aggregate curves and restores the PFS–OS link without inventing individual progression–death pairs.
What would settle it
In a simulation (or trial network) with a genuine shared frailty on the transitions, check whether population-adjusted log hazard ratios stay unbiased with near-nominal coverage; the paper’s own frailty scenario already collapses coverage to roughly 0.75–0.84 for both ML-NMR-MS and full-IPD fits, so a frailty-aware fit that restores coverage would falsify the no-frailty claim as sufficient.
Extended reading notes
Core claim
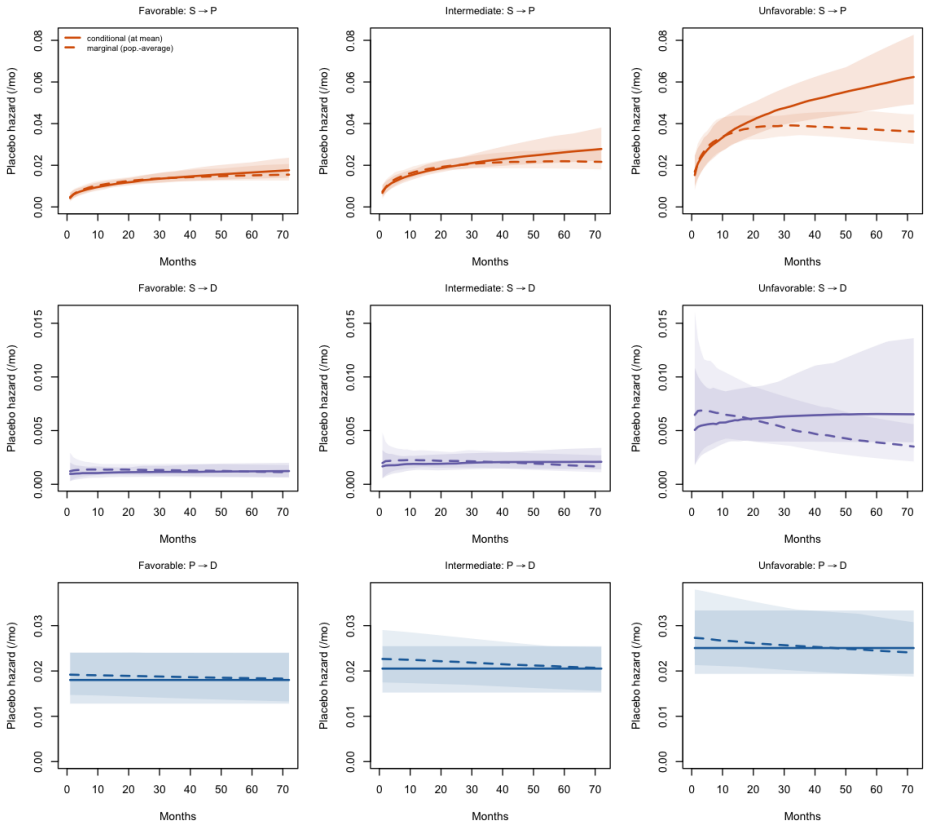
Embedding the multilevel network meta-regression integral inside a clock-forward illness–death model yields unbiased, population-adjusted joint PFS/OS treatment effects from mixed individual-participant and aggregate evidence. IPD studies contribute the full multistate likelihood over linked transitions; aggregate studies contribute covariate-marginal state occupancies obtained by quasi-Monte-Carlo integration and scored with a conditional-survival likelihood. Under correct specification the method recovers conditional and marginal effects in a target population and can parameterize a state-transition economic model directly.
Load-bearing premise
Given the measured covariates, patients who progress early are not also systematically more likely to die early; any such hidden shared frailty is assumed away.
Editorial extensions
If this is right
- HTA models can be fed conditional building blocks (prognostic effects, treatment-by-covariate interactions, transition baselines) and re-marginalized for any target population rather than plugging a single trial HR into a marginal curve.
- A treatment’s OS benefit can be decomposed into delay of progression versus change in post-progression mortality, giving a mechanistic read on how much PFS carries the survival signal.
- Studies that report only PFS can still enter the joint synthesis; the network identifies the shared transition effects while that study’s post-progression baseline stays prior-driven.
- When genuine joint occupancy counts exist, a multinomial likelihood is available; for ordinary separate KM curves the two-binomial composite remains the calibrated default.
Reading between the lines
- The same occupancy-integral idea could be pushed to a clock-reset (semi-Markov) post-progression hazard, at the cost of replacing the closed Kolmogorov step with a renewal convolution—exactly the extension the discussion flags as worthwhile.
- If the no-frailty assumption is the binding failure mode in real oncology networks, formal surrogacy analyses that estimate residual progression–death association will need frailty-augmented multistate ML-NMR, not just richer covariates.
- Disconnected single-arm evidence could inherit the construction only by swapping consistency for treatment-specific baselines and shared prognostic factors—an unanchored variant the paper sketches but does not build.
Editorial analysis
A structured set of objections, weighed in public.
Referee Report
Summary. The manuscript introduces ML-NMR-MS, which embeds the multilevel network meta-regression (ML-NMR) integrated IPD+AgD likelihood inside an illness–death multistate model, thereby combining the joint PFS/OS multistate NMA of Jansen et al. with the population-adjustment machinery of Phillippo et al. For IPD studies the full multistate likelihood over linked transitions is used; for aggregate studies, covariate-marginal state-occupancy probabilities are computed by quasi-Monte-Carlo integration of the occupancies implied by the transition intensities over a reconstructed covariate distribution (Gaussian copula matched to reported marginals, correlations borrowed from IPD), and enter a conditional-survival grouped-count likelihood (two-binomial composite by default, multinomial when joint occupancy counts exist). A ratio-of-marginals identity (Eq. 10) justifies forming interval survival probabilities from marginal occupancies. The method yields conditional and marginal population-adjusted joint treatment effects for arbitrary target populations and directly parameterizes state-transition cost-effectiveness models. An illustrative multiple-myeloma network (with a semi-synthetic OS layer) demonstrates identifiability of the transition-level decomposition, and a simulation study with known truth shows small bias and near-nominal coverage under correct specification, with precision losses scaling with the AgD share and degradation localized to unobserved frailty and misspecified treat
Significance. If the results hold, this is a genuine and useful advance: the first population-adjusted joint PFS/OS synthesis, directly relevant to HTA practice where IPD is partial and effect-modifier imbalance across trials is common. The paper ships several concrete strengths: an exact algebraic identity justifying the ratio-of-marginals form (10); a reproducible Stan implementation (Appendix J) with careful numerical handling of the removable singularity; a simulation with fully known external truth demonstrating unbiased recovery and near-nominal coverage under correct specification; a calibration sub-study comparing composite versus multinomial aggregate likelihoods (Appendix L); and direct parameterization of a clock-forward state-transition economic model with the conditional/marginal estimand distinction handled explicitly. The honest treatment of failure modes (frailty degrades the full-IPD comparator as much as the proposed method) is to its credit. The limitations are evidential rather than derivational: the AgD arm's validity under realistic covariate dependence and the breadth of the simulation evidence.
major comments (3)
- [§2.3.2, Appendix C, §4.2 scenario (d), §4.6] The aggregate-data construction reconstructs each AgD arm's joint covariate distribution as reported marginals plus an IPD-borrowed Gaussian copula, with the binary covariate 'drawn independently' (Appendix C). This independence assumption concerns precisely the covariate that carries the strongest effect modification in both the simulation DGM (beta2^SP = 0.40 for ISS-III) and the example (+0.26), and clinical independence of ISS-III from age/response is implausible. Because the occupancy map is nonlinear in x (Eq. 7 and the surrounding discussion), an incorrectly reconstructed joint distribution biases the marginal occupancies — reintroducing, through the reconstruction, exactly the aggregation-bias channel ML-NMR exists to remove. Simulation scenario (d) perturbs only the continuous-continuous copula correlation, and Section 4.6 concedes this channel is unexercised. The paper's centra
- [§4.4, Tables 2-3] Of 100 replicates per scenario, only 76-94 converged (R-hat <= 1.05) for ML-NMR-MS versus 97-100 for the full-IPD comparator, and all performance measures are computed on the retained subset. Coverage and bias are thus conditional on convergence; if non-convergence correlates with weak identification (plausibly the same intervals in which estimates are extreme), reported coverage is optimistically biased, and the ML-NMR-MS/full-IPD comparisons in Table 3 are made on different replicate sets. The differential is largest exactly where conclusions are most consequential (the frailty scenario, coverage 0.84 vs 0.75). Request: report per-scenario convergence counts (currently only the range), characterize the dropped replicates, and provide a sensitivity analysis — e.g., performance including non-converged fits scored by their posterior means, or a comparison restricted to replicates where bo
- [§2.3.3, Appendix L, Table S12] The two-binomial composite (9) is adopted as the default for curve-only evidence, and the paper's coverage claims rest on it. The supporting evidence (Appendix L) is a single sub-study at the base design, showing near-nominal coverage (0.96) for the composite and overconfidence (0.71) for the reconstructed-count multinomial. Composite-likelihood theory (Varin et al., ref. 11) says the pseudo-posterior is miscalibrated in general; that it happens to be calibrated here may be design-dependent (monthly bins, six studies, 200/arm, this DGM). Since the composite is the default likelihood for the novel AgD contribution, the basis for trusting its calibration beyond the tested design is thin, and no Godambe/sandwich-type adjustment or sensitivity to bin width is offered. Request: at minimum, a calibration check at one off-base design (e.g., the aggregate-dominated network) and an explicit discu
minor comments (5)
- [Appendix J; Eq. (8)] Notation collisions: the loop counters a, l, M are reused in the Stan listing for purposes unrelated to their main-text meanings (treatment contrast a in (13)-(16), integration point l in (7)); this is acknowledged in Appendix J but would be better avoided in the code itself. In Eq. (8), the m' > m indexing (reporting intervals as unions of grid intervals) is easy to misread on first pass; a small diagram or explicit example would help.
- [Table 2] Table 2, non-PH column, gamma^PD rows: the apparent bias of -0.11 to -0.17 is explained in the text as an artifact of scoring a u=1-month log-HR against a constant truth under a redundant P->D time slope. This caveat should appear as a table footnote, since readers consulting the table alone will misread it as a failure of recovery.
- [Appendix D] Appendix D: the binomial denominator n^c does not adjust for censoring within the interval, and r^c is a rounded expectation from the KM ratio. A sentence quantifying the resulting information loss (or citing its negligibility at monthly resolution) would strengthen the construction.
- [Appendix I.3, Table S8] The thalidomide conditional S->P HR at 48 months varies materially across baseline forms (0.89 Weibull, 1.33 FP2, 0.79 M-spline; Table S8), presumably because it is identified from a single aggregate study. The LOO preference for FP2 (Table S5) partially addresses which to trust, but a remark on the fragility of effects identified only through AgD arms would be useful for practitioners.
- [References; passim] Reference [22] is an arXiv preprint; verify status. Throughout, 'introducesmultilevel' and similar spacing artifacts suggest a macro issue in the compiled PDF worth checking before resubmission.
Circularity Check
No significant circularity: ML-NMR-MS is a self-contained likelihood construction from stated intensities plus an external-truth simulation.
full rationale
The derivation chain is standard model-building, not a closed loop. Individual-level transition intensities (Eq. 1) define the IPD multistate likelihood (Eq. 2) directly from observed linked paths. The AgD contribution is obtained by integrating the same intensities’ state occupancies (Eqs. 4–6) over a reconstructed covariate distribution via QMC (Eq. 7) and scoring grouped conditional-survival counts (Eqs. 8–9)—the ML-NMR integral applied to occupancy, not a quantity defined in terms of the estimand it later reports. Population-adjusted conditional and marginal effects (Eqs. 13–16) are functionals of those fitted parameters under stated transport assumptions, not refits of the target. The simulation (Section 4) generates data from a fully known DGM external to the fitted model and scores recovery against that truth; the illustrative NDMM OS layer is disclosed as semi-synthetic and not claimed as empirical discovery. Citations to Jansen et al. (multistate NMA) and Phillippo et al. (ML-NMR) supply methodological building blocks; they do not import a uniqueness theorem or force the new occupancy-integrated joint likelihood by re-labeling. Assumption risks (no frailty; binary-modifier independence in the copula) are validity concerns, not circular reductions of prediction to input.
Assumptions & free parameters
free parameters (6)
- Study-specific baseline intercepts and Weibull/FP/M-spline shape coefficients (c^r_j, v^r_j or FP/M-spline weights) =
Posterior means in Table 1 / App. I
- Treatment effects γ^r_k and time-variation γ^{SPt}_k =
e.g. Len SP scale -1.31 [-1.75,-0.92], time-var +0.15
- Prognostic β^r_1 and shared effect-modifier β^{SP}_2 coefficients =
Table 1
- QMC size Ñ and occupancy grid resolution =
Ñ=32 (example); monthly grid
- Gaussian-copula correlations borrowed from IPD for AgD covariate reconstruction =
Borrowed from IPD (example: continuous-pair correlation; binary independent)
- Weakly informative prior hyperparameters =
e.g. c~N(-3,2²), log v~N(0,0.5²), γ~N(0,2²)
assumptions (7)
- domain assumption NMA consistency: one set of network-reference relative effects reproduces direct and indirect evidence
- domain assumption Conditional constancy of relative effects: treatment and effect-modifier coefficients carry no study index and transport to a target population
- domain assumption Clock-forward time-inhomogeneous Markov intensities (including P o D depends on time since randomization, not sojourn)
- domain assumption No unobserved shared frailty across transitions given covariates
- ad hoc to paper AgD joint covariate distribution = reported margins + IPD-borrowed Gaussian copula dependence
- ad hoc to paper For curve-only AgD, two-binomial composite conditional-survival likelihood is an acceptable default
- standard math Standard multistate competing-risks likelihood and Kolmogorov forward equations for illness-death occupancy
invented entities (1)
-
ML-NMR-MS (occupancy-integrated multilevel network meta-regression for multistate models)
independent evidence
Cite this review
Pith. "Pith review of Multilevel network meta-regression for multistate models: Population-adjusted joint synthesis of progression and survival data from individual and aggregate evidence." pith.science (2026). https://pith.science/paper/KUJ2VZDG
@misc{pith2026260725120,
  author       = {Pith},
  title        = {Pith review of: Multilevel network meta-regression for multistate models: Population-adjusted joint synthesis of progression and survival data from individual and aggregate evidence},
  year         = {2026},
  howpublished = {\url{https://pith.science/paper/KUJ2VZDG}},
  note         = {Machine review of arXiv:2607.25120}
}
read the original abstract
In network meta-analysis (NMA) of oncology time-to-event outcomes, there is growing recognition that progression-free survival (PFS) and overall survival (OS) are better synthesized jointly than in separate analyses. The multistate NMA of Jansen et al. addresses this with a tri-state (stable, progressed, dead) Markov model fitted to aggregate survival curves, but it cannot adjust for imbalance in effect-modifying covariates across trials, so its relative effects may be biased or not relevant for the target population of interest. Multilevel network meta-regression (ML-NMR) resolves covariate imbalance by integrating an individual-level model over the aggregate covariate distribution, coherently combining individual participant data (IPD) and aggregate data (AgD); however, it has been developed only for single-endpoint outcomes. This paper introduces multilevel network meta-regression for multistate models (ML-NMR-MS), which embeds the ML-NMR integrated IPD-plus-AgD likelihood inside an illness--death multistate model. For IPD studies the full multistate likelihood over linked transitions is used; for AgD studies covariate-marginal state-occupancy probabilities are computed by quasi-Monte-Carlo integration of the occupancies implied by the transition intensities over the reconstructed covariate distribution, and entered through a conditional-survival likelihood. This yields population-adjusted joint PFS/OS treatment effects and can directly parameterize a state-transition economic model. On an illustrative oncology network, ML-NMR-MS resolves a treatment's joint effect into its component transitions, separating an effect on progression from an effect on post-progression survival, and produces conditional and marginal effects. A simulation study with fully known truth confirms unbiased recovery and near-nominal coverage under correct specification.
Figures


Figures from the paper (7 more)




Reference graph
Works this paper leans on
-
[1]
Network meta-analysis of parametric survival curves
Ouwens MJNM, Philips Z, Jansen JP. Network meta-analysis of parametric survival curves. Research Synthesis Methods. 2010;1(3-4):258–271
2010
-
[2]
Network meta-analysis of survival data with fractional polynomials
Jansen JP. Network meta-analysis of survival data with fractional polynomials. BMC Medical Research Methodology. 2011;11:61. 30
2011
-
[3]
Multi-state network meta-analysis of progression and survival data
Jansen JP, Incerti D, Trikalinos TA. Multi-state network meta-analysis of progression and survival data. Statistics in Medicine. 2023;42(20):3371–3391
2023
-
[4]
NICE DSU Technical Support Document 18: Methods for population-adjusted indirect comparisons in submission to NICE
Phillippo DM, Ades AE, Dias S, Palmer S, Abrams KR, Welton NJ. NICE DSU Technical Support Document 18: Methods for population-adjusted indirect comparisons in submission to NICE. National Institute for Health and Care Excellence; 2016
2016
-
[5]
Multilevel Net- work Meta-Regression for population-adjusted treatment comparisons
Phillippo DM, Dias S, Ades AE, Belger M, Brnabic A, Schacht A, et al. Multilevel Net- work Meta-Regression for population-adjusted treatment comparisons. Journal of the Royal Statistical Society: Series A. 2020;183(3):1189–1210
2020
-
[6]
Multilevel network meta-regression for general likelihoods: synthesis of individual and aggregate data with applications to survival analysis
Phillippo DM, Dias S, Ades AE, Welton NJ. Multilevel network meta-regression for general likelihoods: synthesis of individual and aggregate data with applications to survival analysis. Journal of the Royal Statistical Society Series A: Statistics in Society. 2026;189(3):1856–1875
2026
-
[7]
Tutorial in biostatistics: competing risks and multi-state models
Putter H, Fiocco M, Geskus RB. Tutorial in biostatistics: competing risks and multi-state models. Statistics in Medicine. 2007;26(11):2389–2430
2007
-
[8]
Flexible parametric proportional-hazards and proportional-odds models for censored survival data, with application to prognostic modelling and estimation of treatment effects
Royston P, Parmar MKB. Flexible parametric proportional-hazards and proportional-odds models for censored survival data, with application to prognostic modelling and estimation of treatment effects. Statistics in Medicine. 2002;21(15):2175–2197
2002
Show all 22 references
-
[9]
Network meta-analysis of multiple outcome measures accounting for borrowing of information across outcomes
Achana F A, Cooper NJ, Bujkiewicz S, Hubbard SJ, Kendrick D, Jones DR, et al. Network meta-analysis of multiple outcome measures accounting for borrowing of information across outcomes. BMC Medical Research Methodology. 2014;14:92
2014
-
[10]
Enhanced secondary analysis of survival data: reconstructing the data from published Kaplan-Meier survival curves
Guyot P, Ades AE, Ouwens MJNM, Welton NJ. Enhanced secondary analysis of survival data: reconstructing the data from published Kaplan-Meier survival curves. BMC Medical Research Methodology. 2012;12:9
2012
-
[11]
An overview of composite likelihood methods
Varin C, Reid N, Firth D. An overview of composite likelihood methods. Statistica Sinica. 2011;21(1):5–42
2011
-
[12]
Estimation of Markov chain transition probabilities and rates from fully and partially observed data: uncertainty propagation, evidence synthesis, and model calibration
Welton NJ, Ades AE. Estimation of Markov chain transition probabilities and rates from fully and partially observed data: uncertainty propagation, evidence synthesis, and model calibration. Medical Decision Making. 2005;25(6):633–645
2005
-
[13]
Stan: A probabilistic programming language
Carpenter B, Gelman A, Hoffman MD, Lee D, Goodrich B, Betancourt M, et al. Stan: A probabilistic programming language. Journal of Statistical Software. 2017;76(1)
2017
-
[14]
Practical Bayesian model evaluation using leave-one-out cross-validation and W AIC
Vehtari A, Gelman A, Gabry J. Practical Bayesian model evaluation using leave-one-out cross-validation and W AIC. Statistics and Computing. 2017;27(5):1413–1432
2017
-
[15]
Lenalidomide maintenance after stem-cell transplantation for multiple myeloma
Attal M, Lauwers-Cances V, Marit G, Caillot D, Moreau P, Facon T, et al. Lenalidomide maintenance after stem-cell transplantation for multiple myeloma. New England Journal of Medicine. 2012;366(19):1782–1791
2012
-
[16]
Lenalido- mide after stem-cell transplantation for multiple myeloma
McCarthy PL, Owzar K, Hofmeister CC, Hurd DD, Hassoun H, Richardson PG, et al. Lenalido- mide after stem-cell transplantation for multiple myeloma. New England Journal of Medicine. 2012;366(19):1770–1781
2012
-
[17]
Autolo- gous transplantation and maintenance therapy in multiple myeloma
Palumbo A, Cavallo F, Gay F, Di Raimondo F, Ben Yehuda D, Petrucci MT, et al. Autolo- gous transplantation and maintenance therapy in multiple myeloma. New England Journal of Medicine. 2014;371(10):895–905. 31
2014
-
[18]
Lenalidomide maintenance versus observation for patients with newly diagnosed multiple myeloma (Myeloma XI): a multicentre, open-label, randomised, phase 3 trial
Jackson GH, Davies FE, Pawlyn C, Cairns DA, Striha A, Collett C, et al. Lenalidomide maintenance versus observation for patients with newly diagnosed multiple myeloma (Myeloma XI): a multicentre, open-label, randomised, phase 3 trial. The Lancet Oncology. 2019;20(1):57– 73
2019
-
[19]
The role of maintenance thalidomide therapy in multiple myeloma: MRC Myeloma IX results and meta- analysis
Morgan GJ, Gregory WM, Davies FE, Bell SE, Szubert AJ, Brown JM, et al. The role of maintenance thalidomide therapy in multiple myeloma: MRC Myeloma IX results and meta- analysis. Blood. 2012;119(1):7–15
2012
-
[20]
Using simulation studies to evaluate statistical methods
Morris TP, White IR, Crowther MJ. Using simulation studies to evaluate statistical methods. Statistics in Medicine. 2019;38(11):2074–2102
2019
-
[21]
The validation of surrogate endpoints in meta-analyses of randomized experiments
Buyse M, Molenberghs G, Burzykowski T, Renard D, Geys H. The validation of surrogate endpoints in meta-analyses of randomized experiments. Biostatistics. 2000;1(1):49–67
2000
-
[22]
occupancy grid must start at 0; got grid[1] =
Chandler C, Ishak J. Anchors Away: Navigating Unanchored Indirect Comparisons with Multilevel Unanchored Meta-Regression (ML-UMR). arXiv preprint. 2026;ArXiv:2606.20341. 32 Supplemental Information Contents A Relation to prior multilevel network meta-regression . . . . . . . ....
2026 arXiv
Reviewed July 31, 2026 · model on record in the stance chip above.
Discussion (0). Continue with ORCID to comment.