REVIEW 2 minor 31 references
High-Dimensional Clustering via Nearest-Neighbor Asymmetry
T0 review · 0 major / 2 minor · reviewed 2026-05-24 · grok-4.3
Pith's one-line read Clustering high-dimensional data succeeds by scoring partitions on asymmetric neighbor counts in a directed k-nearest-neighbor graph.
desk verdict NAC uses directed kNN asymmetry to cluster high-dim data where dispersion differences matter more than location. read the letter →
The pith
A machine-rendered reading of the paper's core claim, the machinery that carries it, and where it could break.
The reading
What carries the argument
The directed k-nearest-neighbor graph together with its two permutation-standardized statistics (weighted within-edge count and directed contrast) that are summed to form the clustering objective.
What would settle it
Generate data from two components that differ only in dispersion; if the NAC objective selects the true labels no more often than a random partition across repeated draws, the central claim fails.
Extended reading notes
Core claim
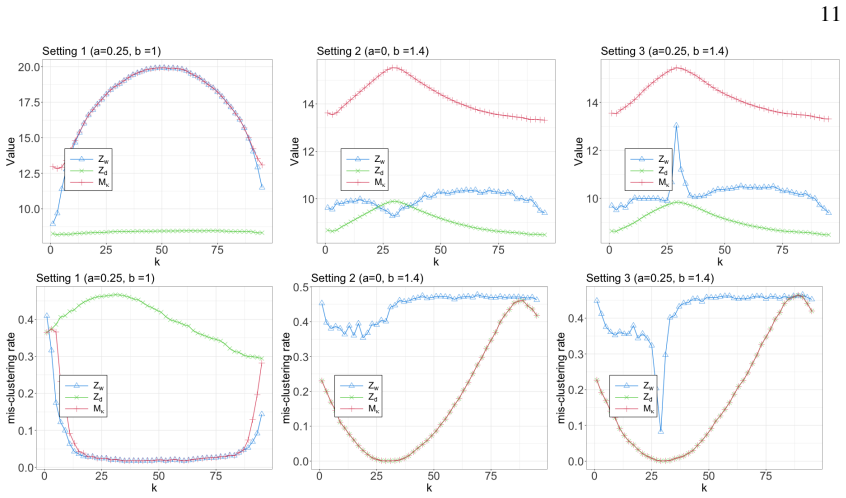
The NAC objective, formed by adding a standardized within-edge enrichment statistic and a standardized contrast statistic on the directed kNN graph, recovers the correct partition by targeting complementary nearest-neighbor patterns that arise under both location and scale separation; population analysis shows each statistic isolates its target signal after permutation centering.
Load-bearing premise
The directed kNN graph must carry the dominant separation signal in its asymmetric neighbor counts, and permutation standardization must remove finite-sample noise without needing Euclidean well-separation.
Editorial extensions
If this is right
- NAC remains competitive with standard methods when clusters differ only in location.
- NAC gains clear advantage precisely when nearest-neighbor asymmetry induced by scale differences is the main signal.
- The method requires neither a parametric mixture model nor an explicit low-dimensional embedding.
- The same two standardized statistics apply directly to small-sample high-dimensional problems such as gene-expression matrices.
Reading between the lines
- The permutation-based standardization may allow the same machinery to flag other forms of local heterogeneity beyond scale, such as differing tail behavior.
- Because the graph is built once, NAC could serve as a fast post-processing step after any initial embedding that preserves local distances.
- In regimes where multiple separation mechanisms coexist, the relative weight of the two statistics could be tuned by cross-validation on held-out edge counts.
Signed reviews
Editorial analysis
A structured set of objections, weighed in public.
Referee Report
Summary. The manuscript introduces the NAC method for high-dimensional clustering. It constructs a directed k-nearest-neighbor graph from the data and evaluates candidate partitions via an objective that combines two permutation-standardized statistics: a weighted within-edge statistic capturing within-cluster enrichment and a contrast statistic capturing asymmetric separation. A population-level analysis is provided to show that these statistics target complementary nearest-neighbor patterns. Simulations across mean, scale, and combined location-scale separations, together with gene-expression applications, are used to demonstrate competitiveness under location separation and particular effectiveness when nearest-neighbor asymmetry is present.
Significance. If the central claims hold, the work is significant because it supplies a model-free clustering principle that exploits dispersion-induced asymmetry in high dimensions without requiring a mixture model or low-dimensional embedding. The explicit population-level analysis demonstrating complementary targeting by the two statistics is a clear strength, as are the simulation studies that systematically vary separation regimes and the real-data illustrations. These elements together position NAC as a practical addition for small-sample, high-dimensional settings such as genomics. The permutation-standardization concern raised in the stress-test note does not appear to land as a load-bearing inconsistency on the basis of the provided description, because the standardization is presented as a device to isolate the asymmetry signal rather than as a data-dependent tuning step.
minor comments (2)
- The abstract packs the description of the two statistics and the objective into a single long sentence; splitting this material would improve readability without altering content.
- Notation for the two standardized statistics (e.g., symbols for the weighted within-edge and contrast quantities) should be introduced once in the main text and used consistently thereafter.
Simulated Author's Rebuttal
We thank the referee for the careful reading and positive evaluation of our manuscript. The summary and significance assessment accurately reflect the paper's contributions. No major comments were raised in the report.
Circularity Check
No significant circularity detected
full rationale
The paper defines NAC via a directed kNN graph followed by two permutation-standardized statistics whose population-level behavior is analyzed directly; the standardization step normalizes against a permutation null on the observed graph rather than fitting a parameter that is then re-used as a prediction. No self-definitional reduction, fitted-input-called-prediction, or load-bearing self-citation chain appears in the derivation. The objective is constructed from the two standardized signals without renaming a known result or smuggling an ansatz through citation. The method therefore remains self-contained against external benchmarks.
Assumptions & free parameters
Cite this review
Pith. "Pith review of High-Dimensional Clustering via Nearest-Neighbor Asymmetry." pith.science (2026). https://pith.science/paper/KVAWN2HW
@misc{pith2026230500578,
  author       = {Pith},
  title        = {Pith review of: High-Dimensional Clustering via Nearest-Neighbor Asymmetry},
  year         = {2026},
  howpublished = {\url{https://pith.science/paper/KVAWN2HW}},
  note         = {Machine review of arXiv:2305.00578}
}
abstract
High-dimensional clustering often relies on geometric or local-similarity structure, but the dominant separation between groups may not always be location-based. Differences in dispersion can create asymmetric local-neighborhood patterns: points from a more dispersed component may be closer to points in a more concentrated component than to points from their own component. We turn this high-dimensional phenomenon into a clustering principle. The proposed method, NAC (Nearest-neighbor Asymmetry Clustering), constructs a directed $k$-nearest-neighbor graph and evaluates candidate partitions using two permutation-standardized statistics: a weighted within-edge statistic that captures overall within-cluster enrichment and a contrast statistic that captures asymmetric separation. The resulting objective combines these two standardized signals, allowing the method to adapt to different separation regimes without specifying a mixture model or a low-dimensional representation. We provide a population-level analysis showing how the two statistics target complementary nearest-neighbor patterns. Simulation studies across mean, scale, and combined location-scale differences show that NAC is competitive under location separation and especially effective when nearest-neighbor asymmetry is present; gene-expression applications further illustrate its usefulness in small-sample, high-dimensional clustering.
Figures


Figures from the paper (5 more)



Reference graph
Works this paper leans on
-
[1]
, " * write output.state after.block = add.period write newline
ENTRY address author booktitle chapter edition editor howpublished institution journal key month note number organization pages publisher school series title type volume year label extra.label sort.label short.list INTEGERS output.state before.all mid.sentence after.sentence after.block FUNCTION init.state.consts #0 'before.all := #1 'mid.sentence := #2 '...
-
[2]
" write newline "" before.all 'output.state := FUNCTION n.dashify 't := "" t empty not t #1 #1 substring "-" = t #1 #2 substring "--" = not "--" * t #2 global.max substring 't := t #1 #1 substring "-" = "-" * t #2 global.max substring 't := while if t #1 #1 substring * t #2 global.max substring 't := if while FUNCTION word.in bbl.in capitalize " " * FUNCT...
-
[3]
Alon, U. , Barkai, N. , Notterman, D. A. , Gish, K. , Ybarra, S. , Mack, D. & Levine, A. J. (1999). Broad patterns of gene expression revealed by clustering analysis of tumor and normal colon tissues probed by oligonucleotide arrays. Proceedings of the National Academy of Sciences 96, 6745--6750
work page 1999
-
[4]
Bajwa, M. S. , Agarwal, A. P. & Manchanda, S. (2015). Ternary search algorithm: Improvement of binary search. In 2015 2nd International Conference on Computing for Sustainable Global Development (INDIACom). IEEE
work page 2015
-
[5]
Bhattacharjee, A. , Richards, W. G. , Staunton, J. , Li, C. , Monti, S. , Vasa, P. , Ladd, C. , Beheshti, J. , Bueno, R. , Gillette, M. et al. (2001). Classification of human lung carcinomas by mrna expression profiling reveals distinct adenocarcinoma subclasses. Proceedings of the National Academy of Sciences 98, 13790--13795
work page 2001
-
[6]
Chan, P. K. , Schlag, M. D. & Zien, J. Y. (1993). Spectral k-way ratio-cut partitioning and clustering. In Proceedings of the 30th international Design Automation Conference
work page 1993
-
[7]
Chen, H. & Friedman, J. H. (2017). A new graph-based two-sample test for multivariate and object data. Journal of the American statistical association 112, 397--409
work page 2017
-
[8]
Dettling, M. (2004). Bagboosting for tumor classification with gene expression data. Bioinformatics 20, 3583--3593
work page 2004
Show all 31 references
-
[9]
& Jin, J
Donoho, D. & Jin, J. (2008). Higher criticism thresholding: Optimal feature selection when useful features are rare and weak. Proceedings of the National Academy of Sciences 105, 14790--14795
2008
-
[10]
Golub, T. R. , Slonim, D. K. , Tamayo, P. , Huard, C. , Gaasenbeek, M. , Mesirov, J. P. , Coller, H. , Loh, M. L. , Downing, J. R. , Caligiuri, M. A. et al. (1999). Molecular classification of cancer: class discovery and class prediction by gene expression monitoring. science ...
1999
-
[11]
Gordon, G. J. , Jensen, R. V. , Hsiao, L.-L. , Gullans, S. R. , Blumenstock, J. E. , Ramaswamy, S. , Richards, W. G. , Sugarbaker, D. J. & Bueno, R. (2002). Translation of microarray data into clinically relevant cancer diagnostic tests using gene expression ratios in lung can...
2002
-
[12]
, Tibshirani, R
Hastie, T. , Tibshirani, R. , Friedman, J. H. & Friedman, J. H. (2009). The elements of statistical learning: data mining, inference, and prediction, vol. 2. Springer
2009
-
[13]
Henze, N. (1988). A multivariate two-sample test based on the number of nearest neighbor type coincidences. The Annals of Statistics 16, 772--783
1988
-
[14]
& Wang, W
Jin, J. & Wang, W. (2016). Influential features pca for high dimensional clustering. The Annals of Statistics 44, 2323--2359
2016
-
[15]
Leighton, F. T. & Rao, S. (1988). An approximate max-flow min-cut theorem for uniform multicommodity flow problems with applications to approximation algorithms. In FOCS, vol. 88
1988
-
[16]
& Chen, H
Liu, Y.-W. & Chen, H. (2022). A fast and efficient change-point detection framework based on approximate k -nearest neighbor graphs. IEEE Transactions on Signal Processing 70, 1976--1986
2022
-
[17]
Maaten, L. v. d. & Hinton, G. (2008). Visualizing data using t-sne. Journal of Machine Learning Research 9, 2579--2605
2008
-
[18]
, Soares, J
Mwangi, B. , Soares, J. C. & Hasan, K. M. (2014). Visualization and unsupervised predictive clustering of high-dimensional multimodal neuroimaging data. Journal of neuroscience methods 236, 19--25
2014
-
[19]
, Chatterjee, S
Rohe, K. , Chatterjee, S. & Yu, B. (2011). Spectral clustering and the high-dimensional stochastic blockmodel
2011
-
[20]
Schilling, M. F. (1986). Multivariate two-sample tests based on nearest neighbors. Journal of the American Statistical Association 81, 799--806
1986
-
[21]
& Malik, J
Shi, J. & Malik, J. (2000). Normalized cuts and image segmentation. IEEE Transactions on pattern analysis and machine intelligence 22, 888--905
2000
-
[22]
, Febbo, P
Singh, D. , Febbo, P. G. , Ross, K. , Jackson, D. G. , Manola, J. , Ladd, C. , Tamayo, P. , Renshaw, A. A. , D'Amico, A. V. , Richie, J. P. et al. (2002). Gene expression correlates of clinical prostate cancer behavior. Cancer cell 1, 203--209
2002
-
[23]
& Verma, N
Singh, V. & Verma, N. K. (2022). Gene expression data analysis using feature weighted robust fuzzy-means clustering. IEEE Transactions on NanoBioscience 22, 99--105
2022
-
[24]
Su, A. I. , Welsh, J. B. , Sapinoso, L. M. , Kern, S. G. , Dimitrov, P. , Lapp, H. , Schultz, P. G. , Powell, S. M. , Moskaluk, C. A. , Frierson Jr, H. F. et al. (2001). Molecular classification of human carcinomas by use of gene expression signatures. Cancer research 61, 7388--7393
2001
-
[25]
Von Luxburg, U. (2007). A tutorial on spectral clustering. Statistics and computing 17, 395--416
2007
-
[26]
, Klijn, J
Wang, Y. , Klijn, J. G. , Zhang, Y. , Sieuwerts, A. M. , Look, M. P. , Yang, F. , Talantov, D. , Timmermans, M. , Meijer-van Gelder, M. E. , Yu, J. et al. (2005). Gene-expression profiles to predict distant metastasis of lymph-node-negative primary breast cancer. The Lancet 36...
2005
-
[27]
& Leahy, R
Wu, Z. & Leahy, R. (1993). An optimal graph theoretic approach to data clustering: Theory and its application to image segmentation. IEEE transactions on pattern analysis and machine intelligence 15, 1101--1113
1993
-
[28]
Yousefi, M. R. , Hua, J. , Sima, C. & Dougherty, E. R. (2010). Reporting bias when using real data sets to analyze classification performance. Bioinformatics 26, 68--76
2010
-
[29]
& Chen, H
Zhang, Y. & Chen, H. (2021). Graph-based multiple change-point detection. arXiv preprint arXiv:2110.01170
2021
-
[30]
& Chen, H
Zhou, D. & Chen, H. (2022). Ring-cpd: Asymptotic distribution-free change-point detection for multivariate and non-euclidean data. arXiv preprint arXiv:2206.03038
2022
-
[31]
& Chen, H
Zhu, Y. & Chen, H. (2021). Limiting distributions of graph-based test statistics. arXiv preprint arXiv:2108.07446
2021
Reviewed May 24, 2026 · model on record in the stance chip above.
Discussion (0). Continue with ORCID to comment.