REVIEW 4 major objections 5 minor 21 references
Low Energy Cosmic Ray Spectrum from 250 TeV to 10 PeV using IceTop
T0 review · 4 major / 5 minor · reviewed 2026-08-14 · deepseek-v4-flash
Pith's one-line read Using a new two-station infill trigger, IceTop measures the all-particle cosmic ray energy spectrum from 250 TeV to 10 PeV, and both hadronic interaction models yield a bend near the knee.
desk verdict Genuinely new IceTop low-energy spectrum from a new infill trigger, but the bend claim rests on composition systematics not propagated through the response matrix and on visual inspection. read the letter →
The pith
A machine-rendered reading of the paper's core claim, the machinery that carries it, and where it could break.
The reading
What carries the argument
The enabling object is the two-station infill trigger: six infill stations closer than 50 m apart, arranged as four pairs, register an event when any pair is hit within 200 ns, and the entire array's local coincidences within a 10 microsecond window are read out. This trigger collects small air showers that would otherwise be lost. A random forest regressor trained on Monte Carlo predicts core position, zenith angle, and energy from tank charges and hit times; an iterative Bayesian unfolding converts the reconstructed energy distribution into a true energy distribution using a response matrix. The effective area, computed from the Monte Carlo with a modified H3a composition model and Sibyll 2.1, converts the unfolded event count into a flux.
What would settle it
Measure the mean logarithmic mass of cosmic rays in the 100 TeV to 1 PeV range with an independent technique, such as a dedicated air-shower array or a future direct experiment. If that measurement falls outside the envelope spanned by the modified H3a, GST, GSF, and modified Polygonato models, the response matrix used here is biased, and the reconstructed energy spectrum—and hence the bend—would shift by more than the reported systematic uncertainty. Alternatively, if a future hadronic interaction model changes the predicted detector response by more than the quoted systematic band, the bend could move or disappear.
Extended reading notes
Core claim
The central claim is that IceTop can measure the all-particle cosmic ray flux from 250 TeV to 10 PeV, and that the resulting spectrum exhibits a bend near the knee of the cosmic ray spectrum. The authors lower the energy threshold by triggering on events that hit at least one of four closely spaced infill station pairs, collect 7.4 million events in 330 days of livetime, and reconstruct each shower's core, direction, and energy with a random forest trained on air-shower Monte Carlo. After quality cuts and iterative Bayesian unfolding with a response matrix built from simulation, two spectra are derived, one with Sibyll 2.1 and one with QGSJetII-04. Both spectra show a bend in the knee region, are compatible within systematics with the previous 3-year IceTop spectrum in the overlap region, and overlap within systematic errors with an independent ground-based measurement near 300 TeV.
Load-bearing premise
The load-bearing premise is that the true cosmic-ray composition over 250 TeV to 10 PeV lies within the range spanned by the four composition models used in the simulation; if it does not, the reconstructed energies and the bend would shift by more than the quoted uncertainty.
Editorial extensions
If this is right
- The IceTop energy threshold drops from about 1.5 PeV to 250 TeV, so IceTop now spans a range previously covered only by other ground arrays.
- The spectrum provides an overlap region with direct measurements, allowing a consistency check of the transition from direct to indirect techniques.
- The bend near the knee is visible in both hadronic interaction models, suggesting the feature is not an artifact of one particular interaction model.
- The new low-energy events add an independent data set for composition studies in the 100 TeV to 1 PeV range.
- The comparison with the higher-energy IceTop spectrum, within 8.5%, indicates the two analyses are consistent despite different triggers, reconstruction, and energy scales.
Reading between the lines
- The two-station trigger technique could be pushed further: a denser infill or a lower local-coincidence threshold might extend IceTop's reach down toward 100 TeV, almost completely closing the gap to direct measurements.
- The composition-model systematics imply that an independent measurement of the mean logarithmic mass in the 100 TeV to 1 PeV range would directly test the reliability of the reconstructed energies; if the true composition lies outside the spanned models, the bend's location could shift.
- If the bend is confirmed at the same energy by future arrays, it strengthens the case that the knee is a source or propagation effect rather than a detector artifact.
- The unfolding prior and stopping-criterion choice could affect the tilt of the spectrum; a public release of the unfolded counts would let other groups test different priors.
Signed reviews
Editorial analysis
A structured set of objections, weighed in public.
Referee Report
Summary. The paper reports a measurement of the all-particle cosmic-ray energy spectrum from 250 TeV to 10 PeV using IceTop, based on a new two-station trigger that makes use of four pairs of densely spaced infill stations. The analysis uses roughly one year of data (May 2016 through April 2017, 330.43 days livetime), reconstructs core position, zenith angle, and energy with random forest regressors trained on Monte Carlo simulations, and applies an iterative Bayesian unfolding with a spline regularization. Fluxes are computed for two hadronic interaction models, Sibyll 2.1 and QGSJetII-04, and both are reported to show a bend near the knee. The new spectrum is compared with HAWC, KASCADE, Tunka, Tibet III, and ATIC-02, and is stated to overlap with HAWC near 300 TeV and to be compatible with the higher-energy IceTop spectrum within systematics.
Significance. If the measurement is correct, it is valuable because it narrows the gap between direct cosmic-ray measurements (up to ~100 TeV) and the previous IceTop surface-array measurements (above ~1.5 PeV), and it provides an independent cross-check of HAWC and other air-shower experiments in a region where composition and hadronic-interaction uncertainties are large. The paper has clear strengths: a new trigger and filter that extend the detector acceptance, a Monte Carlo based reconstruction with documented resolutions, an explicit accounting of several systematic uncertainties, and a repeat of the full analysis with two hadronic interaction models. The main limitation is that the central claim of a knee-region bend is not yet quantitatively supported: the paper provides no closure test for the unfolding, no statistical significance for the bend, and no flux table, and the composition systematic is treated in a way that does not propagate composition changes through the energy reconstruction.
major comments (4)
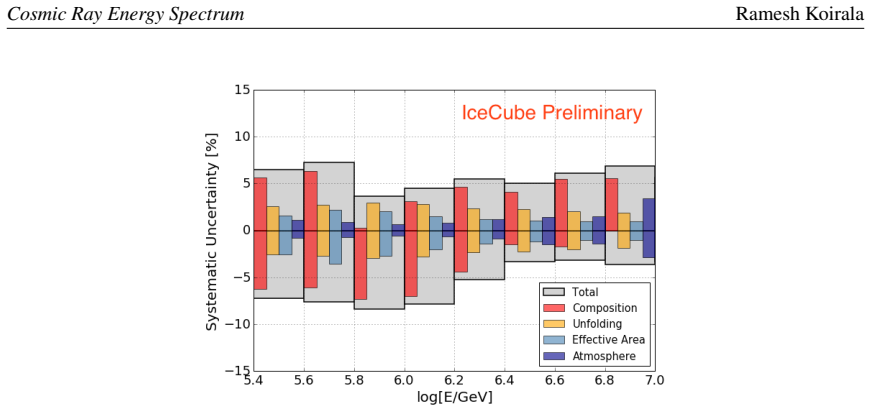
- [Sec. 3.1] The composition systematic is computed by evaluating the flux for alternate composition models 'using the same response matrix'. This does not propagate composition differences through the random forest energy reconstruction or through the unfolding response matrix itself. A different primary mix changes the mapping from tank charges and hit patterns to primary energy, so a response matrix fixed to the modified H3a model can bias reconstructed energies even if alternate flux weights are later applied. Because the spectrum is steep, a few-percent energy-scale shift that grows with energy can alter or even produce the reported bend. Please retrain or re-weight the full chain for at least one alternate composition model, or provide a demonstration that the energy estimator is composition-insensitive in this energy range.
- [Sec. 3, Sec. 4] There is no closure test showing that the reconstruction and unfolding chain recovers an injected Monte Carlo spectrum within statistical and systematic uncertainties. Given that the reported bend is a spectral feature across a narrow energy range, a closure test is needed to show that the unfolding plus quality cuts do not bias the spectral shape, especially at the lowest and highest energies of the reported range. Please add a closure test, ideally including a spectrum with a sharp knee, and report the pulled residuals per bin.
- [Sec. 5, Fig. 4] The conclusion that 'both measured energy spectra show a bend around the knee region' is based on visual inspection of scaled plots. No fit with and without a break is shown, and no statistical or systematic significance for the bend is quoted. Please fit the data with a power law and a broken power law, and report the improvement in fit quality and the best-fit break position and its uncertainty from the combined statistical and systematic errors.
- [Sec. 4] The paper does not provide a numerical flux table. For a measurement that is intended to fill the gap between direct and indirect experiments and to cross-check HAWC and others, the binned fluxes, bin centers, statistical errors, and systematic errors must be tabulated (or made available in a repository cited in the paper). Without this, the central result cannot be used or scrutinized by the community.
minor comments (5)
- [Fig. 1 caption] The caption contains a typo: 'Sybill 2.1' should be 'Sibyll 2.1'.
- [Ref. [13]] Reference [13] lists the author as 'N. Smrinov'; the correct spelling is 'N. Smirnov'.
- [Eq. (4.1)] In Equation (4.1), the notation '∆lnEπ' is ambiguous; it should be written as Δ ln E · π or with explicit parentheses to avoid the appearance that π multiplies the logarithm.
- [Fig. 5] The caption states that the shaded region indicates systematic uncertainties but does not specify whether it is the uncertainty of this analysis only or includes the compared data sets. Please clarify.
- [Sec. 3.1] The text describing the atmospheric systematic would be clearer if the pressure correction factor were quoted with its uncertainty rather than only 'around 5%'.
Circularity Check
No significant circularity: the new IceTop spectrum is derived from data through MC-trained reconstruction and unfolding, with external cross-checks and no fitted parameter renamed as a prediction.
full rationale
The paper's central claim is an experimentally measured all-particle cosmic ray spectrum from 250 TeV to 10 PeV using a new two-station infill trigger. The derivation chain is: (1) collect events with a new hardware trigger, (2) reconstruct core, zenith, and energy with random forests trained on air-shower Monte Carlo, (3) apply quality cuts, (4) unfold the reconstructed energy distribution with an iterative Bayesian method using a simulated response matrix, and (5) divide by livetime, solid angle, and effective area to obtain flux. No parameter is fitted to the final binned spectrum and then presented as a prediction; the unfolded distribution is an output from the data, not an input. The appearance of a bend in the knee region is reported for both Sibyll 2.1 and QGSJetII-04 analyses, which reduces the chance that the feature is an artifact of one hadronic model. The paper also compares the result with HAWC, KASCADE, Tunka, Tibet III, and ATIC-02, providing external checks. The composition systematic is estimated by reweighting alternate composition models through the same response matrix; this is a recognized limitation of the systematic treatment rather than a circular derivation of the spectrum, because the reconstructed data distribution is not itself set by the composition prior. Self-citations to earlier IceTop spectrum analyses are used as context and comparison, not as a load-bearing uniqueness argument. Therefore no circular step meeting the evidentiary standard is present.
Assumptions & free parameters
free parameters (3)
- Effective area sigmoid fit parameters =
not specified
- Unfolding spline regularization strength =
not specified
- Quality cut thresholds =
largest charge <= 75% total; sum of two largest <= 90%; >= 42 stations; total charge > 103.8 VEM excluded
assumptions (4)
- domain assumption Air shower simulations with Sibyll 2.1 and QGSJetII-04 accurately model the development of cosmic-ray air showers in the energy range 250 TeV to 10 PeV.
- domain assumption The modified H3a composition model, and the alternate models GST, GSF, and modified Polygonato, bracket the true cosmic-ray composition.
- domain assumption The Monte Carlo detector simulation accurately reproduces IceTop trigger, charge calibration, snow conditions, and atmospheric profiles.
- domain assumption The random forest regression trained on simulated events generalizes to experimental data.
Cite this review
Pith. "Pith review of Low Energy Cosmic Ray Spectrum from 250 TeV to 10 PeV using IceTop." pith.science (2026). https://pith.science/paper/KZ2G4IUS
@misc{pith2026190807143,
  author       = {Pith},
  title        = {Pith review of: Low Energy Cosmic Ray Spectrum from 250 TeV to 10 PeV using IceTop},
  year         = {2026},
  howpublished = {\url{https://pith.science/paper/KZ2G4IUS}},
  note         = {Machine review of arXiv:1908.07143}
}
read the original abstract
Using IceTop, the surface component of the IceCube Neutrino Observatory, the all-particle cosmic ray energy spectrum has been determined above a few PeV. The measured energy spectrum leaves a gap of more than a decade in energy to direct measurements by balloon and satellite experiments. In this analysis, we lowered the energy threshold of IceTop to 250 TeV, narrowing the gap between IceTop and direct measurements. In order to collect lower energy events, we implemented a new trigger that uses four pairs of infill stations for which the separation between stations is less than 50 m, compared to 125 m for the main array. The new trigger collects data from the entire array for events with hits on at least one infill pair. The low-energy extension of the all-particle cosmic ray energy spectrum using these IceTop events is measured and is compared with the energy spectrum from HAWC and other experiments. Air shower simulations with two different hadronic interaction models, Sibyll 2.1 and QGSJetII-04, are used in this analysis and an energy spectrum for each model is produced. Both measured energy spectra show a bend around the knee region.
Figures


Figures from the paper (2 more)


Reference graph
Works this paper leans on
-
[1]
IceCube Collaboration, M. G. Aartsen et al., Phys. Rev. D88 (2013) 042004
2013
-
[2]
IceCube Collaboration, M. G. Aartsen et al., arXiv:1906.04317
arXiv 1906
-
[3]
Abbasi et al., NIM 700 (2013) 188–220
IceCube Collaboration, R. Abbasi et al., NIM 700 (2013) 188–220
work page 2013
-
[4]
IceCube Collaboration, R. Abbasi et al., Astropart. Phys. 44 (2013) 40–58
work page 2013
-
[5]
Abbasi et al., Astroparticle Physics 42 (Feb, 2013) 15–32
IceCube Collaboration, R. Abbasi et al., Astroparticle Physics 42 (Feb, 2013) 15–32
work page 2013
-
[6]
Rawlins, J
IceCube Collaboration, K. Rawlins, J. Phys. Conf. Ser .718 (2016) 052033
2016
- [7]
-
[8]
James et al., An Introduction to Statistical Learning
G. James et al., An Introduction to Statistical Learning . Springer-Verlag New York, 2013
work page 2013
Show all 21 references
-
[9]
D’Agostini, Nucl
G. D’Agostini, Nucl. Instrum. Meth. A362 (1995) 487–498
1995
- [10]
- [11]
-
[12]
A. N. Kolmogorov, Giornale dell’Istituto Italiano degli Attuari 4 (1933) 83–91
1933
-
[13]
Smrinov, Ann
N. Smrinov, Ann. Math. Statistics 19 (1948) 279–281
1948
-
[14]
Jeffreys, Proc
H. Jeffreys, Proc. Roy. Soc. A 186 (1945)
1945
-
[15]
T. K. Gaisser, T. Stanev, and S. Tilav, Front. Phys.(Beijing) 8 (2013) 748–758
2013
-
[16]
Dembinski et al., PoS(ICRC2017)533 (2018)
H. Dembinski et al., PoS(ICRC2017)533 (2018)
2018
-
[17]
Alfaro et al., Phys
HA WCCollaboration, R. Alfaro et al., Phys. Rev. D96 (2017) 122001
2017
-
[18]
Antoni et al., Astropart
KASCADE Collaboration, T. Antoni et al., Astropart. Phys. 24 (2005) 1–25
2005
-
[19]
V . V . Prosin et al.,NIM 756 (2014) 94 – 101
2014
-
[20]
Amenomori et al., Astrophys
TIBET III Collaboration, M. Amenomori et al., Astrophys. J. 678 (2008) 1165–1179
2008
-
[21]
A. D. Panov et al., Bull. Russ. Acad. Sci. Phys 73 (Jun, 2009) 564–567. 8
2009
Reviewed August 14, 2026 · model on record in the stance chip above.
Discussion (0). Continue with ORCID to comment.