REVIEW 3 major objections 5 minor 81 references
A view of the CIZA J2242.8+5301 galaxy cluster at very low radio frequencies
T0 review · 3 major / 5 minor · reviewed 2026-08-07 · deepseek-v4-flash
Pith's one-line read The paper's 45 MHz LOFAR observations of CIZA J2242.8+5301 reveal a symmetric surface brightness profile across the eastern northern relic, challenging the standard single-shock downstream-advection model and suggesting comparable Mach…
desk verdict Solid new 45 MHz data on the Sausage cluster, but the headline symmetric-profile claim rests on a profile that still contains the overlapping source R5 and is not statistically symmetric. read the letter →
The pith
A machine-rendered reading of the paper's core claim, the machinery that carries it, and where it could break.
The reading
What carries the argument
The argument is carried by the deconvolved surface brightness profile of the northern relic, extracted from the 45 MHz image in 70″×15″ boxes along the relic, and by a toy model that generates the profile from a spherical-cap shock. The model includes line-of-sight projection with opening angle $\Psi=12^\circ$, a log-normal distribution of the downstream magnetic field (best fit $B_0=0.3\,\mu$G, scatter $\log(\sigma)=1.65$), and Gaussian 'wiggles' of the shock radius with $\sigma=15$ kpc. Comparing this model against 45 MHz and higher-frequency profiles shows it can match the downstream side but always leaves an excess of emission upstream, which is the load-bearing discrepancy. The Mach-number analysis uses the injection spectral index measured in beam-sized boxes along the relic edges, with Gaussian-mixture classification to separate statistically distinct spectral-index populations.
What would settle it
Subtract a model of R5, built from higher-frequency images where R5 is more clearly separated, from the 45 MHz eastern profile and recompute its shape; if the profile becomes asymmetric like the western half, the claimed symmetry is a superposition effect. Alternatively, low-frequency imaging at higher resolution that separates R5 from the relic would settle whether the upstream wing is part of the relic or a separate structure.
Extended reading notes
Core claim
On the paper's own terms, the discovery is that LOFAR's Low Band Antenna (LBA) 45 MHz imaging resolves the eastern part of the northern relic into a surface brightness distribution that is symmetric about its peak, with significant upstream and downstream wings, whereas the western part shows the usual asymmetric rise-and-cool profile. This contradicts the expectation of particle acceleration at a single sharp shock followed by downstream advection of the accelerated electrons, and the paper argues that the symmetry must be produced by a combination of projection, spatial variation of the magnetic field (modeled as log-normal), and small-scale corrugation of the shock surface. The modeling reproduces the downstream decline at 45, 145, 1500, and 3000 MHz but leaves a systematic excess upstream, which the paper interprets as evidence that the simple picture is incomplete. The same low-frequency data give injection spectral indices that translate to very similar Mach numbers for the two relics, $M_N=2.9\pm0.5$ and $M_S=2.9\pm0.8$, suggesting the two shocks are comparably strong.
Load-bearing premise
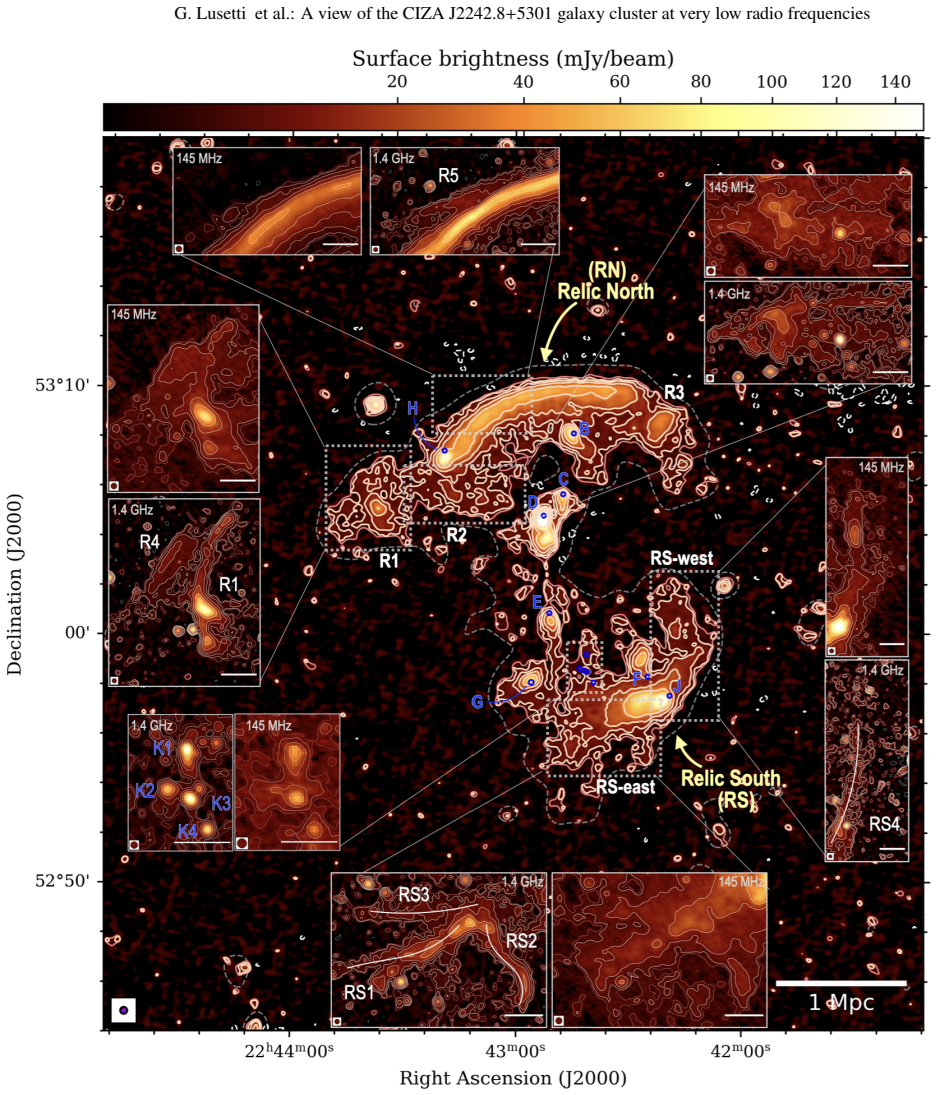
The symmetric profile is treated as belonging to the northern relic itself, but a faint, separate patch of radio emission called R5 overlaps the same region and is not subtracted from the profile, so it could be supplying part of the upstream wing.
Editorial extensions
If this is right
- The eastern half of the northern relic cannot be explained by the standard single-shock, downstream-advection model; projection, magnetic-field variation, or additional structure such as R5 must contribute.
- The two relics have comparable shock strengths, $M_N=2.9\pm0.5$ and $M_S=2.9\pm0.8$, when Mach numbers are derived from the local injection spectral index rather than from the integrated spectrum.
- Integrated spectra of both relics are close to single power laws from 45 MHz to 3 GHz, consistent with DSA from the thermal pool, but the local-injection Mach numbers are lower than those from integrated indices and reduce the usual radio/X-ray Mach discrepancy.
- Low-frequency observations trace faint, steep-spectrum regions that are invisible at higher frequencies, such as the north-western part of the southern relic, and reveal connections between substructures that appear disconnected at higher frequencies.
Reading between the lines
- If the eastern profile's symmetry survives after subtracting R5, the standard single-shock DSA picture needs additional ingredients, such as substantial magnetic-field fluctuations or large-scale shock corrugation, to explain low-frequency relic morphology.
- The near-equal Mach numbers from local injection indices suggest that opposing relics in a roughly 1:1 merger may have comparable strengths when measured at the shock front, which could reduce the apparent radio/X-ray Mach discrepancy in other systems too.
- The systematic upstream excess that resists the toy model may indicate that part of the emission comes from a separate structure projected onto the main relic; higher-resolution low-frequency imaging could separate these components.
- Because 45 MHz emission is less affected by radiative losses, comparing injection indices derived at low frequency with higher-frequency maps isolates the cooling history; this approach could be applied to other double-relic systems.
Signed reviews
Editorial analysis
A structured set of objections, weighed in public.
Referee Report
Summary. This paper presents the first LOFAR LBA 45 MHz observations of the Sausage cluster CIZA J2242.8+5301, reaching a thermal-noise-limited rms of 1.5 mJy/beam at 15'' resolution. Combining these data with existing 145 MHz to 3 GHz images, the authors measure integrated spectra, spectral index and curvature maps, local injection indices along the relic edges, and derive Mach numbers for the northern (RN) and southern (RS) relics. They report M_N = 2.9 ± 0.4 and M_S = 2.9 ± 0.8 from the flatter GMM-selected injection-index components, and they claim a 'remarkably symmetric' 45 MHz surface-brightness profile across the eastern part of RN, which they model with a spherical-cap shock, projection, a log-normal magnetic field, and Gaussian shock-surface wiggles. The model leaves a systematic upstream excess, which is discussed as a remaining discrepancy.
Significance. The 45 MHz images and the multi-frequency spectral products constitute a useful observational contribution to a benchmark cluster, and the data reduction appears carefully executed. If the symmetric eastern profile is intrinsic to RN, the result would be significant because it challenges the standard edge-on single-shock plus downstream-advection interpretation of radio relics. However, the central claim is not yet established: the profile extraction does not subtract or mask R5, a known extended steep-spectrum source overlapping the same region, and the paper's own skewness test (p≈3×10^-14 for the full 45 MHz profile) does not support the 'remarkably symmetric' wording. With a quantitative, R5-subtracted profile the claim could become a durable falsifiable result; in the present form it is an interesting but unproven superposition candidate.
major comments (3)
- [Sec. 4.2, Fig. 9 (right); Sec. 4.3] The symmetry claim rests on a profile from which only compact sources were blanked, while R5—an extended, steep-spectrum source (α_R5_int = −0.90 ± 0.03) that Sec. 3.1 places north of the eastern edge of RN and Sec. 4.3 describes as a ~716 kpc-long, ~100 kpc-wide structure in the north-west part of RN—is not subtracted. Because R5 is clearly detected at 45 MHz and appears more diffuse at low frequencies, its unsubtracted emission can produce the upstream wing that makes the eastern profile look symmetric. The authors should re-extract the eastern profile after masking or modelling R5 (or, at minimum, quantify the contribution of R5 to each profile bin); without this step, the headline claim may be a superposition of two distinct structures rather than an intrinsic property of the relic shock. The contradiction between the two reported locations of R5 (north of the eastern edge vs. north-west) also needs to be resolved.
- [Appendix A, Table A.1] The quantitative test contradicts the 'remarkably symmetric' claim. For the full 45 MHz deconvolved profile, the reported skewness is 0.63 with p = 3.25 × 10^-14, so Gaussianity (zero skewness) is rejected at overwhelming significance; the text's statement that 'the 45 MHz profile is more symmetric, with a skewness between −0.5 and 0.5' is numerically inconsistent with the tabulated value. The authors should either report a symmetry metric for the eastern half alone, with uncertainties, or rephrase the claim as 'less asymmetric than at 610 MHz.'
- [Fig. 9 (right) and Sec. 4.2 modelling] The deconvolved profiles are plotted without error bars, and the 'symmetry' is assessed visually. These same profiles are used to derive the FWHM of 138 kpc, the magnetic-field range of 5–10 μG, and the comparison with the spherical-cap model, so without uncertainties the significance of the symmetry and the resulting parameter constraints cannot be evaluated. Error bars obtained, for example, from bootstrapping the clean-component model or from the image rms and beam correlation should be shown.
minor comments (5)
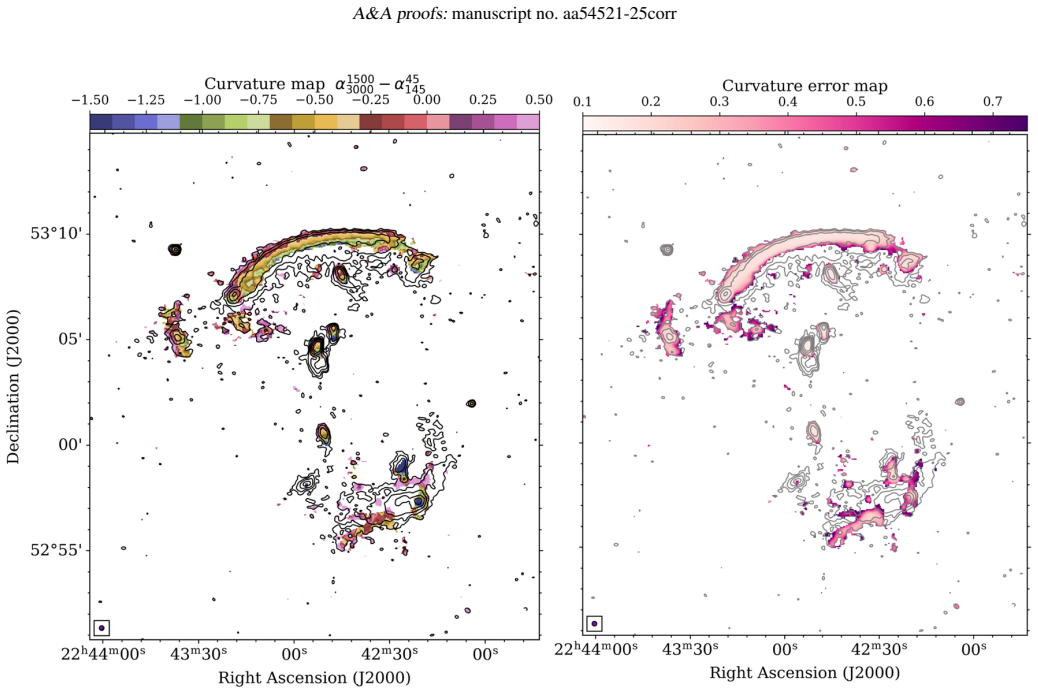
- [Sec. 3.4, after Eq. (2)] The two sentences defining C<0 for a concave spectrum and 'Conversely, C<0' for an inverted spectrum are mutually inconsistent; for the inverted case defined by |α_high|<|α_low|, C = α_high − α_low is positive.
- [Sec. 4.2] The spherical-cap curvature radius is quoted as 'R = 1.5 kpc', which appears to be a typo for Mpc; with R = 1.5 kpc and Ψ = 12°, the projected injection distance would be ~0.3 kpc, not the 33 kpc quoted in the text.
- [Abstract vs. Sec. 4.1 and Table 4] The abstract reports M_N = 2.9 ± 0.5 while Sec. 4.1 and Table 4 report M_N = 2.9 ± 0.4 for the same local-injection-index measurement; the values should agree.
- [Sec. 3.1 and Conclusions] Section 3.1 reports the 15''-resolution size of RN as ~2 Mpc × 450 kpc, while the Conclusions quote 2.2 Mpc × 760 kpc (the 30'' value) as the northern relic's size; the resolution used in the summary should be stated explicitly.
- [Fig. 9 and Fig. 11 captions] The Fig. 11 caption contains a typo ('emission regio'), and the Fig. 9 caption uses 'FMHW' instead of 'FWHM'; the caption of Fig. 9 also says 15''-spaced extraction regions while the text says 70×15'' boxes, and the notation should be unified.
Circularity Check
No meaningful circularity: Mach numbers are measured from spectral indices via standard DSA relations, and the symmetric-profile claim is an observational extraction, not a model output.
full rationale
The paper's derivation chain is not circular. Mach numbers come from measured spectral indices inserted into the standard DSA equations (Eqs. 3-5), not from fitting M to a pre-chosen result; the GMM clustering selects populations, but the values are data-driven. The headline claim of a symmetric 45 MHz profile across the eastern northern relic is an observational measurement from deconvolved images (Sect. 4.2, Fig. 9), not an output of the toy model; in fact, the model leaves a systematic upstream discrepancy, so the profile claim is not forced by the model. The magnetic-field modelling parameters (B0 = 0.3 microG, log sigma = 1.65) are fitted to the profiles, but the paper's B-field conclusions rest on FWHM/cooling-length reasoning and external constraints, so this is model dependence rather than circularity. The main unresolved concern is physical rather than circular: R5 overlaps the eastern profile and is not subtracted in the Sect. 4.2 extraction, so part of the 'symmetric wing' could be a superposition with R5 (Sect. 4.3). That is a contamination and interpretation limitation, not a case of a prediction being equivalent to its input by construction. Self-citations to prior work by the same groups supply data and a model framework, but the key numbers are independently measured and compared against external benchmarks, including previous spectral index and Mach number estimates.
Assumptions & free parameters
free parameters (6)
- B_0 (log-normal median magnetic field) =
0.3 µG
- log σ (log-normal scatter) =
1.65
- Ψ (spherical cap opening angle) =
12 degrees
- σ_wiggles (Gaussian shock-surface scatter) =
15 kpc
- Injection spectral index (north, selected) =
-0.76 ± 0.08
- Injection spectral index (south, selected) =
-0.77 ± 0.16
assumptions (6)
- domain assumption DSA relation between injection spectral index and Mach number (Eq. 5: M = sqrt((2 α_inj - 3)/(2 α_inj + 1)))
- domain assumption Integrated spectral index equals injection index plus 0.5 (Eq. 4)
- domain assumption Spectral index measured at the relic edge is the injection index because cooling is negligible over the beam
- domain assumption Synchrotron and IC cooling length formula for relic width
- ad hoc to paper Spherical cap shock model with uniform Mach number, log-normal B field, and Gaussian wiggles
- domain assumption 3σ rms threshold defines source boundaries
Cite this review
Pith. "Pith review of A view of the CIZA J2242.8+5301 galaxy cluster at very low radio frequencies." pith.science (2026). https://pith.science/paper/LCKU5TE6
@misc{pith2026250523402,
  author       = {Pith},
  title        = {Pith review of: A view of the CIZA J2242.8+5301 galaxy cluster at very low radio frequencies},
  year         = {2026},
  howpublished = {\url{https://pith.science/paper/LCKU5TE6}},
  note         = {Machine review of arXiv:2505.23402}
}
read the original abstract
The galaxy cluster CIZA J2242.8+5301 is a well-studied merging galaxy cluster that hosts prominent double radio relics including the famous sausage relic, as well as other diffuse radio sources. Observations at frequencies below 100 MHz are essential for investigating the physics of radio relics as they provide unique access to the low-energy population of cosmic-ray electrons. We aim to study the morphology, spectral characteristics, and physical processes that produce relics. We present the first observations of the Sausage cluster at 45 MHz, the lowest radio frequency at which this cluster has been studied to date, using the Low Band Antenna (LBA) of the LOFAR radio interferometer. We made use of ten hours of LOFAR LBA observations, from which we achieved a thermal-noise limited radio image with a noise level of 1.5 mJy/beam at a resolution of 15 arcsec. These data were combined with existing multi-frequency measurements at higher frequencies: LOFAR High Band Antenna, Giant Metrewave Radio Telescope, Westerbork Synthesis Radio Telescope, and Karl G. Jansky Very Large Array. This broad frequency coverage allowed us to derive integrated spectral indices, spectral index and curvature maps, and Mach number distributions across the relics. We derived Mach numbers from the local injection index measure using low-frequency data with M_N = 2.9 +-0.5 for the northern relic and M_S = 2.9+-0.8 for the southern relic. LOFAR LBA observations reveal a remarkably symmetric surface brightness profile across the eastern part of the northern relic, with wings extending on either side of the peak. This discovery is contrary to the expectation of particle acceleration at a single, sharp shock and the subsequent downstream advection of accelerated electrons. We modelled the surface brightness profile, including the effects of projection, magnetic field variation, and shock deformation.
Figures


Figures from the paper (8 more)




Reference graph
Works this paper leans on
-
[1]
1974, IEEE Transactions on Automatic Control, 19, 716
Akaike , H. 1974, IEEE Transactions on Automatic Control, 19, 716
1974
- [2]
-
[3]
Akamatsu , H., van Weeren , R. J., Ogrean , G. A., et al. 2015, , 582, A87
work page 2015
- [4]
-
[5]
Blandford , R. D. & Ostriker , J. P. 1978, , 221, L29
work page 1978
-
[6]
Bonafede , A., Giovannini , G., Feretti , L., Govoni , F., & Murgia , M. 2009, , 494, 429
work page 2009
- [7]
-
[8]
& Jones , T
Brunetti , G. & Jones , T. W. 2014, International Journal of Modern Physics D, 23, 1430007
2014
Show all 81 references
-
[9]
J., Cotton , W
Condon , J. J., Cotton , W. D., Greisen , E. W., et al. 1998, , 115, 1693
1998
-
[10]
A., Jee , M
Dawson , W. A., Jee , M. J., Stroe , A., et al. 2015, , 805, 143
2015
-
[11]
2020 a , , 642, A85
de Gasperin , F., Brunetti , G., Br \"u ggen , M., et al. 2020 a , , 642, A85
2020
-
[12]
J., Drabent , A., et al
de Gasperin , F., Dijkema , T. J., Drabent , A., et al. 2019, , 622, A5
2019
-
[13]
W., Williams , W
de Gasperin , F., Edler , H. W., Williams , W. L., et al. 2023, , 673, A165
2023
-
[14]
T., van Weeren , R
de Gasperin , F., Intema , H. T., van Weeren , R. J., et al. 2015, , 453, 3483
2015
-
[15]
2022, , 659, A146
de Gasperin , F., Rudnick , L., Finoguenov , A., et al. 2022, , 659, A146
2022
-
[16]
P., et al
de Gasperin , F., Vink , J., McKean , J. P., et al. 2020 b , , 635, A150
2020
-
[17]
L., Best , P., et al
de Gasperin , F., Williams , W. L., Best , P., et al. 2021, , 648, A104
2021
-
[18]
J., Hoeft , M., et al
Di Gennaro , G., van Weeren , R. J., Hoeft , M., et al. 2018, , 865, 24
2018
-
[19]
J., Rudnick , L., et al
Di Gennaro , G., van Weeren , R. J., Rudnick , L., et al. 2021, , 911, 3
2021
-
[20]
2021, , 500, 795
Dominguez-Fernandez , P., Bruggen , M., Vazza , F., et al. 2021, , 500, 795
2021
-
[21]
2024 a , , 685, A68
Dom \' nguez-Fern \'a ndez , P., Ryu , D., & Kang , H. 2024 a , , 685, A68
2024
-
[22]
2024 b , , 685, A68
Dom \' nguez-Fern \'a ndez , P., Ryu , D., & Kang , H. 2024 b , , 685, A68
2024
-
[23]
Donnert , J. M. F., Stroe , A., Brunetti , G., Hoang , D., & Roettgering , H. 2016, , 462, 2014
2016
-
[24]
Drury , L. O. 1983, Reports on Progress in Physics, 46, 973
1983
-
[25]
W., de Gasperin , F., Brunetti , G., et al
Edler , H. W., de Gasperin , F., Brunetti , G., et al. 2022, , 666, A3
2022
-
[26]
A., Biermann , P
Ensslin , T. A., Biermann , P. L., Klein , U., & Kohle , S. 1998, , 332, 395
1998
-
[27]
2021, , 915, 18
Ha , J.-H., Kim , S., Ryu , D., & Kang , H. 2021, , 915, 18
2021
-
[28]
N., Shimwell , T
Hoang , D. N., Shimwell , T. W., Stroe , A., et al. 2017, , 471, 1107
2017
-
[29]
N., Shimwell , T
Hoang , D. N., Shimwell , T. W., van Weeren , R. J., et al. 2018, , 478, 2218
2018
-
[30]
& Br \"u ggen , M
Hoeft , M. & Br \"u ggen , M. 2007, , 375, 77
2007
-
[31]
E., Gottl \"o ber , S., et al
Hoeft , M., Nuza , S. E., Gottl \"o ber , S., et al. 2011, Journal of Astrophysics and Astronomy, 32, 509
2011
-
[32]
2022, , 509, 1160
Inchingolo , G., Wittor , D., Rajpurohit , K., & Vazza , F. 2022, , 509, 1160
2022
-
[33]
T., Jagannathan , P., Mooley , K
Intema , H. T., Jagannathan , P., Mooley , K. P., & Frail , D. A. 2017, , 598, A78
2017
-
[34]
J., Stroe , A., Dawson , W., et al
Jee , M. J., Stroe , A., Dawson , W., et al. 2015, , 802, 46
2015
-
[35]
2012, Journal of Korean Astronomical Society, 45, 127
Kang , H. 2012, Journal of Korean Astronomical Society, 45, 127
2012
-
[36]
2016, Journal of Korean Astronomical Society, 49, 145
Kang , H. 2016, Journal of Korean Astronomical Society, 49, 145
2016
-
[37]
& Ryu , D
Kang , H. & Ryu , D. 2011, , 734, 18
2011
-
[38]
Kardashev , N. S. 1962, , 6, 317
1962
-
[39]
2017, , 600, A18
Kierdorf , M., Beck , R., Hoeft , M., et al. 2017, , 600, A18
2017
-
[40]
D., Ebeling , H., Mullis , C
Kocevski , D. D., Ebeling , H., Mullis , C. R., & Tully , R. B. 2007, , 662, 224
2007
-
[41]
M., Cotton , W
Lane , W. M., Cotton , W. D., van Velzen , S., et al. 2014, , 440, 327
2014
-
[42]
Leahy , D. A. & Roger , R. S. 1998, , 505, 784
1998
-
[43]
2024, , 686, A55
Lee , W., Pillepich , A., ZuHone , J., et al. 2024, , 686, A55
2024
-
[44]
2017, , 472, 3605
Loi , F., Murgia , M., Govoni , F., et al. 2017, , 472, 3605
2017
-
[45]
2020, , 498, 1628
Loi , F., Murgia , M., Vacca , V., et al. 2020, , 498, 1628
2020
-
[46]
2005, , 627, 733
Markevitch , M., Govoni , F., Brunetti , G., & Jerius , D. 2005, , 627, 733
2005
-
[47]
Massey , F. J. J. 1951, Journal of the American Statistical Association, 46, 68
1951
-
[48]
& Rafferty , D
Mohan , N. & Rafferty , D. 2015, PyBDSF: Python Blob Detection and Source Finder , Astrophysics Source Code Library, record ascl:1502.007
2015
-
[49]
R., McKinley , B., Hurley-Walker , N., et al
Offringa , A. R., McKinley , B., Hurley-Walker , N., et al. 2014, , 444, 606
2014
-
[50]
u ggen , M., R \
Ogrean , G. A., Br \"u ggen , M., R \"o ttgering , H., et al. 2013, , 429, 2617
2013
-
[51]
A., Br \"u ggen , M., van Weeren , R., et al
Ogrean , G. A., Br \"u ggen , M., van Weeren , R., et al. 2014, , 440, 3416
2014
-
[52]
W., Br \"u ggen , M., et al
Pasini , T., Edler , H. W., Br \"u ggen , M., et al. 2022, , 663, A105
2022
-
[53]
P., & Pfrommer , C
Pinzke , A., Oh , S. P., & Pfrommer , C. 2013, , 435, 1061
2013
-
[54]
M., Venturi , T., Rahaman , M., & Yang , H
Raja , R., Smirnov , O. M., Venturi , T., Rahaman , M., & Yang , H. Y. K. 2024, , 977, 83
2024
-
[55]
J., Hoeft , M., et al
Rajpurohit , K., van Weeren , R. J., Hoeft , M., et al. 2022, , 927, 80
2022
-
[56]
2020, , 642, L13
Rajpurohit , K., Vazza , F., Hoeft , M., et al. 2020, , 642, L13
2020
-
[57]
J., Bonnassieux , E., Vernstrom , T., et al
Riseley , C. J., Bonnassieux , E., Vernstrom , T., et al. 2022, , 515, 1871
2022
-
[58]
1978, Annals of Statistics, 6, 461
Schwarz , G. 1978, Annals of Statistics, 6, 461
1978
-
[59]
W., Xu , H., Hallman , E
Skillman , S. W., Xu , H., Hallman , E. J., et al. 2013, , 765, 21
2013
-
[60]
J., Hardcastle , M
Stroe , A., Harwood , J. J., Hardcastle , M. J., & R \"o ttgering , H. J. A. 2014 a , , 445, 1213
2014
-
[61]
J., et al
Stroe , A., Rumsey , C., Harwood , J. J., et al. 2014 b , , 441, L41
2014
-
[62]
2016, , 455, 2402
Stroe , A., Shimwell , T., Rumsey , C., et al. 2016, , 455, 2402
2016
-
[63]
J., Intema , H
Stroe , A., van Weeren , R. J., Intema , H. T., et al. 2013 a , , 555, A110
2013
-
[64]
J., Intema , H
Stroe , A., van Weeren , R. J., Intema , H. T., et al. 2013 b , , 555, A110
2013
-
[65]
2009, PhD thesis, Technical University of Delft, Netherlands
Van der Tol , S. 2009, PhD thesis, Technical University of Delft, Netherlands
2009
-
[66]
P., Wise , M
van Haarlem , M. P., Wise , M. W., Gunst , A. W., et al. 2013, , 556, A2
2013
-
[67]
J., Andrade-Santos , F., Dawson , W
van Weeren , R. J., Andrade-Santos , F., Dawson , W. A., et al. 2017, Nature Astronomy, 1, 0005
2017
-
[68]
J., de Gasperin , F., Akamatsu , H., et al
van Weeren , R. J., de Gasperin , F., Akamatsu , H., et al. 2019, , 215, 16
2019
-
[69]
J., Hoeft , M., R \"o ttgering , H
van Weeren , R. J., Hoeft , M., R \"o ttgering , H. J. A., et al. 2011 a , , 528, A38
2011
-
[70]
o ttgering , H. J. A., Br \
van Weeren , R. J., Intema , H. T., R \"o ttgering , H. J. A., Br \"u ggen , M., & Hoeft , M. 2011 b , , 82, 569
2011
-
[71]
o ttgering , H. J. A., Br \
van Weeren , R. J., R \"o ttgering , H. J. A., Br \"u ggen , M., & Hoeft , M. 2010, Science, 330, 347
2010
-
[72]
J., R \"o ttgering , H
van Weeren , R. J., R \"o ttgering , H. J. A., Intema , H. T., et al. 2012, , 546, A124
2012
-
[73]
J., Shimwell , T
van Weeren , R. J., Shimwell , T. W., Botteon , A., et al. 2021, , 651, A115
2021
-
[74]
& Botteon , A
Vazza , F. & Botteon , A. 2024, Galaxies, 12, 19
2024
-
[75]
2024, arXiv e-prints, arXiv:2411.11947
Whittingham , J., Pfrommer , C., Werhahn , M., Jlassi , L., & Girichidis , P. 2024, arXiv e-prints, arXiv:2411.11947
2024
-
[76]
2023, Universe, 9, 319
Wittor , D. 2023, Universe, 9, 319
2023
-
[77]
2021, , 506, 396
Wittor , D., Ettori , S., Vazza , F., et al. 2021, , 506, 396
2021
-
[78]
2019, , 490, 3987
Wittor , D., Hoeft , M., Vazza , F., Br \"u ggen , M., & Dom \' nguez-Fern \'a ndez , P. 2019, , 490, 3987
2019
-
[79]
2016, Galaxies, 4, 71
Wittor , D., Vazza , F., & Br \"u ggen , M. 2016, Galaxies, 4, 71
2016
-
[80]
, " * write output.state after.block = add.period write newline
ENTRY address archiveprefix author booktitle chapter edition editor howpublished institution eprint journal key month note number organization pages publisher school series title type volume year label extra.label sort.label short.list INTEGERS output.state before.all mid.sent...
-
[81]
write newline
" write newline "" before.all 'output.state := FUNCTION n.dashify 't := "" t empty not t #1 #1 substring "-" = t #1 #2 substring "--" = not "--" * t #2 global.max substring 't := t #1 #1 substring "-" = "-" * t #2 global.max substring 't := while if t #1 #1 substring * t #2 gl...
Reviewed August 7, 2026 · model on record in the stance chip above.
Discussion (0). Continue with ORCID to comment.