Modal Analysis of Spatial Load Correlation in AI Data Center-Dominated Power Systems
Pith reviewed 2026-07-02 22:23 UTC · model grok-4.3
The pith
Dynamic mode decomposition tracks transient load correlations in AI data center power systems and flags intensifications about 4 seconds ahead.
A machine-rendered reading of the paper's core claim, the machinery that carries it, and where it could break.
Core claim
Dynamic mode decomposition applied to the temporal evolution of pairwise inter-bus correlation coefficients yields modes that distinguish sustained coherence, decaying transients, and intensifying events; their oscillation timescales map to physical coupling mechanisms, and a modal growth indicator signals correlation intensification with a lead of about 4 s before pairwise coherence reaches its peak.
What carries the argument
Dynamic Mode Decomposition applied to the temporal evolution of pairwise inter-bus correlation coefficients to form a low-dimensional state representation for modal analysis of non-stationary correlations.
If this is right
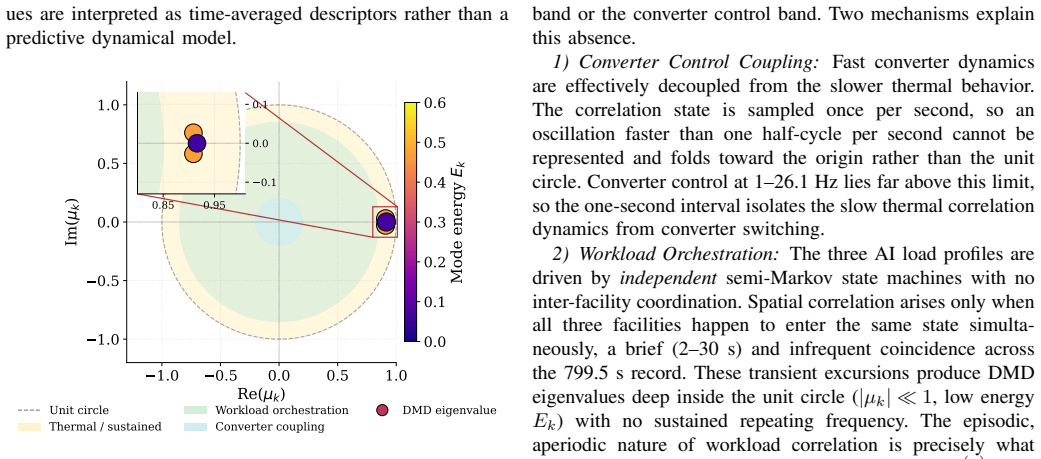
- Global analysis attributes the dominant correlation energy to a slow thermal band.
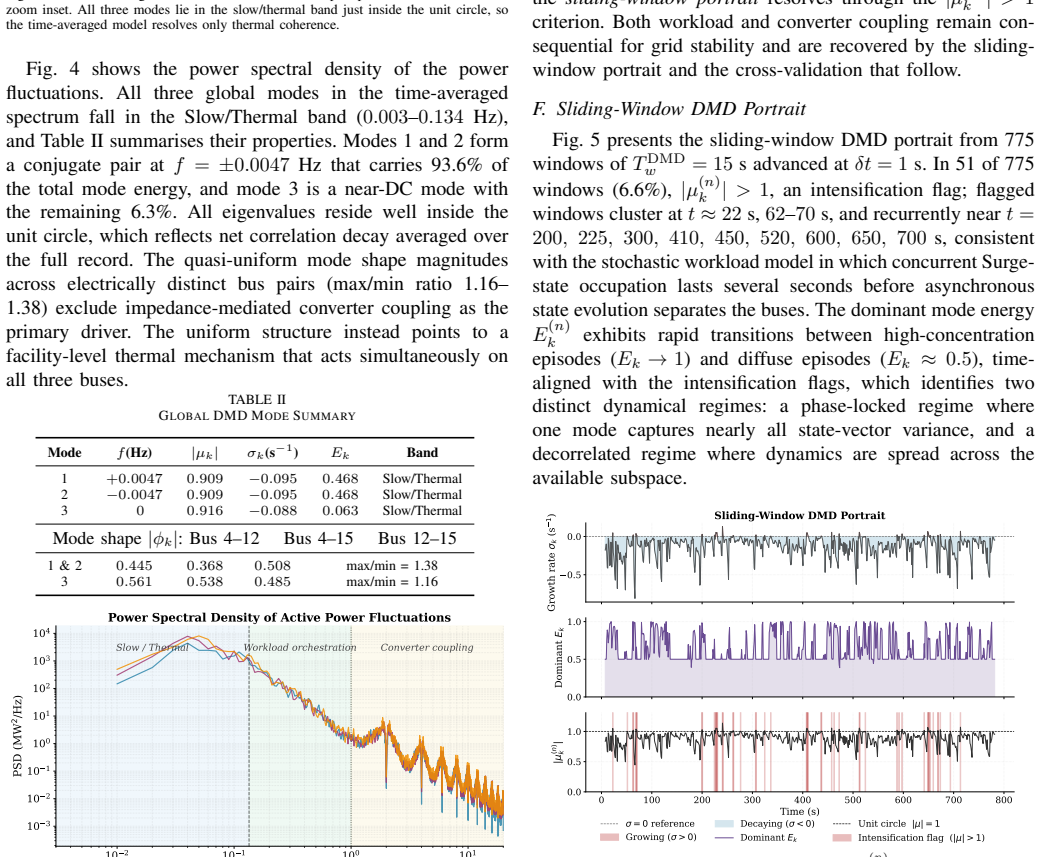
- Sliding-window analysis identifies brief intensification events in only a small fraction of windows, aligned with stochastic workload coincidences.
- Cross-validation against RTDS voltage coherence confirms elevated coupling precisely during those identified intervals.
- The approach enables modal analysis of correlation structure without a stationarity assumption.
Where Pith is reading between the lines
- The same decomposition could be applied to other episodic load types such as EV charging clusters to detect correlated stress events.
- A 4 s lead time opens the possibility of triggering fast-acting controls or demand response before voltage or frequency deviations materialize.
- Mapping mode timescales directly to physical mechanisms suggests the method could help locate which network elements most strongly couple distant loads.
Load-bearing premise
The synthetic workload profiles used to drive the three converter-interfaced AI data center loads produce representative spatial and temporal correlation structures.
What would settle it
Real-time measurements on an operating system with actual AI data center loads showing that the modal growth indicator does not precede pairwise coherence peaks by approximately 4 s.
Figures
read the original abstract
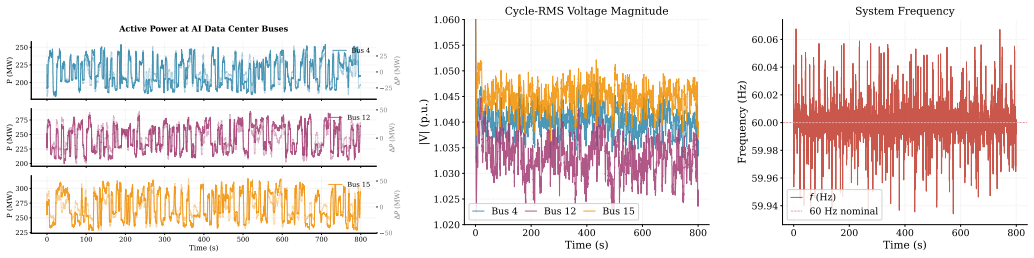
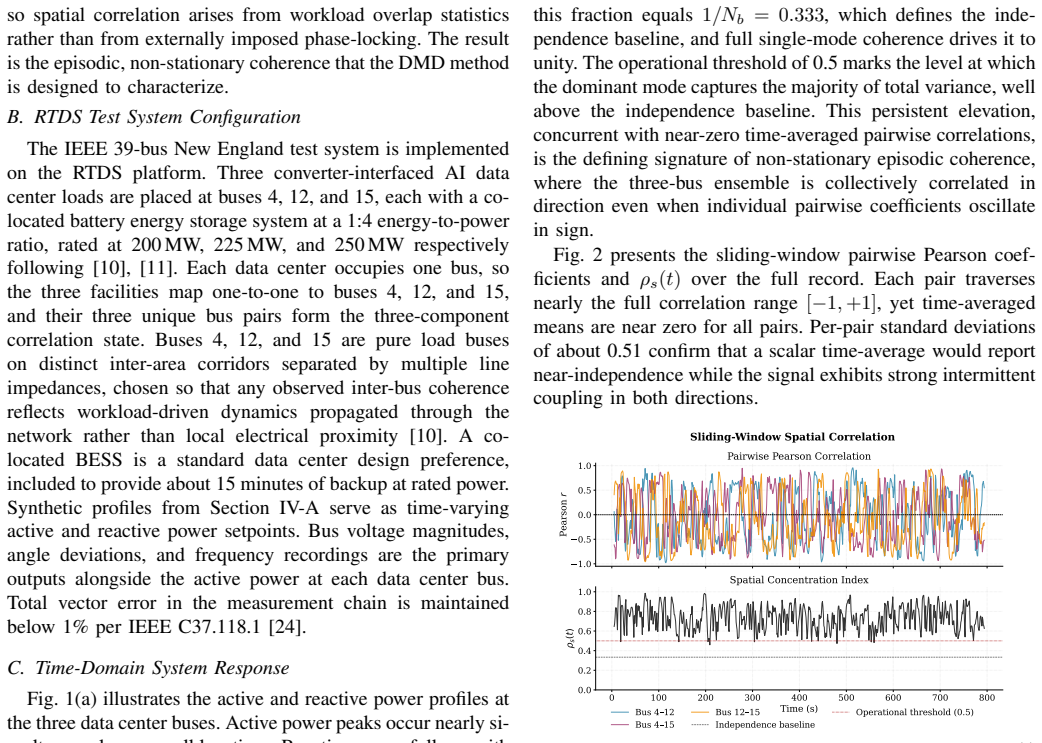
Hyperscale AI data centers induce spatially and temporally correlated load fluctuations that violate classical independence assumptions and are not captured by time-averaged spectral methods. These correlations are episodic and non-stationary, so they demand analysis that resolves transient structure. This paper applies Dynamic Mode Decomposition (DMD) to the temporal evolution of pairwise inter-bus correlation coefficients and forms a low-dimensional state representation that enables modal analysis without a stationarity assumption. The recovered modes distinguish sustained coherence, decaying transients, and intensifying events, and their oscillation timescales map to underlying physical coupling mechanisms. The method is evaluated on an IEEE 39-bus Real-Time Digital Simulator (RTDS) testbed with three converter-interfaced AI data center loads driven by synthetic workload profiles. A global analysis attributes the dominant correlation energy to a slow thermal band, and a sliding-window analysis identifies brief intensification events in a small fraction of windows that align with stochastic workload coincidences. Cross-validation with RTDS voltage coherence confirms elevated coupling during these intervals. The proposed modal growth indicator provides an early-warning signal of correlation intensification, with a lead of of about 4~s before pairwise coherence reaches its peak.
Editorial analysis
A structured set of objections, weighed in public.
Referee Report
Summary. The paper applies Dynamic Mode Decomposition (DMD) to the time series of pairwise inter-bus correlation coefficients extracted from synthetic AI data center workloads on an IEEE 39-bus RTDS testbed. It claims that the resulting low-dimensional modal representation distinguishes sustained coherence, decaying transients, and intensifying events without assuming stationarity; that oscillation timescales map to physical coupling mechanisms; and that a modal growth indicator supplies an early-warning signal of correlation intensification, leading pairwise coherence peaks by approximately 4 s. The evaluation includes a global energy attribution to a slow thermal band and sliding-window detection of brief intensification events, cross-validated against RTDS voltage coherence.
Significance. If the central claims hold, the work supplies a non-stationary modal tool for detecting episodic spatial correlations in AI-dominated grids that classical spectral methods miss. The RTDS testbed evaluation with converter-interfaced loads and the cross-validation against voltage coherence provide concrete empirical grounding; the absence of stationarity assumptions and the low-dimensional state representation are methodological strengths. However, the significance is tempered by the exclusive reliance on unbenchmarked synthetic profiles.
major comments (2)
- [Abstract] Abstract and testbed evaluation: the reported ~4 s lead of the modal growth indicator before coherence peaks is demonstrated solely for the paper's chosen synthetic workload profiles driving the three loads; no comparison to measured traces from operating hyperscale facilities or to alternative generative models (different burstiness or spatial kernels) is supplied, so both the existence and timing of intensification events may be artifacts of the particular stochastic coincidence structure rather than general features of AI data center loads.
- [Abstract] Abstract: the claim that the growth indicator provides an early-warning signal is presented without quantitative error bars on the lead time, statistical significance tests across windows, or sensitivity analysis to post-processing choices such as sliding-window length or DMD rank, weakening the quantitative support for the 4 s figure.
minor comments (1)
- [Abstract] The abstract could more explicitly separate the global analysis results from the sliding-window intensification findings to improve readability.
Simulated Author's Rebuttal
We thank the referee for the constructive feedback highlighting both the strengths and limitations of our work. We will revise the manuscript to address the concerns about the specificity to synthetic profiles and the quantitative support for the early-warning signal.
read point-by-point responses
-
Referee: [Abstract] Abstract and testbed evaluation: the reported ~4 s lead of the modal growth indicator before coherence peaks is demonstrated solely for the paper's chosen synthetic workload profiles driving the three loads; no comparison to measured traces from operating hyperscale facilities or to alternative generative models (different burstiness or spatial kernels) is supplied, so both the existence and timing of intensification events may be artifacts of the particular stochastic coincidence structure rather than general features of AI data center loads.
Authors: The evaluation indeed relies on synthetic workload profiles, which were generated to emulate key statistical properties of AI data center loads such as burstiness and spatial correlation. We acknowledge that this limits generalizability and that the observed 4 s lead may depend on the specific stochastic structure. We cannot provide comparisons to real measured traces as such data from operating facilities is proprietary and not accessible. We will revise the abstract to qualify the claim as observed in the synthetic testbed and add a dedicated limitations subsection discussing the synthetic nature and potential sensitivity to profile parameters. Additionally, we will include results from alternative generative models with varied burstiness parameters to test robustness. revision: partial
-
Referee: [Abstract] Abstract: the claim that the growth indicator provides an early-warning signal is presented without quantitative error bars on the lead time, statistical significance tests across windows, or sensitivity analysis to post-processing choices such as sliding-window length or DMD rank, weakening the quantitative support for the 4 s figure.
Authors: We agree that additional quantitative support is needed. In the revised manuscript, we will report the lead time with error bars (standard deviation across multiple simulation windows and random seeds). We will include statistical significance testing (e.g., one-sample t-test against zero lead time) and perform sensitivity analysis by varying the sliding-window length and DMD rank, showing the range of observed lead times. These additions will be incorporated into the abstract and results sections. revision: yes
- Comparison to measured traces from operating hyperscale AI data centers, due to lack of access to such proprietary data.
Circularity Check
No significant circularity
full rationale
The paper applies Dynamic Mode Decomposition directly to the time series of pairwise correlation coefficients extracted from the RTDS testbed simulation driven by the chosen synthetic workloads. The recovered modes and the modal growth indicator are computed outputs of that decomposition; the reported 4 s lead relative to coherence peaks is an observed property of the same simulated trajectories rather than a fitted parameter renamed as a prediction or a quantity defined in terms of itself. No self-citation chain, ansatz smuggling, or uniqueness theorem is invoked to force the central result. The derivation therefore remains self-contained against the external benchmark of the IEEE 39-bus RTDS setup.
Axiom & Free-Parameter Ledger
axioms (1)
- domain assumption Dynamic Mode Decomposition extracts physically meaningful modes from time series of pairwise correlation coefficients without requiring stationarity
Reference graph
Works this paper leans on
-
[1]
2024 United States Data Center Energy Usage Report,
A. Shehabi, A. Newkirk, S. J. Smith, A. Hubbard, N. Lei, M. A. B. Siddik, B. Holecek, J. Koomey, E. Masanet, and D. Sartor, “2024 United States Data Center Energy Usage Report,” tech. rep., Lawrence Berkeley National Laboratory, Berkeley, CA, Dec. 2024. Energy Analysis and Environmental Impacts Division
2024
-
[2]
Characteristics and Risks of Emerging Large Loads: Large Loads Task Force White Paper,
NERC, “Characteristics and Risks of Emerging Large Loads: Large Loads Task Force White Paper,” tech. rep., NERC, jul 2025
2025
-
[3]
Modeling and stability issues of voltage- source converter-dominated power systems: A review,
L. Xiong, X. Liu, Y . Liu, and F. Zhuo, “Modeling and stability issues of voltage- source converter-dominated power systems: A review,”CSEE Journal of Power and Energy Systems, vol. 8, no. 6, pp. 1530–1549, 2020
2020
-
[4]
AI for the grid and AI on the grid: Implications, challenges and opportunities,
B. Cheng, A. Botterud, T. Levin, S. Nadarajah, D. Zhao, and J. Kwon, “AI for the grid and AI on the grid: Implications, challenges and opportunities,”The Electricity Journal, vol. 39, no. 2, p. 107547, 2026
2026
-
[5]
A review of power system chal- lenges stemming from large ai data center loads,
V . R. Seshmasetti, A. Ismail, and H. M. Khalid, “A review of power system chal- lenges stemming from large ai data center loads,” in2025 IEEE PES Conference on Innovative Smart Grid Technologies - Middle East, pp. 1–5, 2025
2025
-
[6]
Understanding the inception of 14.7 Hz oscillations emerging from a data center,
C. Mishra, L. Vanfretti, J. Delaree Jr, T. Purcell, and K. D. Jones, “Understanding the inception of 14.7 Hz oscillations emerging from a data center,”Sustainable Energy, Grids and Networks, p. 101735, 2025
2025
-
[7]
Wide-area power system oscillations from large-scale AI workloads,
M.-S. Ko and H. Zhu, “Wide-area power system oscillations from large-scale AI workloads,”IEEE Transactions on Power Systems, pp. 1–14, 2026
2026
-
[8]
K.-B. Kwon, S. Mukherjee, and V . Adetola, “Operational Risks in Grid Integration of Large Data Center Loads: Characteristics, Stability Assessments, and Sensitivity Studies,”arXiv:2510.05437, 2025
-
[9]
Exploring the ai electricity crisis scenario: A case study of texas-ercot,
R. Paccou and F. Wijnhoven, “Exploring the ai electricity crisis scenario: A case study of texas-ercot,”Next Energy, vol. 8, p. 100341, 2025
2025
-
[10]
Spatial load correlation in AI data-center-dominated power systems,
C. Chaudhary, A. Abdelkader, Y . Pei, M. Ben-Idris, and J. Mitra, “Spatial load correlation in AI data-center-dominated power systems,” inProc. 2026 IEEE Power & Energy Society General Meeting (PES GM), (Montréal, QC, Canada), July 2026
2026
-
[11]
Impact of data center load modeling on power system stability,
C. Chaudhary, A. Abdelkader, M. Egan, E. Udren, M. Benidris, and J. Mitra, “Impact of data center load modeling on power system stability,” inGrid of the Future Symposium, CIGRE US, (Denver, Colorado, USA), Nov. 2025
2025
-
[12]
Characterizing the Efficiency of Distributed Training: A Power, Performance, and Thermal Perspective,
S. Go, J. Park, S. More, H. Wu, I. Wang, A. Jezghani, T. Krishna, and D. Mahajan, “Characterizing the Efficiency of Distributed Training: A Power, Performance, and Thermal Perspective,” inProceedings of the 58th IEEE/ACM International Symposium on Microarchitecture®, pp. 626–642, 2025
2025
-
[13]
The unseen AI disruptions for power grids: LLM-induced transients,
Y . Li, M. Mughees, Y . Chen, and Y . R. Li, “The unseen AI disruptions for power grids: Llm-induced transients,”arXiv:2409.11416, 2024
-
[14]
Resource adequacy risk in correlated large loads,
C. Chaudhary, A. Abdelkader, M. Ben-Idris, and J. Mitra, “Resource adequacy risk in correlated large loads,” inProc. IEEE Int. Conf. on Probabilistic Methods Applied to Power Systems (PMAPS), (Salt Lake City, UT, USA), Sept. 2026. Preprint: https://doi.org/10.13140/RG.2.2.35227.02087
-
[15]
J. S. Bendat and A. G. Piersol,Random data: analysis and measurement proce- dures. John Wiley & Sons, 2011
2011
-
[16]
Application of prony analysis to the determination of modal content and equivalent models for measured power system response,
J. Hauer, “Application of prony analysis to the determination of modal content and equivalent models for measured power system response,”IEEE Transactions on Power Systems, vol. 6, no. 3, pp. 1062–1068, 2002
2002
-
[17]
Practical implementation and operational experience of dynamic mode decomposition in wide-area moni- toring systems of italian power system,
A. Vicario, A. Berizzi, G. M. Giannuzzi, and C. Pisani, “Practical implementation and operational experience of dynamic mode decomposition in wide-area moni- toring systems of italian power system,”Journal of Modern Power Systems and Clean Energy, vol. 11, no. 3, pp. 793–802, 2023
2023
-
[18]
Explainable correlation-based anomaly detection for industrial control systems,
E. Birihanu and I. Lendák, “Explainable correlation-based anomaly detection for industrial control systems,”Frontiers in Artificial Intelligence, vol. 7, p. 1508821, 2025
2025
-
[19]
Dynamic mode decomposition of numerical and experimental data,
P. J. Schmid, “Dynamic mode decomposition of numerical and experimental data,” Journal of fluid mechanics, vol. 656, pp. 5–28, 2010
2010
-
[20]
J. N. Kutz, S. L. Brunton, B. W. Brunton, and J. L. Proctor,Dynamic mode decomposition: data-driven modeling of complex systems. SIAM, 2016
2016
-
[21]
On dynamic mode decomposition: Theory and applications,
J. H. Tu, C. W. Rowley, D. M. Luchtenburg, S. L. Brunton, and J. N. Kutz, “On dynamic mode decomposition: Theory and applications,”Journal of Computational Dynamics, vol. 1, no. 2, pp. 391–421, 2014
2014
-
[22]
S. L. Brunton and J. N. Kutz,Data-Driven Science and Engineering: Machine Learning, Dynamical Systems, and Control. Cambridge University Press, 2 ed., 2022
2022
-
[23]
The Ornstein–Uhlenbeck process as a model of a low pass filtered white noise,
E. Bibbona, G. Panfilo, and P. Tavella, “The Ornstein–Uhlenbeck process as a model of a low pass filtered white noise,”Metrologia, vol. 45, no. 6, pp. S117– S126, 2008
2008
-
[24]
IEEE standard for synchrophasor measurements for power systems,
IEEE Power and Energy Society, “IEEE standard for synchrophasor measurements for power systems,” Tech. Rep. IEEE Std C37.118.1-2011, IEEE, Piscataway, NJ, USA, 2011
2011
discussion (0)
Sign in with ORCID, Apple, or X to comment. Anyone can read and Pith papers without signing in.