REVIEW 3 major objections 4 minor 67 references
Exploring the link between galaxy assembly and dark matter halo assembly in IllustrisTNG: Insights from the Mutual Information
T0 review · 3 major / 4 minor · reviewed 2026-08-08 · deepseek-v4-flash
Pith's one-line read Using mutual information on the IllustrisTNG simulation, this paper argues that galaxy formation efficiency F⋆ = log10(M⋆/Mh) is a more sensitive tracer of dark matter halo assembly time than colour, sSFR, or cluster observables, for…
desk verdict The F*–zH MI is largely Mh–zH in disguise, and the paper's own inset admits it; the abstract's 'sensitive indicator' claim is overstated, but the descriptive MI ranking is a legitimate contribution. read the letter →
The pith
A machine-rendered reading of the paper's core claim, the machinery that carries it, and where it could break.
The reading
What carries the argument
The central object is the mutual information MI($x, z_H$) between a galaxy property $x$ and the halo assembly time $z_H$, estimated with the GMM-MI procedure, which fits Gaussian Mixture Models to the joint distribution and uses bootstrap resampling for uncertainties; unlike Pearson correlation, it captures any nonlinear dependence. The target variable $z_H$ is defined as the redshift at which a halo's main branch reaches half of its $z=0$ mass, tracked through subhalo merger trees. The winning property is $F_\star = \log_{10}(M_\star/M_h)$, the galaxy formation efficiency, compared against galaxy assembly time $z_G$, colour $(g-i)$, sSFR, and cluster observables (magnitude gap, satellite distances, and richness) in stellar-mass bins.
What would settle it
Compute MI($F_\star, z_H$) within narrow bins of halo mass, or the conditional MI($F_\star, z_H\mid M_h$), for central galaxies below $10^{10.25}\,h^{-1}M_\odot$; if it drops to the level of colour or sSFR, the claim that $F_\star$ is a more sensitive independent indicator fails. The equivalent observational check is to build group catalogues with weak-lensing halo masses and see whether $F_\star$ beats colour at fixed $M_h$.
Extended reading notes
Core claim
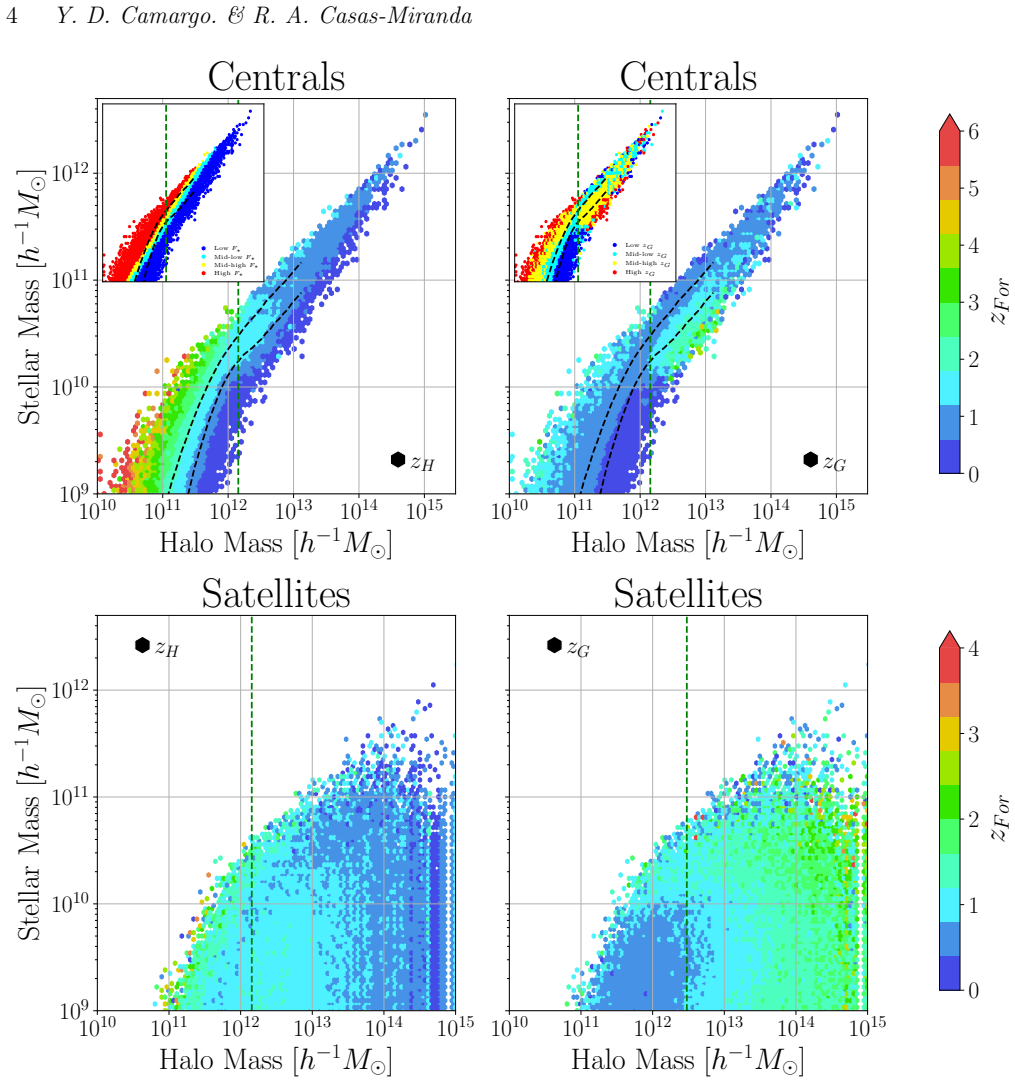
The central claim is that mutual information analysis of the TNG300-1 sample establishes $F_\star$ as a more sensitive indicator of halo assembly history than colour, sSFR, or cluster observables. For central galaxies with stellar masses up to about $10^{10.25}\,h^{-1}M_\odot$, MI($F_\star, z_H$) rises from $0.38$ to $0.43$ nats with a Pearson coefficient of $0.6$–$0.8$, whereas MI for $(g-i)$ peaks near $0.18$ nats and sSFR is effectively negligible. The authors interpret the signal as a co-evolutionary imprint: in low-mass haloes, gas accretion and supernova-regulated star formation tie the growth of the central galaxy to the assembly of the halo. The correlation weakens above the characteristic stellar mass, where AGN feedback and mergers dominate, and it disappears for satellites, where environmental quenching decouples galaxy properties from host-halo history. Among cluster observables, richness is the only quantity whose information about $z_H$ grows with stellar mass, consistent with satellite accretion dominating the late growth of massive haloes. The paper also reports that for lower-mass galaxies the $F_\star$–$z_H$ correlation appears primarily driven by the known halo mass–$z_H$ correlation, which is the main internal caveat to the claim of independence.
Load-bearing premise
The load-bearing premise is that $F_\star$'s strong mutual information with halo assembly time is a genuine, independent imprint of assembly history, but the paper itself notes that for lower-mass galaxies this correlation appears primarily driven by the known correlation between halo mass and halo assembly time.
Editorial extensions
If this is right
- For central galaxies below about $10^{10.25}\,h^{-1}M_\odot$, $F_\star$ provides a stronger statistical handle on halo assembly time than colour or sSFR, with mutual information reaching $0.38$–$0.43$ nats and a Pearson correlation of $0.6$–$0.8$.
- Standard age-distribution matching proxies, colour and sSFR, carry less than half the information about $z_H$ in this mass range, so models that map colour or sSFR to halo age will be weak tracers of assembly history.
- Satellite galaxy properties carry almost no information about host-halo assembly time, meaning environmental processing erases the assembly-time signal and assembly-bias studies should avoid satellites as halo-age proxies.
- Among cluster observables, richness is the only quantity whose information about $z_H$ grows with stellar mass, pointing to satellite accretion as the dominant growth channel of massive haloes.
- The decline of the $F_\star$–$z_H$ correlation above about $10^{10.25}\,h^{-1}M_\odot$ marks the mass scale where AGN feedback and mergers start to dominate over the assembly-time signal.
Reading between the lines
- The paper does not report mutual information conditioned on halo mass, so its headline claim is not yet fully separated from the known halo mass–assembly time relation; a conditional-MI test would settle whether $F_\star$ adds independent information.
- An observational programme could estimate $F_\star$ from weak-lensing halo masses plus stellar masses in group catalogues and test the same ranking; if it holds, $F_\star$ should outperform the magnitude gap as a halo-age proxy at fixed stellar mass.
- The same MI machinery could rank other observables, such as morphology, central velocity dispersion, size, or environment density, against $z_H$, extending the search for a robust assembly-history tracer.
- Because assembly time is defined as the half-mass redshift, the ranking of proxies might shift if a different formation threshold such as $z_{25}$ or $z_{75}$ were used; that would test whether the $F_\star$ advantage is robust to the definition.
Editorial analysis
A structured set of objections, weighed in public.
Referee Report
Summary. This paper uses the GMM-MI estimator of mutual information (MI) to quantify, in the IllustrisTNG TNG300-1 simulation, how strongly several galaxy properties (assembly time zG, colour g-i, specific star formation rate, and galaxy formation efficiency F_star = log10(M_star/M_h)) correlate with host dark matter halo assembly time zH, for central and satellite galaxies in stellar mass bins from 10^9 to 10^11.5 h^-1 M_sun. It also measures MI between zH and cluster observables (magnitude gap, satellite distances, richness). The central claim is that F_star is a more sensitive indicator of halo assembly history than colour, sSFR, or cluster observables, based on MI values of 0.38-0.43 nats for low-mass central galaxies versus values below about 0.18 nats for colour and sSFR.
Significance. If the claims were fully supported, the paper would provide a useful observational proxy for halo assembly history, relevant to assembly-bias studies and the galaxy-halo connection. The authors adopt a careful MI estimation approach (GMM-MI with bootstrap uncertainties), use a public simulation with open data, and report error bars candidly, including large uncertainties at high stellar masses. However, the headline 'more sensitive indicator' conclusion is currently undercut by a definitional confound: F_star contains halo mass by construction, and within the narrow stellar mass bins used, F_star is essentially -log10 M_h plus a constant. The paper itself concedes in Section 4 (inset to Fig. 4) that the F_star-zH correlation is primarily driven by the halo mass-zH correlation. Because this concession is about the central claim, the paper requires additional analysis (e.g., conditional MI at fixed M_h, or an explicit M_h-based baseline) before the main conclusion can be accepted.
major comments (3)
- [Section 4, Figure 4 inset; also Section 2] The central claim that F_star is 'a more sensitive indicator of halo assembly history than colour (g-i), sSFR, or cluster observables' is not supported by the reported statistic. Since F_star is defined as log10(M_star/M_h) (Section 2) and the analysis is performed in narrow stellar mass bins, within a bin F_star is approximately -log10 M_h plus a small scatter from M_star. The measured I(F_star; zH) therefore largely restates the known anti-correlation between halo mass and halo assembly time in this mass range. The authors themselves state in the text accompanying the inset of Figure 4: 'The observed correlation between F_star and zH for lower-mass galaxies appears to be primarily driven by the correlation between the halo mass and the halo assembly time in this mass range.' To establish F_star as an informative, non-redundant indicator, the authors must either report the conditional MI I(F_star; zH | M_h) or a partial-correlation test against M_h, or explicitly compare I(F_star; zH) with I(M_h; zH) and show that F_star adds information beyond halo mass. Without such a test, the 'sensitive indicator' claim is confounded.
- [Section 4, Figures 3 and 4] The comparison between F_star and the baryonic properties (colour and sSFR) is asymmetric. Colour and sSFR do not contain M_h by construction, whereas F_star is a rescaled halo mass. Even if the reported MI values are correct, a larger MI for F_star than for colour or sSFR does not demonstrate that F_star is a better observational proxy for zH; it only demonstrates that F_star inherits the halo mass-zH correlation. The paper should compute an equally constructed quantity, such as the MI between a pure baryonic efficiency measure and zH at fixed M_h, or should normalize all MI values by the entropy of the respective galaxy property, to make the 'more sensitive' ranking meaningful.
- [Section 4 and Appendix B] The MI values for different galaxy properties are compared directly in nats, but MI is not invariant to the marginal distributions of the variables. A property with a larger dynamic range or variance can produce a larger MI even if the underlying dependence is equally strong. The paper does not report normalized MI (e.g., MI divided by the entropy of the property) nor a null/shuffled baseline to establish the scale of 'significant' MI for each panel. Without this, the quantitative ranking of F_star against colour and sSFR is not yet established, particularly given the large error bars acknowledged at higher stellar masses.
minor comments (4)
- [Abstract and Section 5] The phrase 'strong correlation' is used repeatedly for MI values around 0.35-0.43 nats, but the paper does not calibrate what a 'strong' MI is in this context; a null-baseline comparison would help the reader interpret these numbers.
- [Section 4, Figure 5 description] In the text describing Figure 5, the inequality '0.8 <= r_x,y <= 0.6' is internally inconsistent; it should presumably read 0.6 <= r_x,y <= 0.8, or the intended range should be stated precisely.
- [Figures 3 and 4] The horizontal axis labels in Figures 3 and 4 read 'ZF or' instead of 'z_F or' or a clear label; these are likely typos and should be corrected.
- [References] Several references are incomplete: Montero-Dorta et al. (2020) has no volume or page, and Niemiec et al. (2022) is also missing publication details. The reference list should be checked for consistency with the journal style.
Circularity Check
No significant circularity: the mutual information values are measured from simulation data, and the paper explicitly discloses the halo-mass-driven contribution to the F_star–z_H correlation.
full rationale
The paper contains no derivation chain that reduces to its own inputs. The MI values are empirical estimates from IllustrisTNG using GMM-MI, with no free parameter fitted to the target quantity and no load-bearing self-citation. The only definitional concern is that F_star = log10(M_star/M_h) (Section 2) and the analysis is binned by M_star, so within a bin F_star is essentially a decreasing function of M_h; consequently I(F_star; z_H) partly restates the well-known M_h–z_H correlation. The paper itself acknowledges this in the Figure 4 inset: 'The observed correlation between F_star and z_H for lower-mass galaxies appears to be primarily driven by the correlation between the halo mass and the halo assembly time in this mass range.' That admission makes the comparison with colour and sSFR scientifically asymmetric, but it does not make the measured MI circular by construction: no prediction is generated from an equation that assumes the result, and no fitted value is renamed as an independent finding. The 'more sensitive indicator' conclusion is an interpretation that may overreach because of this confound, but overreach due to a confound is a correctness risk, not circularity. The statistical analysis is self-contained and uses public simulation data, so the circularity score is 0.
Assumptions & free parameters
free parameters (2)
- Stellar mass bin width =
0.25 dex
- Minimum galaxies per bin =
1000
assumptions (4)
- domain assumption IllustrisTNG TNG300-1 is a faithful representation of galaxy formation physics
- domain assumption Assembly time as redshift of half-mass is a meaningful proxy for formation history
- domain assumption GMM-MI with bootstrap provides unbiased MI estimates
- domain assumption Sample selection does not introduce selection bias in MI comparisons
Cite this review
Pith. "Pith review of Exploring the link between galaxy assembly and dark matter halo assembly in IllustrisTNG: Insights from the Mutual Information." pith.science (2026). https://pith.science/paper/LNOVL2QI
@misc{pith2026250206077,
  author       = {Pith},
  title        = {Pith review of: Exploring the link between galaxy assembly and dark matter halo assembly in IllustrisTNG: Insights from the Mutual Information},
  year         = {2026},
  howpublished = {\url{https://pith.science/paper/LNOVL2QI}},
  note         = {Machine review of arXiv:2502.06077}
}
abstract
We employed Mutual Information (MI) analysis to investigate the relationship between galaxy properties and the assembly history of their host dark matter (DM) haloes from the IllustrisTNG simulations. Focusing on central and satellite galaxies with stellar masses between $10^{9} \, - \, 10^{11.5}\, h^{-1} M_\odot$, we examined the correlation between halo assembly time and galaxy assembly time, specific star formation rate (sSFR), color $(g-i)$, and galaxy formation efficiency $F_\star$. Our results indicate a strong correlation between $F_\star$ and the halo assembly time for low-mass central galaxies, suggesting a co-evolutionary relationship. In contrast, sSFR and color $(g-i)$ exhibit weaker correlations with halo assembly time, indicating that additional factors should influence these galaxy properties. Satellite galaxies show negligible correlation between their properties and halo assembly time, highlighting the impact of environmental processes on their evolution. We further extended our analysis to cluster observables, including the magnitude gap, the satellite richness, and the distances to the satellites. Although these cluster properties display weak overall correlations with halo assembly time, the richness consistently increases with stellar mass. This trend suggests that richness is more closely linked to formation history in more massive haloes, where satellite accretion dominates the growth of their host DM haloes. These findings establish $F_\star$ as a more sensitive indicator of halo assembly history than colour $(g-i)$, sSFR, or cluster observables, offering new insights into the complex interplay between galaxy evolution and the hierarchical growth of their host dark matter haloes.
Figures


Figures from the paper (4 more)


Reference graph
Works this paper leans on
-
[1]
Artale M. C., Zehavi I., Contreras S., Norberg P., 2018, @doi [ ] 10.1093/mnras/sty2110 , https://ui.adsabs.harvard.edu/abs/2018MNRAS.480.3978A 480, 3978
-
[2]
Behroozi P., Wechsler R. H., Hearin A. P., Conroy C., 2019, @doi [ ] 10.1093/mnras/stz1182 , https://ui.adsabs.harvard.edu/abs/2019MNRAS.488.3143B 488, 3143
-
[3]
The galaxy-halo connection of DESI luminous red galaxies with subhalo abundance matching
Berti A. M., Dawson K. S., Dominguez W., 2023, @doi [arXiv e-prints] 10.48550/arXiv.2303.16096 , https://ui.adsabs.harvard.edu/abs/2023arXiv230316096B p. arXiv:2303.16096
work page Pith review arXiv doi:10.48550/arxiv.2303.16096 2023
-
[4]
Bhattacharjee S., Pandey B., Sarkar S., 2020, @doi [ ] 10.1088/1475-7516/2020/09/039 , https://ui.adsabs.harvard.edu/abs/2020JCAP...09..039B 2020, 039
-
[5]
Bose S., Eisenstein D. J., Hernquist L., Pillepich A., Nelson D., Marinacci F., Springel V., Vogelsberger M., 2019, @doi [ ] 10.1093/mnras/stz2546 , https://ui.adsabs.harvard.edu/abs/2019MNRAS.490.5693B 490, 5693
-
[6]
Bower R. G., Schaye J., Frenk C. S., Theuns T., Schaller M., Crain R. A., McAlpine S., 2016, @doi [Monthly Notices of the Royal Astronomical Society] 10.1093/mnras/stw2735 , 465, 32
-
[7]
Busch P., White S. D. M., 2017, @doi [ ] 10.1093/mnras/stx1584 , https://ui.adsabs.harvard.edu/abs/2017MNRAS.470.4767B 470, 4767
-
[8]
Contreras S., Zehavi I., Padilla N., Baugh C. M., Jim \'e nez E., Lacerna I., 2019, @doi [ ] 10.1093/mnras/stz018 , https://ui.adsabs.harvard.edu/abs/2019MNRAS.484.1133C 484, 1133
Show all 67 references
-
[9]
J., Gao L., White S
Croton D. J., Gao L., White S. D. M., 2007, @doi [mnras] 10.1111/j.1365-2966.2006.11230.x , http://adsabs.harvard.edu/abs/2007MNRAS.374.1303C 374, 1303
2007
-
[10]
A., Angl \'e s-Alc \'a zar D., Yang X., 2021, @doi [Nature Astronomy] 10.1038/s41550-021-01404-1 , https://ui.adsabs.harvard.edu/abs/2021NatAs...5.1069C 5, 1069
Cui W., Dav \'e R., Peacock J. A., Angl \'e s-Alc \'a zar D., Yang X., 2021, @doi [Nature Astronomy] 10.1038/s41550-021-01404-1 , https://ui.adsabs.harvard.edu/abs/2021NatAs...5.1069C 5, 1069
2021 doi
-
[11]
Dekel A., Silk J., 1986, @doi [ ] 10.1086/164050 , https://ui.adsabs.harvard.edu/abs/1986ApJ...303...39D 303, 39
1986 doi
-
[12]
Dvornik A., et al., 2017, @doi [ ] 10.1093/mnras/stx705 , https://ui.adsabs.harvard.edu/abs/2017MNRAS.468.3251D 468, 3251
2017 doi
-
[13]
Farahi A., Ho M., Trac H., 2020, @doi [ ] 10.1093/mnras/staa291 , https://ui.adsabs.harvard.edu/abs/2020MNRAS.493.1361F 493, 1361
2020 doi
-
[14]
Gao L., Springel V., White S. D. M., 2005, @doi [ ] 10.1111/j.1745-3933.2005.00084.x , https://ui.adsabs.harvard.edu/abs/2005MNRAS.363L..66G 363, L66
2005
-
[15]
Gu M., Conroy C., Behroozi P., 2016, @doi [ ] 10.3847/0004-637X/833/1/2 , https://ui.adsabs.harvard.edu/abs/2016ApJ...833....2G 833, 2
2016 doi
-
[16]
P., Watson D
Hearin A. P., Watson D. F., 2013, Monthly Notices of the Royal Astronomical Society, 435, 1313
2013
-
[17]
P., Watson D
Hearin A. P., Watson D. F., Becker M. R., Reyes R., Berlind A. A., Zentner A. R., 2014, @doi [ ] 10.1093/mnras/stu1443 , https://ui.adsabs.harvard.edu/abs/2014MNRAS.444..729H 444, 729
2014 doi
-
[18]
M., Pasquali A., Pacifici C., Engler C., Pillepich A., Grebel E
Jackson T. M., Pasquali A., Pacifici C., Engler C., Pillepich A., Grebel E. K., 2020, @doi [ ] 10.1093/mnras/staa2306 , https://ui.adsabs.harvard.edu/abs/2020MNRAS.497.4262J 497, 4262
2020 doi
-
[19]
K., 2014, @doi [ ] 10.1088/0004-637X/794/1/74 , https://ui.adsabs.harvard.edu/abs/2014ApJ...794...74J 794, 74
Jung I., Lee J., Yi S. K., 2014, @doi [ ] 10.1088/0004-637X/794/1/74 , https://ui.adsabs.harvard.edu/abs/2014ApJ...794...74J 794, 74
2014 doi
-
[20]
B., Atwal G
Kinney J. B., Atwal G. S., 2014, @doi [Proceedings of the National Academy of Sciences] 10.1073/pnas.1309933111 , 111, 3354
2014 doi
-
[21]
Lacerna I., Padilla N., Stasyszyn F., 2014, @doi [ ] 10.1093/mnras/stu1318 , https://ui.adsabs.harvard.edu/abs/2014MNRAS.443.3107L 443, 3107
2014 doi
-
[23]
H., Mo H., Wang H., Yang X., 2016, @doi [Monthly Notices of the Royal Astronomical Society] 10.1093/mnras/stv2282
Lim S. H., Mo H., Wang H., Yang X., 2016, @doi [Monthly Notices of the Royal Astronomical Society] 10.1093/mnras/stv2282
2016 doi
-
[24]
Lin Y.-T., Mandelbaum R., Huang Y.-H., Huang H.-J., Dalal N., Diemer B., Jian H.-Y., Kravtsov A., 2016, @doi [ ] 10.3847/0004-637X/819/2/119 , https://ui.adsabs.harvard.edu/abs/2016ApJ...819..119L 819, 119
2016 doi
-
[25]
J., Lu Y., 2015, @doi [ ] 10.1093/mnras/stv671 , https://ui.adsabs.harvard.edu/abs/2015MNRAS.450..606L 450, 606
Lu Z., Mo H. J., Lu Y., 2015, @doi [ ] 10.1093/mnras/stv671 , https://ui.adsabs.harvard.edu/abs/2015MNRAS.450..606L 450, 606
2015 doi
-
[26]
V., Pontzen A., Nord B., Thiyagalingam J., Piras D., 2022, @doi [ ] 10.1103/PhysRevD.105.103533 , https://ui.adsabs.harvard.edu/abs/2022PhRvD.105j3533L 105, 103533
Lucie-Smith L., Peiris H. V., Pontzen A., Nord B., Thiyagalingam J., Piras D., 2022, @doi [ ] 10.1103/PhysRevD.105.103533 , https://ui.adsabs.harvard.edu/abs/2022PhRvD.105j3533L 105, 103533
2022 doi
-
[27]
H., Marinacci F., Hernquist L., 2020, @doi [ ] 10.1093/mnras/stz3418 , https://ui.adsabs.harvard.edu/abs/2020MNRAS.491.5747M 491, 5747
Martizzi D., Vogelsberger M., Torrey P., Pillepich A., Hansen S. H., Marinacci F., Hernquist L., 2020, @doi [ ] 10.1093/mnras/stz3418 , https://ui.adsabs.harvard.edu/abs/2020MNRAS.491.5747M 491, 5747
2020 doi
-
[28]
A., Schaller M., Bower R., Theuns T., 2017, @doi [ ] 10.1093/mnras/stw2884 , https://ui.adsabs.harvard.edu/abs/2017MNRAS.465.2381M 465, 2381
Matthee J., Schaye J., Crain R. A., Schaller M., Bower R., Theuns T., 2017, @doi [ ] 10.1093/mnras/stw2884 , https://ui.adsabs.harvard.edu/abs/2017MNRAS.465.2381M 465, 2381
2017 doi
-
[29]
Oxford University Press, Inc., USA
Mezard M., Montanari A., 2009, Information, Physics, and Computation. Oxford University Press, Inc., USA
2009
-
[30]
N., Mandelbaum R., Rykoff E
Miyatake H., More S., Takada M., Spergel D. N., Mandelbaum R., Rykoff E. S., Rozo E., 2016, @doi [Physical Review Letters] 10.1103/PhysRevLett.116.041301 , http://adsabs.harvard.edu/abs/2016PhRvL.116d1301M 116, 041301
2016 doi
-
[31]
D., et al., 2020, @doi [ ] 10.1093/mnras/staa1624 , https://ui.adsabs.harvard.edu/abs/2020MNRAS.tmp.1844M
Montero-Dorta A. D., et al., 2020, @doi [ ] 10.1093/mnras/staa1624 , https://ui.adsabs.harvard.edu/abs/2020MNRAS.tmp.1844M
2020 doi
-
[32]
D., Chaves-Montero J., Artale M
Montero-Dorta A. D., Chaves-Montero J., Artale M. C., Favole G., 2021, @doi [ ] 10.1093/mnras/stab2556 , https://ui.adsabs.harvard.edu/abs/2021MNRAS.508..940M 508, 940
2021 doi
-
[33]
P., Naab T., White S
Moster B. P., Naab T., White S. D. M., 2020, @doi [ ] 10.1093/mnras/staa3019 , https://ui.adsabs.harvard.edu/abs/2020MNRAS.499.4748M 499, 4748
2020 doi
-
[34]
Naree N., Muanwong O., 2023, @doi [Journal of Physics: Conference Series] 10.1088/1742-6596/2431/1/012083 , 2431, 012083
2023 doi
-
[35]
Nelson D., et al., 2019, @doi [Computational Astrophysics and Cosmology] 10.1186/s40668-019-0028-x , https://ui.adsabs.harvard.edu/abs/2019ComAC...6....2N 6, 2
2019 doi
-
[36]
Niemiec A., et al., 2018, @doi [ ] 10.1093/mnrasl/sly041 , https://ui.adsabs.harvard.edu/abs/2018MNRAS.477L...1N 477, L1
2018 doi
-
[37]
Niemiec A., Giocoli C., Cohen E., Jauzac M., Jullo E., Limousin M., 2022, @doi [ ] 10.1093/mnras/stac832 , https://ui.adsabs.harvard.edu/abs/2022MNRAS.tmp..806N
2022 doi
-
[38]
D., Dav \'e R., 2008, @doi [ ] 10.1111/j.1365-2966.2008.13280.x , https://ui.adsabs.harvard.edu/abs/2008MNRAS.387..577O 387, 577
Oppenheimer B. D., Dav \'e R., 2008, @doi [ ] 10.1111/j.1365-2966.2008.13280.x , https://ui.adsabs.harvard.edu/abs/2008MNRAS.387..577O 387, 577
2008
-
[39]
Pandey B., 2017, @doi [ ] 10.1093/mnrasl/slx109 , https://ui.adsabs.harvard.edu/abs/2017MNRAS.471L..77P 471, L77
2017 doi
-
[40]
V., Pontzen A., Lucie-Smith L., Guo N., Nord B., 2023, @doi [Machine Learning: Science and Technology] 10.1088/2632-2153/acc444 , 4, 025006
Piras D., Peiris H. V., Pontzen A., Lucie-Smith L., Guo N., Nord B., 2023, @doi [Machine Learning: Science and Technology] 10.1088/2632-2153/acc444 , 4, 025006
2023 doi
-
[41]
Planck Collaboration et al., 2016, @doi [ ] 10.1051/0004-6361/201525830 , https://ui.adsabs.harvard.edu/abs/2016A&A...594A..13P 594, A13
2016 doi
-
[42]
Rodriguez-Gomez V., et al., 2015, @doi [ ] 10.1093/mnras/stv264 , https://ui.adsabs.harvard.edu/abs/2015MNRAS.449...49R 449, 49
2015 doi
-
[43]
Rodr \' guez Montero F., Dav \'e R., Wild V., Angl \'e s-Alc \'a zar D., Narayanan D., 2019, @doi [ ] 10.1093/mnras/stz2580 , https://ui.adsabs.harvard.edu/abs/2019MNRAS.490.2139R 490, 2139
2019 doi
-
[44]
N., Maller A
Salcedo A. N., Maller A. H., Berlind A. A., Sinha M., McBride C. K., Behroozi P. S., Wechsler R. H., Weinberg D. H., 2018, Monthly Notices of the Royal Astronomical Society, 475, 4411
2018
-
[45]
Sarkar S., Pandey B., 2020, @doi [ ] 10.1093/mnras/staa2236 , https://ui.adsabs.harvard.edu/abs/2020MNRAS.497.4077S 497, 4077
2020 doi
-
[46]
E., 1948, @doi [Bell System Technical Journal] https://doi.org/10.1002/j.1538-7305.1948.tb01338.x , 27, 379
Shannon C. E., 1948, @doi [Bell System Technical Journal] https://doi.org/10.1002/j.1538-7305.1948.tb01338.x , 27, 379
1948
-
[47]
Springel V., 2010, @doi [ ] 10.1111/j.1365-2966.2009.15715.x , https://ui.adsabs.harvard.edu/abs/2010MNRAS.401..791S 401, 791
2010
-
[48]
Springel V., et al., 2018, @doi [mnras] 10.1093/mnras/stx3304 , http://adsabs.harvard.edu/abs/2018MNRAS.475..676S 475, 676
2018 doi
- [49]
-
[50]
Sunayama T., More S., 2019, @doi [ ] 10.1093/mnras/stz2832 , https://ui.adsabs.harvard.edu/abs/2019MNRAS.490.4945S 490, 4945
2019 doi
-
[51]
arXiv:2205.03277
Sunayama T., More S., Miyatake H., 2022, arXiv e-prints, https://ui.adsabs.harvard.edu/abs/2022arXiv220503277S p. arXiv:2205.03277
2022 arXiv
-
[52]
Thomas N., Dav \'e R., Angl \'e s-Alc \'a zar D., Jarvis M., 2019, @doi [ ] 10.1093/mnras/stz1703 , https://ui.adsabs.harvard.edu/abs/2019MNRAS.487.5764T 487, 5764
2019 doi
-
[53]
L., Wetzel A
Tinker J. L., Wetzel A. R., Conroy C., Mao Y.-Y., 2017, @doi [mnras] 10.1093/mnras/stx2066 , http://adsabs.harvard.edu/abs/2017MNRAS.472.2504T 472, 2504
2017 doi
-
[54]
L., Hahn C., Mao Y.-Y., Wetzel A
Tinker J. L., Hahn C., Mao Y.-Y., Wetzel A. R., 2018, @doi [ ] 10.1093/mnras/sty1263 , https://ui.adsabs.harvard.edu/abs/2018MNRAS.478.4487T 478, 4487
2018 doi
- [55]
-
[56]
Z., Cypriano E
Vitorelli A. Z., Cypriano E. S., Makler M., Pereira M. E. S., Erben T., Moraes B., 2018, @doi [ ] 10.1093/mnras/stx2791 , https://ui.adsabs.harvard.edu/abs/2018MNRAS.474..866V 474, 866
2018 doi
-
[57]
Vogelsberger M., et al., 2014, @doi [mnras] 10.1093/mnras/stu1536 , http://adsabs.harvard.edu/abs/2014MNRAS.444.1518V 444, 1518
2014 doi
-
[58]
J., van den Bosch F
Wang Y., Yang X., Mo H. J., van den Bosch F. C., Weinmann S. M., Chu Y., 2008, @doi [ ] 10.1086/591836 , https://ui.adsabs.harvard.edu/abs/2008ApJ...687..919W 687, 919
2008 doi
-
[59]
J., Jing Y
Wang H., Mo H. J., Jing Y. P., Yang X., Wang Y., 2011, @doi [ ] 10.1111/j.1365-2966.2011.18301.x , https://ui.adsabs.harvard.edu/abs/2011MNRAS.413.1973W 413, 1973
2011
-
[60]
H., Tinker J
Wechsler R. H., Tinker J. L., 2018, @doi [araa] 10.1146/annurev-astro-081817-051756 , https://ui.adsabs.harvard.edu/abs/2018ARA&A..56..435W 56, 435
2018 doi
-
[61]
H., Zentner A
Wechsler R. H., Zentner A. R., Bullock J. S., Kravtsov A. V., Allgood B., 2006, @doi [ ] 10.1086/507120 , https://ui.adsabs.harvard.edu/abs/2006ApJ...652...71W 652, 71
2006 doi
-
[62]
Xu X., Zheng Z., 2020, @doi [ ] 10.1093/mnras/staa009 , https://ui.adsabs.harvard.edu/abs/2020MNRAS.492.2739X 492, 2739
2020 doi
-
[63]
Xu W., et al., 2020, @doi [ ] 10.1093/mnras/staa2497 , https://ui.adsabs.harvard.edu/abs/2020MNRAS.498.1839X 498, 1839
2020 doi
-
[64]
J., van den Bosch F
Yang X., Mo H. J., van den Bosch F. C., 2006, @doi [ ] 10.1086/501069 , https://ui.adsabs.harvard.edu/abs/2006ApJ...638L..55Y 638, L55
2006 doi
-
[65]
J., Baugh C
Zehavi I., Contreras S., Padilla N., Smith N. J., Baugh C. M., Norberg P., 2018, @doi [apj] 10.3847/1538-4357/aaa54a , http://adsabs.harvard.edu/abs/2018ApJ...853...84Z 853, 84
2018 doi
-
[66]
R., Hearin A., van den Bosch F
Zentner A. R., Hearin A., van den Bosch F. C., Lange J. U., Villarreal A., 2019, @doi [ ] 10.1093/mnras/stz470 , https://ui.adsabs.harvard.edu/abs/2019MNRAS.485.1196Z 485, 1196
2019 doi
-
[67]
S., 2017, @doi [ ] 10.1093/mnras/stx1264 , https://ui.adsabs.harvard.edu/abs/2017MNRAS.470..551Z 470, 551
Zu Y., Mandelbaum R., Simet M., Rozo E., Rykoff E. S., 2017, @doi [ ] 10.1093/mnras/stx1264 , https://ui.adsabs.harvard.edu/abs/2017MNRAS.470..551Z 470, 551
2017 doi
-
[68]
write newline
" write newline "" before.all 'output.state := FUNCTION fin.entry write newline FUNCTION new.block output.state before.all = 'skip after.block 'output.state := if FUNCTION new.sentence output.state after.block = 'skip output.state before.all = 'skip after.sentence 'output.stat...
Reviewed August 8, 2026 · model on record in the stance chip above.
Discussion (0). Continue with ORCID to comment.