REVIEW 4 major objections 5 minor 59 references
Semi-analytical modeling of receive transfer function and thermal noise of integrated photonic ultrasound transducers
T0 review · 4 major / 5 minor · reviewed 2026-08-07 · deepseek-v4-flash
Pith's one-line read This paper claims that the receive transfer function and thermal-noise noise equivalent pressure of integrated photonic ultrasound transducers can be predicted semi-analytically by pairing time-domain finite-element simulation with…
desk verdict A genuinely new time-domain FEM pipeline for IPUT RTF and thermal NEP, but the central 'close match' validation fails by a factor 2–3 on the only RTF point; the framework is worth refereeing, not the current claim. read the letter →
The pith
A machine-rendered reading of the paper's core claim, the machinery that carries it, and where it could break.
The reading
What carries the argument
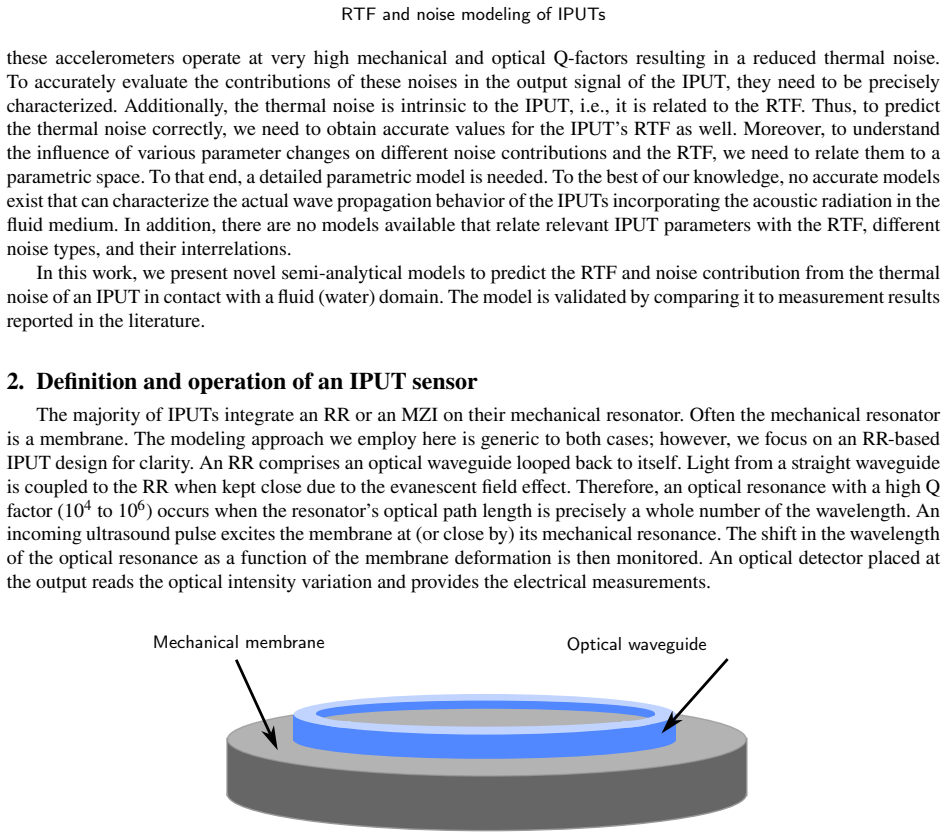
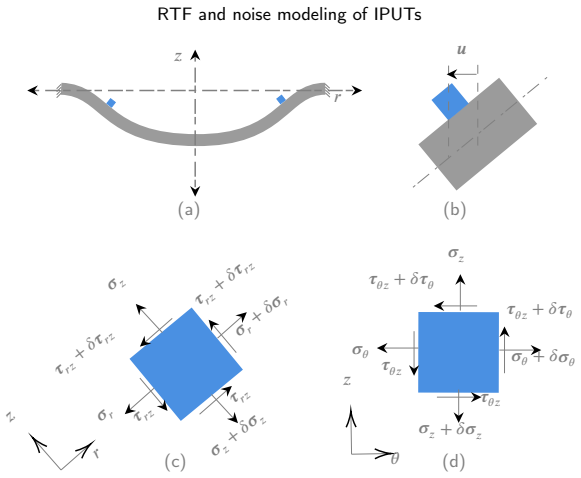
The load-bearing object is the coupled time-domain finite-element model of acoustic and elastic wave propagation in a 2D axisymmetric, and a 3D quarter-symmetric, water-membrane-waveguide domain, together with two closed-form expressions: Eq. (18) for the receive transfer function and Eq. (36) for the thermal-noise noise equivalent pressure. The finite-element step supplies the radial displacement $u$ and the stress tensor $\boldsymbol{\sigma}$ that enter the optical calculation; the effective mass $m_{\mathrm{eff}}$ absorbs the fluid loading through a mass factor, and the equipartition theorem converts the resonator's mechanical susceptibility into the thermal force spectral density $4k_B T\omega_0 m_{\mathrm{eff}}/Q$. This machinery splits the RTF into an elongation contribution and a photoelastic contribution, and it shows that both act in the same direction for the validated ring-resonator design.
What would settle it
Measure the initial stress of a fabricated IPUT membrane, for example from its resonance-frequency shift or from a separate stress characterization, include that stress as an initial condition in the same time-domain finite-element model, and check whether the predicted RTF moves from about -33 fm/Pa toward the measured 67 fm/Pa; if it does not, the prestress explanation is wrong and the model is not quantitatively predictive for real devices.
Extended reading notes
Core claim
On its own terms, the paper's central claim is that an IPUT's receive response can be written as a mechanical part, the membrane deformation under an incident pressure wave, times an optical part, the resonance-wavelength shift caused by that deformation. Equation (18) expresses the receive transfer function as $(d\lambda/dP)=\frac{\lambda}{n_g L}(n_{\mathrm{eff}}\,dL/dP + L\,dn_{\mathrm{eff}}/dP)$, where the first term is the ring-waveguide elongation and the second is the photoelastic change of the effective index; both are evaluated from the stress and displacement fields produced by a time-domain finite-element simulation of the coupled water-membrane-waveguide system. Equation (36) then multiplies this RTF by the thermal-pressure spectral density from an equipartition-based single-oscillator model to give the noise equivalent pressure in wavelength units. In the validation against the reference sensor, the modeled resonance frequency is 0.615 MHz versus 0.76 MHz measured, the modeled Q is 11.75 versus about 10 measured, the modeled RTF is -33.6 fm/Pa versus 67 fm/Pa measured in the 2D model and -22 fm/Pa in the 3D model, and the modeled thermal NEP is 0.03 Pa versus a total experimental NEP of 0.4 Pa. The paper attributes the RTF gap to prestress and fabrication-induced geometry, which it leaves out of the scope.
Load-bearing premise
The membrane is modeled with no initial stress and with nominal dimensions; the paper itself says that prestress and fabrication-induced geometry changes are beyond its scope, and invokes them to explain why the predicted receive transfer function is two to three times lower than the measured value.
Editorial extensions
If this is right
- The receive transfer function separates cleanly into an elongation term and a photoelastic term, so designers can estimate which effect dominates from the stress state of the waveguide alone.
- Because the thermal-noise NEP in wavelength units is the RTF times the thermal pressure, any error in the modeled RTF directly corrupts the predicted noise floor; an accurate acoustic model is a prerequisite for noise-limited design.
- For the validated device the modeled thermal NEP is 0.03 Pa, more than an order of magnitude below the 0.4 Pa experimental NEP, so the measured sensor's floor is set by the read-out chain rather than by thermal acoustic noise.
- The 2D axisymmetric model captures resonance frequency and Q factor well, but the 3D quarter-symmetric model is needed for the true racetrack waveguide geometry, where the RTF is about 35% lower than in 2D.
- The same semi-analytical chain can be extended to multilayer or geometrically complex membranes through a numerically computed mode shape, enabling optimization before fabrication.
Reading between the lines
- If prestress and fabrication-induced buckling were added as initial conditions in the same finite-element model, the modeled RTF would likely rise from -33.6 fm/Pa toward the measured 67 fm/Pa; this is a direct, testable extension of the paper's own hypothesis.
- The same mechanical-plus-optical decomposition should transfer to Mach-Zehnder IPUTs by replacing the ring-resonator wavelength shift with a phase shift, since the paper's mechanical model is not specific to ring resonators.
- The finding that thermal noise sits far below the measured NEP implies that near-term performance gains for IPUTs in medical ultrasound will come from lower-noise optical read-out, not from further reducing thermal acoustic noise.
- One could invert the model: because prestress shifts the resonance frequency upward, matching the modeled frequency to a measured one could serve as a non-destructive estimate of membrane tension.
Editorial analysis
A structured set of objections, weighed in public.
Referee Report
Summary. The manuscript presents a semi-analytical modeling framework for integrated photonic ultrasound transducers (IPUTs). The mechanical response is computed with time-domain finite element simulations in 2D axisymmetric and 3D configurations, including a water domain with radiation boundary conditions; the optical response is added analytically through Eq. (18), which combines waveguide elongation and photoelastic index changes into a wavelength-shift receive transfer function (RTF). A thermal-noise equivalent pressure is derived in Section 5 from equipartition, an effective-mass oscillator model, and the RTF, giving Eq. (36). The model is applied to a silicon ring-resonator IPUT from Refs. [15,59] and compared with published values of resonance frequency, Q-factor, RTF, and NEP. The paper claims a close match with literature.
Significance. The derivation is genuinely forward: no parameters are fitted to the experimental RTF or NEP, the optical indices n_eff and n_g come from a mode solver, the fluid domain is included in the time-domain simulation rather than modeled as a harmonic source, and the thermal noise is derived from the same resonator parameters as the RTF. If the validation were successful, the model would be a useful quantitative design tool for IPUT sensitivity and noise. These are real strengths. However, the central validation claim fails at the only available RTF comparison point: the modeled RTF is a factor of 2–3 below experiment, and the NEP comparison in Section 6.5 does not independently constrain the model. The disagreement is therefore not a minor presentation issue; it undermines the quantitative predictive claim made in the abstract.
major comments (4)
- [§6.2 and §6.3] The modeled RTF is -33.6 fm/Pa in the 2D axisymmetric model and -22 fm/Pa in the 3D model, while the experimental value reported in [59] is 67 fm/Pa. This is a factor of 2–3 discrepancy, and the 3D model, which uses the actual racetrack geometry, gives the larger error. These numbers do not support the abstract's statement of a 'close match'. This comparison is the load-bearing validation of the paper's central claim.
- [§6.4] The RTF discrepancy is attributed to prestress and fabrication-induced geometric variations, which are explicitly declared 'beyond the scope'. Reference [22] states that the validation device buckled under prestress. A model that excludes the stress state of the very device used for validation cannot establish quantitative predictive power. To support the validation claim, the model would need to include prestress or the claim would need to be restricted to a forward-methodology description without a quantitative validation statement.
- [§6.5] The NEP comparison does not independently validate the thermal-noise model. The measured NEP of 0.4 Pa is dominated by readout-system noise, so it does not test the predicted thermal-noise contribution of 0.03 Pa. Furthermore, Eq. (36) multiplies p_s by the RTF, so an RTF error of a factor of 2–3 translates directly into a corresponding error in the wavelength-domain NEP. The observation that the experimental NEP is above the thermal floor may be consistent with the model, but it does not confirm Eq. (36).
- [§5.1 and Eq. (22)] The effective mass is set as m_eff = 0.3 x (1 + beta) m_s, with the coefficient 0.3 adopted without derivation for this specific geometry and without sensitivity analysis. Since p_s scales as sqrt(m_eff), the NEP values in Fig. 13 depend on this choice. Because Section 6.5 provides no independent experimental confirmation of the thermal-noise prediction, this parameter should either be derived from Eq. (39) or varied to show its influence on the conclusions.
minor comments (5)
- [Eq. (16)] The expression for C2 appears to contain a typesetting error: as printed, the bracket contains a term '/2E' and the whole bracket is again divided by 2E, which is dimensionally inconsistent. Please correct and verify the stress-optic constants against Ref. [48].
- [Eqs. (33) and (34)] The first term in the denominator is written as (omega - omega_0)^2, while the second term is (omega omega_0 / Q)^2. These two terms have incompatible units; the intended expression is presumably (omega_0^2 - omega^2)^2, as in Eq. (30). Please correct this in both equations.
- [§6.2] The predicted RTF values are negative while the experimental value is quoted as positive. If the experimental value is a magnitude only, the sign convention should be stated explicitly in the comparison.
- [§6.2] The 2D axisymmetric representation uses a circular ring whose radius equals R1^WG of the racetrack, which the authors note overestimates the elongation contribution. This makes the 2D and 3D RTF values not directly comparable for validation; a brief explanation of why the 2D result is still relevant would help.
- [Abstract and Section 6.4] The phrase 'close match' in the abstract is contradicted by the factor-of-2–3 RTF discrepancy reported in Sections 6.2 and 6.3. The abstract and conclusions should be reworded to describe the results as a forward model with quantitative limitations rather than a validated close match.
Circularity Check
No significant circularity: the semi-analytical RTF and NEP models are forward derivations with independently sourced parameters, and the validation data disagree with the model rather than being fitted.
full rationale
The derivation chain is forward and self-contained. The RTF, Eq. (18), is assembled from the wavelength–length relation of Eq. (7), FEM-computed displacements and stresses, and literature photoelastic constants; n_eff and n_g are obtained from an optical mode solver, and C1, C2 come from external literature, so no parameter is fitted to the target RTF or NEP. The NEP, Eqs. (32)–(36), follows from the equipartition theorem and a harmonic-oscillator representation whose effective mass and fluid loading are taken from standard references, again not fitted to the measured noise. The experimental values used for validation come from [15,59], which share some co-authors, but the model's own outputs disagree with those experiments (RTF a factor of 2–3 lower, resonance frequency ~19% higher, Q-factor ~15% different), demonstrating that the model was not constructed to reproduce the measured result. The reference to [22] about buckling/prestress in Section 6.4 is used only to explain the observed discrepancy and is not a load-bearing part of the derivation. Thus no predicted quantity reduces by construction to its inputs, and no self-citation chain forces the claimed result. The validation mismatch and the fact that the experimental NEP is dominated by readout noise are legitimate correctness or evidence-strength concerns, but they are not circularity.
Assumptions & free parameters
free parameters (3)
- Effective mass coefficient (0.3) =
0.3
- Stress-optic constants C1, C2 =
C1=-1.25e-11 Pa^-1, C2=4.66e-12 Pa^-1
- Optical mode indices n_eff, n_g =
n_eff=2.228, n_g=4.386
assumptions (6)
- standard math Acoustic and elastic wave equations (Eqs. 1-5) govern the coupled fluid-structure response.
- domain assumption The membrane and waveguide are thin, linear structures; rotary inertia and shear deformation are neglected (Section 4).
- domain assumption The membrane's dynamic response is dominated by its fundamental mode, modeled as a weakly damped single harmonic oscillator with effective mass from [53] (Section 5).
- domain assumption The IPUT is modeled without prestress and with nominal dimensions; prestress and fabrication variations are outside scope (Section 6.4).
- domain assumption The photoelastic tensor is approximated as isotropic using only p11 and p12, since the full anisotropic tensor is unavailable (Section 4.2).
- domain assumption The waveguide is treated as a perfect ring; in the 2D axisymmetric model a circular ring with radius R1_WG is used instead of the racetrack (Section 6.3).
Cite this review
Pith. "Pith review of Semi-analytical modeling of receive transfer function and thermal noise of integrated photonic ultrasound transducers." pith.science (2026). https://pith.science/paper/LP5Z6MFK
@misc{pith2026250602817,
  author       = {Pith},
  title        = {Pith review of: Semi-analytical modeling of receive transfer function and thermal noise of integrated photonic ultrasound transducers},
  year         = {2026},
  howpublished = {\url{https://pith.science/paper/LP5Z6MFK}},
  note         = {Machine review of arXiv:2506.02817}
}
read the original abstract
Ultrasound transducers (UTs) are extensively used in several applications across a multitude of disciplines. A new type of UTs namely integrated photonic ultrasound transducers (IPUTs) possess superior performance due to the presence of optical interrogation systems, avoiding electric crosstalk and thermal electronic noise of the sensor. However, a major component of the IPUT's noise floor is its thermal acoustic noise. Several studies have been proposed to characterize IPUTs' behavior; nevertheless, these are either incomplete (model only the thermal noise) or targeted to characterize specific responses such as static behavior, in which the modeled receive transfer function (RTF) is about two orders lower than the experiments. In this study, we develop semi-analytical models based on time-domain finite element analysis and analytical expressions to characterize the RTF and thermal noise-induced noise equivalent pressure of IPUTs. We validate the models by comparing them with the literature, where we obtain a close match between them.
Figures


Figures from the paper (10 more)


Reference graph
Works this paper leans on
-
[59]
Silicon photonic micro-ring resonators to sense strain and ultrasound (ph
Wouter J Westerveld. Silicon photonic micro-ring resonators to sense strain and ultrasound (ph. d.).Delft University of Technology, 2014. S V Valappil et al.:Preprint submitted to Elsevier Page 19 of 19
work page 2014
-
[22]
W.J. Westerveld, S.M. Leinders, P.L.M.J. van Neer, H.P. Urbach, N. de Jong, M.D. Verweij, X. Rottenberg, and V. Rochus. Optical micro- machined ultrasound sensors with a silicon photonic resonator in a buckled acoustical membrane. In2019 20th International Conference on Thermal, Mechanical and Multi-Physics Simulation and Experiments in Microelectronics a...
work page 2019
-
[1]
Application of ultrasound in medicine.Acta Inform
Aladin Carovac, Fahrudin Smajlovic, and Dzelaludin Junuzovic. Application of ultrasound in medicine.Acta Inform. Med., 19(3):168–171, September 2011
work page 2011
-
[2]
Ultrasonicarraysfornon-destructiveevaluation:Areview
BruceW.DrinkwaterandPaulD.Wilcox. Ultrasonicarraysfornon-destructiveevaluation:Areview. NDT&EInternational ,39(7):525–541, 2006
work page 2006
-
[3]
Guidelinesfortheuseofultrasonicnon-invasivemeteringtechniques
M.LSandersonandHYeung. Guidelinesfortheuseofultrasonicnon-invasivemeteringtechniques. FlowMeasurementandInstrumentation , 13(4):125–142, 2002
work page 2002
-
[4]
Anultrasonicsensorfordistancemeasurementinautomotiveapplications
AlessioCarulloandMarcoParvis. Anultrasonicsensorfordistancemeasurementinautomotiveapplications. IEEESensorsJournal ,1:143–, 2001
work page 2001
-
[5]
T.S.Awad,H.A.Moharram,O.E.Shaltout,D.Asker,andM.M.Youssef. Applicationsofultrasoundinanalysis,processingandqualitycontrol of food: A review.Food Research International, 48(2):410–427, 2012
work page 2012
-
[6]
Diagnostic ultrasound market share: Statistics report, 2023-2032, 2022
Global Market Insight. Diagnostic ultrasound market share: Statistics report, 2023-2032, 2022
work page 2023
Show all 59 references
-
[7]
Ultrasound market by technology, global forcast to 2028, 2023
Markets and Markets. Ultrasound market by technology, global forcast to 2028, 2023
2023
-
[8]
JournalofElectroceramics ,2(4):257–272, Dec 1998
JamesF.Tressler,SedatAlkoy,andRobertE.Newnham.Piezoelectricsensorsandsensormaterials. JournalofElectroceramics ,2(4):257–272, Dec 1998
1998
-
[9]
Transparent capacitive micromachined ultrasonic transducer (cmut) arrays for real-time photoacoustic applications.Opt
Afshin Kashani Ilkhechi, Christopher Ceroici, Zhenhao Li, and Roger Zemp. Transparent capacitive micromachined ultrasonic transducer (cmut) arrays for real-time photoacoustic applications.Opt. Express, 28(9):13750–13760, Apr 2020
2020
-
[10]
Reviewofpiezoelectricmicromachinedultrasonic transducers and their applications.Journal of Micromechanics and Microengineering, 27(11):113001, sep 2017
JoontaekJung,WonjunLee,WoojinKang,EunjungShin,JunghoRyu,andHongsooChoi. Reviewofpiezoelectricmicromachinedultrasonic transducers and their applications.Journal of Micromechanics and Microengineering, 27(11):113001, sep 2017. S V Valappil et al.:Preprint submitted to Elsevier P...
2017
-
[11]
Wenfeng Xia, Daniele Piras, Johan C. G. van Hespen, Spiridon van Veldhoven, Christian Prins, Ton G. van Leeuwen, Wiendelt Steenbergen, and Srirang Manohar. An optimized ultrasound detector for photoacoustic breast tomography.Medical Physics, 40(3):032901, 2013
2013
-
[12]
Overview of ultrasound detection technologies for photoacoustic imaging
Rayyan Manwar, Karl Kratkiewicz, and Kamran Avanaki. Overview of ultrasound detection technologies for photoacoustic imaging. Micromachines (Basel), 11(7):692, July 2020
2020
-
[13]
Westerveld, Md
Wouter J. Westerveld, Md. Mahmud-Ul-Hasan, Rami Shnaiderman, Vasilis Ntziachristos, Xavier Rottenberg, Simone Severi, and Veronique Rochus. Sensitive, small, broadband and scalable optomechanical ultrasound sensor in silicon photonics.Nature Photonics, 15(5):341–345, May 2021
2021
-
[14]
Lett., 44(8):1928–1931, Apr 2019
BolingOuyang,YanluLi,MartenKruidhof,RolandHorsten,KoenW.A.vanDongen,andJacobCaro.On-chipsiliconmach–zehnder interferometer sensor for ultrasound detection.Opt. Lett., 44(8):1928–1931, Apr 2019
1928
-
[15]
Asensitive optical micro-machined ultrasound sensor (omus) based on a silicon photonic ring resonator on an acoustical membrane.Scientific Reports, 5(1):14328, Sep 2015
S.M.Leinders,W.J.Westerveld,J.Pozo,P.L.M.J.vanNeer,B.Snyder,P.O’Brien,H.P.Urbach,N.deJong,andM.D.Verweij. Asensitive optical micro-machined ultrasound sensor (omus) based on a silicon photonic ring resonator on an acoustical membrane.Scientific Reports, 5(1):14328, Sep 2015
2015
-
[16]
Tilmans, and Xavier Rottenberg
RoelofJansen,VeroniqueRochus,JeroenGoyvaerts,GuyA.E.Vandenbosch,BobVoort,PieterNeutens,JohnM.O’Callaghan,HarrieA.C. Tilmans, and Xavier Rottenberg. Micro-opto-mechanical pressure sensor (momps) in sin integrated photonics platform. 2016
2016
-
[17]
Rochus, R
V. Rochus, R. Jansen, R. Haouari, B. Figeys, V. Mukund, F. Verhaegen, J. Goyvaerts, P. Neutens, J. O’ Callaghan, A. Stassen, S. Lenci, and X.Rottenberg.Modellinganddesignofmicro-opto-mechanicalpressuresensorsinthepresenceofresidualstresses.In 201718thInternational Conferenceon...
2017
-
[18]
Maja Zunic, Wouter J. Westerveld, Pieter Gijsenbergh, Yongbin Jeong, Alessio Miranda, John O’Callaghan, Hamideh Jafarpoorchekab, Emmanuel Vander Poorten, Xavier Rottenberg, Roelof Jansen, and Veronique Rochus. Design of a micro-opto-mechanical ultrasound sensor for photoacoust...
2020
-
[19]
Fastanalyticalmodelofmzimicro-opto-mechanicalpressure sensor
VRochus,RJansen,JGoyvaerts,PNeutens,JO’Callaghan,andXRottenberg. Fastanalyticalmodelofmzimicro-opto-mechanicalpressure sensor. Journal of Micromechanics and Microengineering, 28(6):064003, mar 2018
2018
-
[20]
Rochus, W.J
V. Rochus, W.J. Westerveld, B. Figeys, X. Rottenberg, and R. Jansen. Simulation and design of an optical accelerometer. In2019 20th International Conference on Thermal, Mechanical and Multi-Physics Simulation and Experiments in Microelectronics and Microsystems (EuroSimE), pag...
2019
-
[21]
H. Gao, C. H. Huang, W. Westerveld, R. Haouari, B. Troia, F. Verhaegen, R. Jansen, B. Figeys, X. Rottenberg, and V. Rochus. Simulation andcharacterization ofa high-sensitivemicro-opto-mechanical microphone. In201819th InternationalConference onThermal, Mechanical and Multi-Phy...
2018
-
[23]
Novel ultrasound detector based on small slot micro-ring resonator with ultrahigh q factor.Optics Communications, 382:113–118, 2017
Senlin Zhang, Jian Chen, and Sailing He. Novel ultrasound detector based on small slot micro-ring resonator with ultrahigh q factor.Optics Communications, 382:113–118, 2017
2017
-
[24]
Zhang, and Cheng Sun
Youngseop Lee, Hao F. Zhang, and Cheng Sun. Highly sensitive ultrasound detection using nanofabricated polymer micro-ring resonators. Nano Convergence, 10(1):30, Jun 2023
2023
-
[25]
T. W. Allen, J. Silverstone, N. Ponnampalam, T. Olsen, A. Meldrum, and R. G. DeCorby. High-finesse cavities fabricated by buckling self- assembly of a-si/sio2 multilayers.Opt. Express, 19(20):18903–18909, Sep 2011
2011
-
[26]
M. H. Bitarafan, H. Ramp, T. W. Allen, C. Potts, X. Rojas, A. J. R. MacDonald, J. P. Davis, and R. G. DeCorby. Thermomechanical characterization of on-chip buckled dome fabry–perot microcavities.J. Opt. Soc. Am. B, 32(6):1214–1220, Jun 2015
2015
-
[27]
Peter R. Saulson. Thermal noise in mechanical experiments.Phys. Rev. D, 42:2437–2445, Oct 1990
1990
-
[28]
Henry and Rudolf F
Charles H. Henry and Rudolf F. Kazarinov. Quantum noise in photonics.Rev. Mod. Phys., 68:801–853, Jul 1996
1996
-
[29]
T. J. Kippenberg and K. J. Vahala. Cavity optomechanics: Back-action at the mesoscale.Science, 321(5893):1172–1176, 2008
2008
-
[30]
Photodetectordesignsforlow-noise,broadband,andhigh-power applications
MalcolmB.Gray,DanielA.Shaddock,CharlesC.Harb,andHans-A.Bachor. Photodetectordesignsforlow-noise,broadband,andhigh-power applications. Review of Scientific Instruments, 69(11):3755–3762, 1998
1998
-
[31]
Keller, C
U. Keller, C. E. Soccolich, G. Sucha, M. N. Islam, and M. Wegener. Noise characterization of femtosecond color-center lasers.Opt. Lett., 15(17):974–976, Sep 1990
1990
-
[32]
Measurements of relative intensity noise (rin) in semiconductor lasers.J
Irène Joindot. Measurements of relative intensity noise (rin) in semiconductor lasers.J. Phys. III France, 2(9):1591–1603, 1992
1992
-
[33]
Quantum optomechanics without the radiation pressure force noise.Opt
Sankar Davuluri. Quantum optomechanics without the radiation pressure force noise.Opt. Lett., 46(4):904–907, Feb 2021
2021
-
[34]
Thermal noise-limited fiber-optic sensing at infrasonic frequencies.IEEE Journal of Quantum Electronics, 51(2):1–6, 2015
Lingze Duan. Thermal noise-limited fiber-optic sensing at infrasonic frequencies.IEEE Journal of Quantum Electronics, 51(2):1–6, 2015
2015
-
[35]
G. J. Hornig, K. G. Scheuer, E. B. Dew, R. Zemp, and R. G. DeCorby. Ultrasound sensing at thermomechanical limits with optomechanical buckled-dome microcavities.Opt. Express, 30(18):33083–33096, Aug 2022
2022
-
[36]
Micropascal- sensitivity ultrasound sensors based on optical microcavities.arXiv preprint arXiv:2211.07965, 2022
Hao Yang, Xuening Cao, Zhi-Gang Hu, Yimeng Gao, Yuechen Lei, Min Wang, Zhanchun Zuo, Xiulai Xu, and Bei-Bei Li. Micropascal- sensitivity ultrasound sensors based on optical microcavities.arXiv preprint arXiv:2211.07965, 2022
2022 arXiv
-
[37]
Krause, Martin Winger, Tim D
Alexander G. Krause, Martin Winger, Tim D. Blasius, Qiang Lin, and Oskar Painter. A high-resolution microchip optomechanical accelerometer. Nature Photonics, 6(11):768–772, Nov 2012
2012
-
[38]
Noiseanalysisinoptomechanicalinertialsensors
JonathanY.LeeandQiangLin. Noiseanalysisinoptomechanicalinertialsensors. In 2016IEEEInternationalSymposiumonInertialSensors and Systems, pages 132–135, 2016
2016
-
[39]
Pleitez, Amir Rosenthal, and Vasilis Ntziachristos
Georg Wissmeyer, Miguel A. Pleitez, Amir Rosenthal, and Vasilis Ntziachristos. Looking at sound: optoacoustics with all-optical ultrasound detection. Light: Science & Applications, 7(1):53, Aug 2018
2018
-
[40]
M. Huang. Stress effects on the performance of optical waveguides.International Journal of Solids and Structures, 40(7):1615–1632, 2003
2003
-
[41]
Springer, 2019
Allan D Pierce.Acoustics: an introduction to its physical principles and applications. Springer, 2019. S V Valappil et al.:Preprint submitted to Elsevier Page 18 of 19 RTF and noise modeling of IPUTs
2019
-
[42]
Springer Nature, 2023
Anthony Bedford and Douglas S Drumheller.Introduction to elastic wave propagation. Springer Nature, 2023
2023
-
[43]
Time-domain analysis of an acoustic–elastic interaction problem.Archive for Rational Mechanics and Analysis, 229(2):835–884, Aug 2018
Gang Bao, Yixian Gao, and Peijun Li. Time-domain analysis of an acoustic–elastic interaction problem.Archive for Rational Mechanics and Analysis, 229(2):835–884, Aug 2018
2018
-
[44]
John Wiley & Sons, 2004
Graham T Reed and Andrew P Knights.Silicon photonics: an introduction. John Wiley & Sons, 2004
2004
-
[45]
Springer Science & Business Media, 2012
Tamma Satya Narasimhamurty.Photoelastic and electro-optic properties of crystals. Springer Science & Business Media, 2012
2012
-
[46]
John Wiley & Sons, 2009
Paul G Huray.Maxwell’s equations. John Wiley & Sons, 2009
2009
-
[47]
Allan, and Michael P
Xavier Gonze, Douglas C. Allan, and Michael P. Teter. Dielectric tensor, effective charges, and phonons in𝛼-quartz by variational density- functional perturbation theory.Phys. Rev. Lett., 68:3603–3606, Jun 1992
1992
-
[48]
L. S. Hounsome, R. Jones, M. J. Shaw, and P. R. Briddon. Photoelastic constants in diamond and silicon.physica status solidi (a), 203(12):3088–3093, 2006
2006
-
[49]
Acousto-optic devices : principles, design, and applications
Jeiping Xu and Robert Stroud. Acousto-optic devices : principles, design, and applications. 1992
1992
-
[50]
Westerveld, Suzanne M
Wouter J. Westerveld, Suzanne M. Leinders, Pim M. Muilwijk, Jose Pozo, Teun C. van den Dool, Martin D. Verweij, Mirvais Yousefi, and H.PaulUrbach. Characterizationofintegratedopticalstrainsensorsbasedonsiliconwaveguides. IEEEJournalofSelectedTopicsinQuantum Electronics, 20(4):...
2014
-
[51]
Courier Corporation, 2006
David Keith Chalmers MacDonald.Noise and fluctuations: an introduction. Courier Corporation, 2006
2006
-
[52]
Calculation of thermal noise in atomic force microscopy.Nanotechnology, 6(1):1, jan 1995
H J Butt and M Jaschke. Calculation of thermal noise in atomic force microscopy.Nanotechnology, 6(1):1, jan 1995
1995
-
[53]
Amabili and M.K
M. Amabili and M.K. Kwak. Free vibrations of circular plates coupled with liquids: Revising the lamb problem.Journal of Fluids and Structures, 10(7):743–761, 1996
1996
-
[54]
The langevin equation.Comptes Rendus Physique, 18(9):570–582, 2017
Yves Pomeau and Jarosław Piasecki. The langevin equation.Comptes Rendus Physique, 18(9):570–582, 2017. Science in the making: The Comptes rendus de l’Académie des sciences throughout history
2017
-
[55]
Hauer, C
B.D. Hauer, C. Doolin, K.S.D. Beach, and J.P. Davis. A general procedure for thermomechanical calibration of nano/micro-mechanical resonators. Annals of Physics, 339:181–207, 2013
2013
-
[56]
Cambridge university press, 2003
Michael Peter Norton and Denis G Karczub.Fundamentals of noise and vibration analysis for engineers. Cambridge university press, 2003
2003
-
[57]
Numericalrecipes3rdedition:Theartofscientificcomputing
WilliamHPress,SaulATeukolsky,WilliamTVetterling,andBrianPFlannery. Numericalrecipes3rdedition:Theartofscientificcomputing . Cambridge university press, 2007
2007
-
[58]
T. R. Albrecht, P. Grütter, D. Horne, and D. Rugar. Frequency modulation detection using high-q cantilevers for enhanced force microscope sensitivity. Journal of Applied Physics, 69(2):668–673, 1991
1991
Reviewed August 7, 2026 · model on record in the stance chip above.
Discussion (0). Continue with ORCID to comment.