REVIEW 3 major objections 4 minor 62 references
AGN with massive black holes have closer galactic neighbors: k-Nearest-Neighbor statistics of an unbiased sample of AGN at z~0.03
T0 review · 3 major / 4 minor · reviewed 2026-08-06 · deepseek-v4-flash
Pith's one-line read Active galaxies whose central black holes are more massive have closer galactic neighbors than those with lighter black holes, at 99.98% confidence in the local universe.
desk verdict The MBH–environment trend looks real, but the advertised 99.98% significance is not supported by the paper's own null procedure. read the letter →
The pith
A machine-rendered reading of the paper's core claim, the machinery that carries it, and where it could break.
The reading
What carries the argument
The central object is the kth-nearest-neighbor cumulative distribution function (kNN CDF): for each AGN, the angular distances to its first seven 2MASS galaxy neighbors are collected, and each CDF gives the probability that the $k$th neighbor lies within a given angular separation, with $k$ running from 1 to 7. Because these CDFs are sensitive to all orders of the correlation function, they capture higher-order, small-scale clustering information that the two-point function cannot, and this is the first application of the data-data kNN cross-correlation to X-ray-selected AGN. The significance engine is a correlated $\chi^2$ computed from jackknife covariance matrices built from 49 sky patches, calibrated against a null distribution generated by 1000 random splits of the AGN sample into equal-sized subsamples; all quoted confidence levels are percentiles of that empirical null.
What would settle it
Recompute the kNN CDFs on a volume-complete AGN sample, or apply an explicit completeness correction as a function of $M_{\rm BH}$: if the close-neighbor excess for massive black holes survives, the environmental claim stands, and if it shrinks toward the null when faint low-mass AGN in dense regions are recovered, it is a selection effect. A second decisive check is measuring kNN statistics at fixed stellar mass but split by black hole mass, which the authors' SMBH-halo interpretation predicts should retain a residual difference while the stellar-mass-only explanation predicts none.
Extended reading notes
Core claim
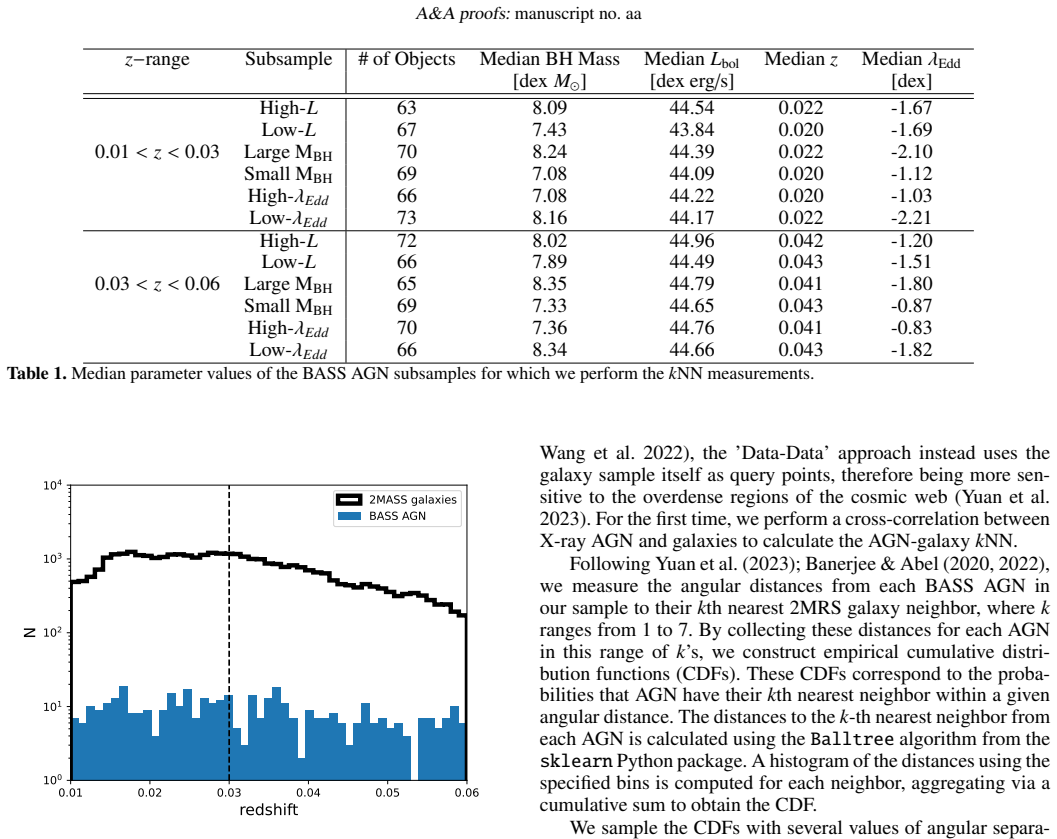
On its own terms, the paper's central claim is that the distribution of distances to galactic neighbors shifts inward as black hole mass grows. The authors bin 412 BASS AGN with measured black hole masses into redshift-controlled upper and lower tertiles of $M_{\rm BH}$, bolometric luminosity, and Eddington ratio, then compute kth-nearest-neighbor cumulative distribution functions ($k=1$ through $7$) for angular separations to 36,584 2MASS galaxies in two redshift ranges, $0.01<z<0.03$ and $0.03<z<0.06$. In the lower redshift range the high-mass black hole bin shows a higher probability of close neighbors for essentially every $k$, strongest on one-halo scales of roughly $0.25$-$0.75\,h^{-1}\,\mathrm{Mpc}$, with a correlated $\chi^2$ that lands in the 99.98th percentile of the empirical null distribution; the combined significance across both redshift ranges is $p = 8.06\times10^{-5}$. Luminosity trends are weaker and traced back to black hole mass, Eddington-ratio trends go the opposite way and are not significant once mass is controlled, and no dependence on obscuring column density remains after controlling for mass and redshift. Interpreting the result with toy models in an N-body simulation, the paper argues that the small-scale kNN trend with black hole mass goes beyond what stellar mass alone predicts, favoring a direct connection between black hole mass and host dark matter halo mass.
Load-bearing premise
The result assumes the hard-X-ray AGN sample is as complete for low-mass as for high-mass black holes within each redshift bin after the redshift-controlled tertile binning; the paper does not quantify sample completeness as a function of black hole mass, so if faint AGN with low-mass black holes in dense environments are preferentially missing, the closer-neighbor signal could be a selection artifact rather than a true environmental dependence.
Editorial extensions
If this is right
- Black hole mass is tied to cosmic environment: at 99.98% confidence in the low-redshift range, massive SMBHs sit closer to their galactic neighbors, which the paper reads as evidence that they occupy more massive dark matter halos.
- kNN statistics are a sharper probe of AGN clustering: the mass trend is detected at far higher significance than the 2.3$\sigma$ hint from the 2-point correlation function on the same sample, recommending kNN CDFs for future wide-field AGN surveys like Euclid and eROSITA/SDSS-V/4MOST.
- Instantaneous accretion rate is decoupled from environment: Eddington-ratio-binned kNN differences are not significant once black hole mass is controlled, so what environment tracks is cumulative black hole growth, not current fueling.
- Previously reported obscured-versus-unobscured clustering differences may be mass-driven: no kNN difference with column density survives controlling for mass and redshift.
- Small-scale and larger-scale clustering may require different physical models: the N-body toy model with a direct SMBH-halo correlation matches the inner neighbors ($k=1,2$) but not the outer ones, so more sophisticated models or secondary parameters are needed.
Reading between the lines
- The paper leaves implicit a quantitative prediction: the kNN mass difference should grow as tracer completeness improves, so repeating this analysis with deeper spectroscopic surveys at the same redshifts should sharpen the signal on sub-megaparsec scales.
- A decoupling experiment follows directly: if the trend is driven by stellar mass, binning AGN by stellar mass at fixed black hole mass should reproduce the kNN difference; if a direct SMBH-halo link exists, the difference should persist at fixed stellar mass.
- Because the quoted angular distances mix physical scales within each redshift bin, converting to physical projected separations per object rather than at bin-median redshifts would tighten the one-halo versus two-halo interpretation the authors offer.
- The opposite-signed Eddington-ratio trend is consistent with the mass-driven picture, but a cleaner test is matching high- and low-Eddington bins in black hole mass exactly; the paper controls for redshift in its binning but matches mass only approximately.
Editorial analysis
A structured set of objections, weighed in public.
Referee Report
Summary. This paper presents kth-nearest-neighbor (kNN) statistics of 2MRS galaxies around 419 hard-X-ray-selected AGN from the BASS DR2 sample, split into redshift-controlled bins of black hole mass, bolometric luminosity, and Eddington ratio. The authors find that the high-MBH bin has closer neighbors than the low-MBH bin, quote a 99.98% confidence level for the low-redshift range, and report a combined p-value of 8.06e-5 across the two redshift ranges. They also compare the observed kNN differences with N-body mocks built from empirical MBH-M* and M*-Mhalo relations, concluding that the MBH trend may go beyond stellar mass dependencies.
Significance. The paper is potentially valuable: it applies kNN statistics to an AGN-galaxy cross-correlation for the first time, exploits a large hard-X-ray-selected sample with a high completeness of spectroscopic MBH measurements, and includes useful robustness tests (jackknife covariance stability checks, consistent-MBH subsamples in Appendix C, and a permutation-based null). If the significance claim is correct, the result would strengthen previous 2.3-sigma correlation-function hints and demonstrate the extra sensitivity of higher-order clustering statistics. However, the headline significance is not reproducible from the stated methodology, and the flux-limited sample completeness as a function of MBH is not quantified.
major comments (3)
- [Sections 3.2 and 4.5] The claim that the low-z MBH kNN difference (chi^2 = 99.57, 28 dof) is at the 99.98th percentile of the null is not reproducible from the described 1,000-split null: with 1,000 realizations the empirical percentile is quantized in steps of 0.1%, so the 99.98th percentile (p = 2e-4) requires an unstated tail extrapolation or many more null realizations. In addition, the same measurement is quoted as 3.8 sigma in Section 4.3 and 3.6 sigma in Section 4.5, and the reported combined p = 8.06e-5 is not derived: combining the stated low-z p = 2e-4 and high-z p = 0.06 via Fisher or Stouffer yields approximately 1.5e-4, not 8.06e-5. Please describe the combination method, reconcile the sigma values, and either run more null realizations or report the empirical p-value with its resolution limit.
- [Section 4.5] Even if the observed chi^2 exceeds all 1,000 null values, the paper should state this explicitly (e.g., p < 10^-3) rather than quoting a finer percentile that the empirical null cannot resolve; if a parametric fit to the null tail is used, it should be described and justified in the text.
- [Sections 2.1 and 4.3] The BASS sample is flux-limited, and the paper does not quantify the completeness of the hard X-ray sample as a function of MBH within each redshift interval. Since the low-MBH bin has lower median Lbol (Table 1), a flux limit could preferentially remove faint low-MBH AGN, and if those missing objects reside in different environments, the observed kNN difference could be partly a selection artifact. The redshift-controlled tertile binning removes the redshift-luminosity degeneracy but not a possible MBH-dependent completeness. Please add a test (e.g., a volume-limited subsample, a completeness-weighted analysis, or a comparison with the X-ray luminosity function) to demonstrate that the MBH trend is not driven by incompleteness.
minor comments (4)
- [Section 4.5] The sentence 'Combining the two redshift ranges results in p-values of 8.06e-5 for the mass trends' lacks a description of the combination method; please specify (e.g., Fisher's method, Stouffer's method, or a direct chi^2 combination).
- [Section 3.1] The statement 'we have 28 independent elements, sufficiently smaller than our number of jackknifes (49)' is confusing: the covariance matrix has 28 dimensions, so it has 28*29/2 = 406 independent elements, while the number of jackknife samples is 49; please clarify what is meant by independent elements.
- [Section 4.3] The phrase '3.8 sigma compared to 2.3 sigma' in the last paragraph should be reconciled with the 3.6 sigma quoted in Section 4.5 for the same measurement.
- [Section 5.2 and Figure 12] The comparison between data and mock models is purely qualitative; consider adding a quantitative goodness-of-fit metric or stating explicitly that no model is preferred at high significance.
Circularity Check
No significant circularity: the kNN measurement is self-contained, and the self-citations are contextual or methodological rather than load-bearing.
full rationale
The central kNN measurement is computed directly from angular distances between BASS AGN and 2MRS galaxies, with cumulative distribution functions and correlated chi-squared values obtained from the data and jackknife covariances; no parameter is fitted to the kNN data to produce the MBH trend. The significance is assessed against an internal empirical null built by randomly splitting the AGN sample, so the headline MBH result does not depend on any external or prior result. Self-citations to Powell et al. (2022, 2024) appear in the random-catalog generation, the N-body mock construction, and in comparisons with earlier correlation-function measurements; these are methodological or contextual and are not required for the measurement itself. The mock interpretation uses literature MBH-M* relations with three alternative parameterizations and fixed scatters, and the conclusion is explicitly tentative ('may go beyond'), so the interpretation is not forced by construction. The internal inconsistencies in the reported significance levels (the 99.98th percentile from 1000 null realizations and the combined p-value of 8.06e-5) are statistical reproducibility concerns rather than circularity, and do not affect the circularity verdict.
Assumptions & free parameters
assumptions (5)
- standard math kNN CDF statistics are sensitive to all orders of the correlation function on nonlinear scales (Banerjee & Abel 2020; Yuan et al. 2023).
- domain assumption The 2MRS galaxy sample (K_s < 11.75, spectroscopic redshifts) is a fair tracer of the local galaxy density field modulo its flux limit.
- domain assumption The BASS hard X-ray selection (14-195 keV) is nearly unbiased to obscuring column densities up to NH = 1e24 cm^-2.
- domain assumption The permutation null distribution, generated by random splits of the AGN sample, correctly represents the covariance of the kNN measurements under the null hypothesis.
- domain assumption The adopted MBH-M* relations and scatters (Reines & Volonteri 2015; Shankar et al. 2016; Powell et al. 2022) are representative of the local universe.
Cite this review
Pith. "Pith review of AGN with massive black holes have closer galactic neighbors: k-Nearest-Neighbor statistics of an unbiased sample of AGN at z~0.03." pith.science (2026). https://pith.science/paper/LTDCL5D3
@misc{pith2026250621705,
  author       = {Pith},
  title        = {Pith review of: AGN with massive black holes have closer galactic neighbors: k-Nearest-Neighbor statistics of an unbiased sample of AGN at z~0.03},
  year         = {2026},
  howpublished = {\url{https://pith.science/paper/LTDCL5D3}},
  note         = {Machine review of arXiv:2506.21705}
}
read the original abstract
The large-scale environments of active galactic nuclei (AGN) reveal important information on the growth and evolution of supermassive black holes (SMBHs). Previous AGN clustering measurements using 2-point correlation functions have hinted that AGN with massive black holes preferentially reside in denser cosmic regions than AGN with less-massive SMBHs. At the same time, little to no dependence on the accretion rate is found. However, the significance of such trends have been limited. Here we present kth-nearest-neighbor (kNN) statistics of 2MASS galaxies around AGN from the Swift/BAT AGN Spectroscopic survey. These statistics have been shown to contribute additional higher-order clustering information on the cosmic density field. By calculating the distances to the nearest 7 galaxy neighbors in angular separation to each AGN within two redshift ranges(0.01 < z < 0.03 and 0.03 < z < 0.06), we compare their cumulative distribution functions to that of a randomly distributed sample to show the sensitivity of this method to the clustering of AGN. We also split the AGN into bins of bolometric luminosity, black hole mass, and Eddington ratio (while controlling for redshift) to search for trends between kNN statistics and fundamental AGN properties. We find that AGN with massive SMBHs have significantly closer neighbors than AGN with less-massive SMBHs (at the 99.98% confidence level), especially in our lower redshift range. We find less significant trends with luminosity or Eddington ratio. By comparing our results to empirical SMBH-galaxy-halo models implemented in N-body simulations, we show that small-scale kNN trends with black hole mass may go beyond stellar mass dependencies. This suggests that massive SMBHs in the local universe reside in more massive dark matter halos and denser regions of the cosmic web, which may indicate that environment is important for the growth of SMBHs.
Figures


Figures from the paper (8 more)


Reference graph
Works this paper leans on
- [1]
-
[2]
Allevato, V ., Finoguenov, A., Cappelluti, N., et al. 2011, ApJ, 736, 99
work page 2011
-
[3]
2019, A&A, 632, A88
Allevato, V ., Viitanen, A., Finoguenov, A., et al. 2019, A&A, 632, A88
2019
-
[4]
Ananna, T. T., Weigel, A. K., Trakhtenbrot, B., et al. 2022, ApJS, 261, 9
work page 2022
- [5]
- [6]
-
[7]
H., Tueller, J., Markwardt, C
Baumgartner, W. H., Tueller, J., Markwardt, C. B., et al. 2013, ApJS, 207, 19
2013
-
[8]
H., Hearin, A
Behroozi, P., Wechsler, R. H., Hearin, A. P., & Conroy, C. 2019, MNRAS, 488, 3143
2019
Show all 62 references
-
[9]
S., Conroy, C., & Wechsler, R
Behroozi, P. S., Conroy, C., & Wechsler, R. H. 2010, ApJ, 717, 379
2010
-
[10]
S., Wechsler, R
Behroozi, P. S., Wechsler, R. H., & Wu, H.-Y . 2013, ApJ, 762, 109
2013
-
[11]
K., Blecha, L., & Thomas, J
Bhowmick, A. K., Blecha, L., & Thomas, J. 2020, ApJ, 904, 150
2020
-
[12]
G., Schaye, J., Frenk, C
Bower, R. G., Schaye, J., Frenk, C. S., et al. 2017, MNRAS, 465, 32
2017
-
[13]
2020, A&A, 634, A114
Caglar, T., Burtscher, L., Brandl, B., et al. 2020, A&A, 634, A114
2020
-
[14]
J., Burtscher, L., et al
Caglar, T., Koss, M. J., Burtscher, L., et al. 2023, ApJ, 956, 60
2023
-
[15]
2010, ApJ, 716, L209
Cappelluti, N., Ajello, M., Burlon, D., et al. 2010, ApJ, 716, L209
2010
-
[16]
2012, Advances in Astronomy, 2012, 853701
Cappelluti, N., Allevato, V ., & Finoguenov, A. 2012, Advances in Astronomy, 2012, 853701
2012
-
[17]
M., Koo, D
Chen, Z., Faber, S. M., Koo, D. C., et al. 2020, ApJ, 897, 102
2020
-
[18]
2019, MNRAS, 487, 48
Chuang, C.-H., Yepes, G., Kitaura, F.-S., et al. 2019, MNRAS, 487, 48
2019
-
[19]
L., Mendez, A
Coil, A. L., Mendez, A. J., Eisenstein, D. J., & Moustakas, J. 2017, ApJ, 838, 87
2017
-
[20]
& Sijacki, D
DeGraf, C. & Sijacki, D. 2017, MNRAS, 466, 3331
2017
-
[21]
A., Hickox, R
DiPompeo, M. A., Hickox, R. C., Eftekharzadeh, S., & Myers, A. D. 2017, MN- RAS, 469, 4630
2017
-
[22]
2002, ApJ, 578, 90
Ferrarese, L. 2002, ApJ, 578, 90
2002
-
[23]
M., Powell, M
Ghosh, A., Urry, C. M., Powell, M. C., et al. 2024, ApJ, 971, 142
2024
-
[24]
P., Macri, L
Huchra, J. P., Macri, L. M., Masters, K. L., et al. 2012, ApJS, 199, 26
2012
-
[25]
H., Peterson, B
Jones, D. H., Peterson, B. A., Colless, M., & Saunders, W. 2006, MNRAS, 369, 25
2006
-
[26]
Kormendy, J. & Ho, L. C. 2013, ARA&A, 51, 511
2013
-
[27]
2012, ApJ, 746, L22
Koss, M., Mushotzky, R., Treister, E., et al. 2012, ApJ, 746, L22
2012
-
[28]
2010, ApJ, 716, L125
Koss, M., Mushotzky, R., Veilleux, S., & Winter, L. 2010, ApJ, 716, L125
2010
-
[29]
2011, ApJ, 739, 57
Koss, M., Mushotzky, R., Veilleux, S., et al. 2011, ApJ, 739, 57
2011
-
[30]
2017, ApJ, 850, 74
Koss, M., Trakhtenbrot, B., Ricci, C., et al. 2017, ApJ, 850, 74
2017
-
[31]
J., Blecha, L., Bernhard, P., et al
Koss, M. J., Blecha, L., Bernhard, P., et al. 2018, Nature, 563, 214
2018
-
[32]
2018, MNRAS, 481, 3063
Koutoulidis, L., Georgantopoulos, I., Mountrichas, G., et al. 2018, MNRAS, 481, 3063
2018
-
[33]
A., et al
Krishnan, C., Almaini, O., Hatch, N. A., et al. 2020, MNRAS, 494, 1693
2020
-
[34]
T., Pimbblet, K
Kristensen, M. T., Pimbblet, K. A., Gibson, B. K., Penny, S. J., & Koudmani, S. 2021, ApJ, 922, 127
2021
-
[35]
L., & Aceves, H
Krumpe, M., Miyaji, T., Coil, A. L., & Aceves, H. 2012, ApJ, 746, 1
2012
-
[36]
L., & Aceves, H
Krumpe, M., Miyaji, T., Coil, A. L., & Aceves, H. 2018, MNRAS, 474, 1773
2018
-
[37]
2023, ApJ, 952, 109
Krumpe, M., Miyaji, T., Georgakakis, A., et al. 2023, ApJ, 952, 109
2023
-
[38]
2015, ApJ, 815, 21
Krumpe, M., Miyaji, T., Husemann, B., et al. 2015, ApJ, 815, 21
2015
-
[39]
2024, arXiv e-prints, arXiv:2409.06208
Li, H., Chen, Y ., Wang, H., & Mo, H. 2024, arXiv e-prints, arXiv:2409.06208
2024
-
[40]
2021, MNRAS, 507, 4274
Marasco, A., Cresci, G., Posti, L., et al. 2021, MNRAS, 507, 4274
2021
-
[41]
M., et al
Marcotulli, L., Ajello, M., Urry, C. M., et al. 2022, ApJ, 940, 77 Mejía-Restrepo, J. E., Trakhtenbrot, B., Koss, M. J., et al. 2022, ApJS, 261, 5
2022
-
[42]
J., Coil, A
Mendez, A. J., Coil, A. L., Aird, J., et al. 2016, ApJ, 821, 55
2016
-
[43]
P., Naab, T., & White, S
Moster, B. P., Naab, T., & White, S. D. M. 2013, MNRAS, 428, 3121
2013
-
[44]
2020, MNRAS, 497, 1
Oogi, T., Shirakata, H., Nagashima, M., et al. 2020, MNRAS, 497, 1
2020
-
[45]
Perez, N. R. & Coldwell, G. 2022, MNRAS, 513, 5344 Planck Collaboration, Ade, P. A. R., Aghanim, N., et al. 2016, A&A, 594, A13
2022
-
[46]
C., Allen, S
Powell, M. C., Allen, S. W., Caglar, T., et al. 2022, ApJ, 938, 77
2022
-
[47]
C., Cappelluti, N., Urry, C
Powell, M. C., Cappelluti, N., Urry, C. M., et al. 2018, ApJ, 858, 110
2018
-
[48]
C., Krumpe, M., Coil, A., & Miyaji, T
Powell, M. C., Krumpe, M., Coil, A., & Miyaji, T. 2024, A&A, 686, A57
2024
-
[49]
C., Urry, C
Powell, M. C., Urry, C. M., Cappelluti, N., et al. 2020, ApJ, 891, 41
2020
-
[50]
Reines, A. E. & V olonteri, M. 2015, ApJ, 813, 82
2015
-
[51]
J., et al
Ricci, C., Trakhtenbrot, B., Koss, M. J., et al. 2017, ApJS, 233, 17
2017
-
[52]
J., et al
Ricci, C., Ueda, Y ., Koss, M. J., et al. 2015, ApJ, 815, L13
2015
-
[53]
2025, MN- RAS[arXiv:2505.02920]
Shankar, F., Bernardi, M., Roberts, D., et al. 2025, MN- RAS[arXiv:2505.02920]
2025 arXiv
-
[54]
K., et al
Shankar, F., Bernardi, M., Sheth, R. K., et al. 2016, MNRAS, 460, 3119
2016
-
[55]
2016, PASJ, 68, 23
Shirasaki, Y ., Komiya, Y ., Ohishi, M., & Mizumoto, Y . 2016, PASJ, 68, 23
2016
-
[56]
D., Kovac, K., Knobel, C., et al
Silverman, J. D., Kovac, K., Knobel, C., et al. 2009, The Astrophysical Journal, 695, 171
2009
-
[57]
2023, The Astrophysical Journal, 953, 64
Singh, A., Park, C., Choi, E., et al. 2023, The Astrophysical Journal, 953, 64
2023
-
[58]
2023, MNRAS, 518, 724
Siudek, M., Mezcua, M., & Krywult, J. 2023, MNRAS, 518, 724
2023
-
[59]
2021, MNRAS, 507, 6148
Viitanen, A., Allevato, V ., Finoguenov, A., Shankar, F., & Marsden, C. 2021, MNRAS, 507, 6148
2021
-
[60]
2022, MNRAS, 514, 3828
Wang, Y ., Banerjee, A., & Abel, T. 2022, MNRAS, 514, 3828
2022
-
[61]
N., Darvish, B., et al
Yang, G., Brandt, W. N., Darvish, B., et al. 2018, MNRAS, 480, 1022
2018
-
[62]
2023, Monthly Notices of the Royal Astronom- ical Society, 522, 3935–3947 Article number, page 12 of 15 A
Yuan, S., Zamora, A., & Abel, T. 2023, Monthly Notices of the Royal Astronom- ical Society, 522, 3935–3947 Article number, page 12 of 15 A. Mhatre, M. C. Powell, et al.: AGN with massive supermassive black holes have closer galactic neighbors 0.25 0.50 0.75 1.00 1.25 1.50 1.75...
2023
Reviewed August 6, 2026 · model on record in the stance chip above.
Discussion (0). Continue with ORCID to comment.