REVIEW 3 major objections 4 minor 1 cited by
MUSEQuBES: Unveiling Cosmic Web Filaments at $z\approx3.6$ through Dual Absorption and Emission Line Analysis
T0 review · 3 major / 4 minor · reviewed 2026-08-11 · deepseek-v4-flash
Pith's one-line read The authors report the first direct detection of a cosmic filament feeding normal galaxies, identified by an extremely metal-poor absorbing gas at $z\approx3.6$ and a giant Lyman-alpha nebula extending about 260 pkpc.
desk verdict A genuinely interesting single-object discovery, but the paper's own boosted radiation field for the nebula is not applied to the absorber, and that tension needs to be resolved before the pristine-filament claim is accepted. read the letter →
The pith
A machine-rendered reading of the paper's core claim, the machinery that carries it, and where it could break.
The reading
What carries the argument
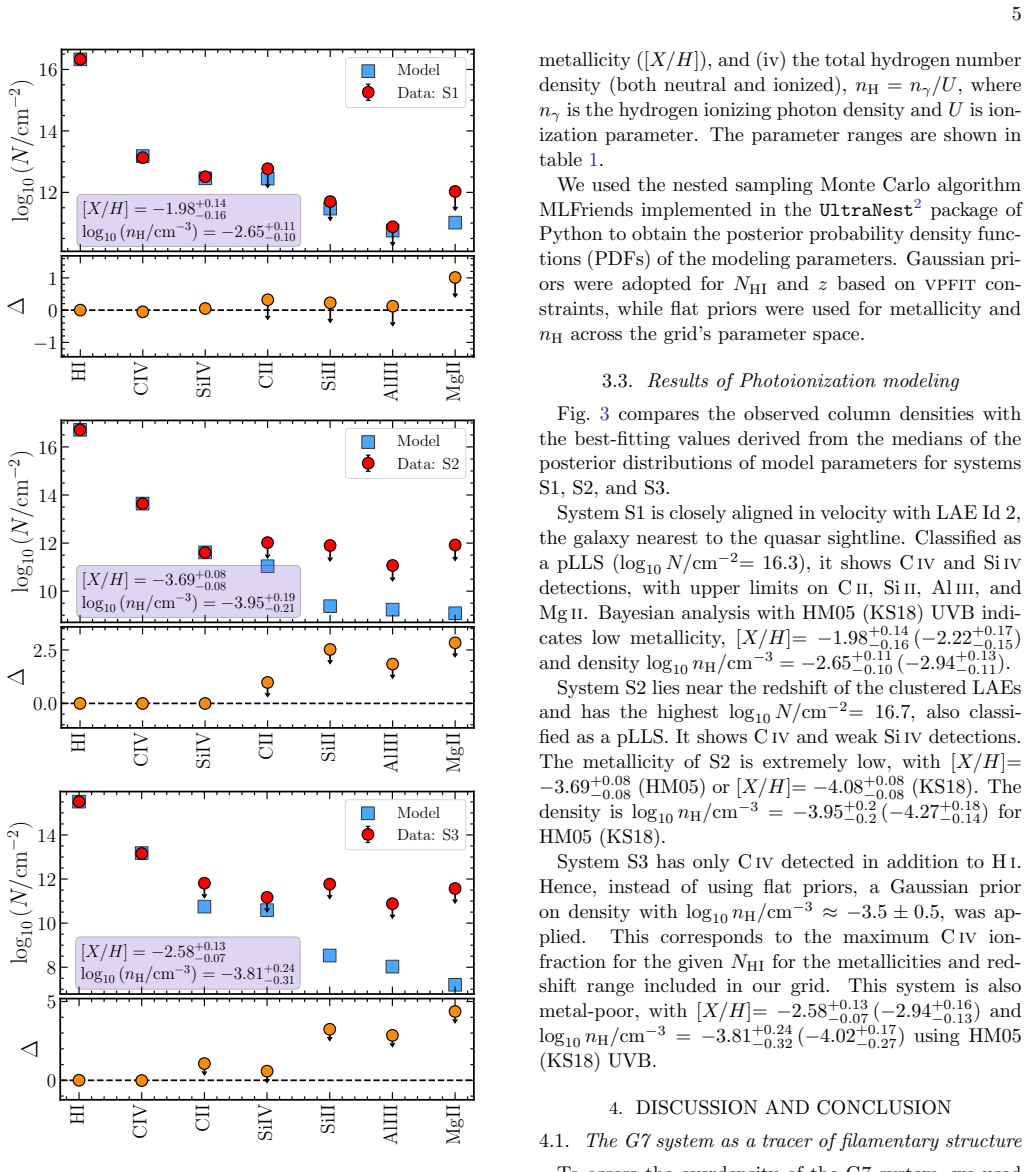
The machinery is the combined use of two orthogonal probes of the same volume. A background quasar acts as a backlight: vpfit Voigt-profile fits to the Lyman series and to C IV and Si IV doublets fix the neutral hydrogen column densities and Doppler parameters of the absorbing components, and a Cloudy photoionization grid, with Bayesian inference via UltraNest, converts the observed ionic column densities into hydrogen density and metallicity under the HM05 and KS18 ultraviolet background models; the absorbing gas is treated as a uniform slab in ionization equilibrium. MUSE integral-field spectroscopy supplies the other probe: after point-spread-function and continuum subtraction, CubEx source finding recovers the faint extended nebula and the seven LAEs in the same three-dimensional data cube. The load-bearing link is the system S2: its derived density and metallicity place it in filament territory, and its velocity offset of roughly $-60\ {\rm km\ s^{-1}}$ places it next to five clustered LAEs and within the roughly 260-pkpc nebula, so that absorption and emission are tied to one structure.
What would settle it
Point a second quasar sightline within about 100 pkpc of G7 at the same redshift: a real filament should appear as coherent low-density, low-metallicity absorption across both sightlines, while an isolated circumgalactic blob would not. In the same field, measuring the nebula's resolved Ly-alpha kinematics and finding that they disagree with the absorber's velocity structure would argue against simple in-situ recombination of the same gas.
Extended reading notes
Core claim
At $z\approx3.577$ toward the quasar Q1317-0507, the paper identifies a system it calls G7 and claims it is a cosmic filament. In absorption, simultaneous Voigt-profile fitting of the Lyman series and of C IV and Si IV yields three metal-poor components: S1 with $[X/H]\approx-1.98$, S2 with $[X/H]\approx-3.69$, and S3 with $[X/H]\approx-2.58$, with hydrogen densities between $\log_{10} n_{\rm H}/{\rm cm}^{-3}\approx -2.6$ and $-4.0$; S2, a partial Lyman limit system (neutral hydrogen column density $10^{16.7}\ {\rm cm}^{-2}$), has $\log_{10} n_{\rm H}/{\rm cm}^{-3}\approx -4.0$, corresponding to an overdensity of about five, in the regime expected for a cosmic filament rather than a galaxy halo. In emission, MUSE reveals seven Lyman-$\alpha$ emitters whose number is a $3\times10^{-6}$ to $2\times10^{-5}$ Poisson fluctuation of the luminosity function and whose positions align with only about 0.3% chance probability; the same data cube contains a giant Lyman-$\alpha$ nebula with surface brightness at least $10^{-19}\ {\rm erg\ s^{-1}\ cm^{-2}\ arcsec^{-2}}$ and a maximum projected size of about 260 pkpc running along the LAE chain. The paper's central claim is that the velocity and spatial coincidence of the metal-poor absorber S2, the LAE overdensity, and the giant nebula constitutes the first detection of giant Lyman-$\alpha$ emission tracing cosmic filaments, linked to normal galaxies and likely powered by in-situ recombination.
Load-bearing premise
The inference that S2 is extremely metal-poor and low-density assumes the absorbing gas is a uniform cloud lit almost entirely by the cosmic ultraviolet background, with the seven detected galaxies contributing only a small correction; if the local radiation from those galaxies is much stronger, the same absorption would imply denser, more metal-rich gas.
Editorial extensions
If this is right
- Giant Lyman-alpha nebulae can be produced by normal star-forming galaxies in overdense regions, not only by quasars or active galactic nuclei.
- At $z\gtrsim3.5$, partial and full Lyman limit systems can trace intergalactic filaments rather than only circumgalactic gas, consistent with cold-mode accretion simulations.
- Overdense, near-linear arrangements of Lyman-alpha emitters can serve as signposts for underlying cosmic-web filaments.
- The system S2 provides a direct measurement of the density, overdensity, and metallicity of gas accreting onto galaxies: $\log_{10} n_{\rm H}/{\rm cm}^{-3}\approx -4$, $\delta\approx5$, $[X/H]\approx-3.7$.
- Combining quasar absorption sightlines with integral-field spectroscopy can reveal the cosmic web in three dimensions at high redshift.
Reading between the lines
- A statistical sample could be built from archival MUSE fields by first finding LAE overdensities in the galaxy cubes and then checking quasar spectra for aligned low-density, low-metallicity absorbers; the method would not need new observations.
- If the filament interpretation holds, the fraction of extremely metal-poor LLSs and pLLSs at $z\approx3.6$ would likely exceed the roughly 18% measured at $z\approx3$, because G7 shows pristine gas is present on filament scales rather than confined to rare halos.
- The measured overdensity $\delta\approx5$ and density $\log_{10} n_{\rm H}/{\rm cm}^{-3}\approx -4$ give a concrete benchmark that cosmological simulations of cold accretion can be asked to reproduce; a simulation that never produces such low-density, metal-poor self-shielded gas at $z\approx3.6$ would be in tension with this detection.
- Because only one of the seven LAEs is included in the local radiation correction, future photometry or spectroscopy of the other six could shift the inferred density by a few tenths of a dex, so the low-density label is the part of the claim most worth retesting.
Signed reviews
Editorial analysis
A structured set of objections, weighed in public.
Referee Report
Summary. The paper reports MUSE/UVES/X-shooter observations toward Q1317−0507 and identifies a group (G7) of seven Lyα emitters at z≈3.577. It measures three intervening absorption systems (S1–S3); S2 is a partial Lyman limit system with inferred [X/H]≈−3.7 and log nH≈−4, which the authors interpret as extremely metal-poor, low-density gas tracing a cosmic filament. A giant Lyα nebula extending ≈260 pkpc is found in MUSE data, aligned with the LAEs, and the paper argues that it is powered by in-situ recombination from the same overdense structure. The central claim is that this constitutes the first direct detection of a cosmic filament through combined absorption and emission tracing.
Significance. If correct, this is a notable result: it connects a quantitative absorption-line measurement of pristine, low-density gas to a galaxy overdensity and a large Lyα nebula at z≈3.6, providing a potential direct view of filamentary gas accretion. The analysis uses standard and publicly available tools (VPFIT, Cloudy, UltraNest, CubEx), and the authors report statistical significances and systematic checks with two UVB models. The main value is the combination of three independent probes (absorption, LAE distribution, nebular emission) on the same structure. However, the interpretation relies on the assumed absence of a local ionizing radiation field in the absorption-line modeling and on the statistical significance of a group selected as the richest in the survey.
major comments (3)
- [§3.2 and §4.2] The photoionization inference for S2 assumes illumination only by the HM05/KS18 metagalactic UVB, while §4.2 invokes a boost of the UV background by a factor comparable to the galaxy overdensity (≈10×) to explain the Lyα surface brightness. S2 is within 100–200 pkpc of the five clustered LAEs and at their velocity centroid, so the same boosted radiation field should be incident on it. Because the derived nH scales approximately linearly with the ionizing photon density at fixed ionization parameter, a 10× boost would shift log nH from about −3.95 to about −3.0 and change the quoted overdensity of ≈5 to ≈50; the inferred [X/H] could also shift if the local spectrum differs from the UVB. The authors should rerun the S2 models with a self-consistent local radiation field (or at least bracket the effect of a 10× boost) and revisit the 'extremely metal-poor, low-density filament' characterization.
- [§4.1] The Poisson probability of 3×10⁻⁶ for detecting seven LAEs is computed for a pre-specified volume, but G7 was selected as the most LAE-rich system in the MUSEQuBES sample. The look-elsewhere factor for the number of independent group searches should be estimated and applied, and the same applies to the 0.3% alignment probability, which is evaluated for the richest group. Without this correction the quoted significances overstate the evidence; the conclusion would be more robust if the trial factor is shown to be modest.
- [§4.1/Figure 4] The reality of the extended Lyα nebula is currently supported only by a connected-voxel threshold (SNR≥1.8, >3500 voxels) and the statement that it spans 16 wavelength layers. Given the low per-voxel SNR and the spatial smoothing applied, a formal false-positive estimate (e.g., noise realizations or randomized source positions) should be provided. This is important because the nebula is a central element of the 'first detection' claim.
minor comments (4)
- [§3.3] The Gaussian prior on log nH for S3 is motivated by maximizing the CIV ion fraction; since S3 is used as supporting evidence for low metallicity, the authors should state how the results depend on this prior and provide a flat-prior comparison if available.
- [Abstract and §4.2] The paper calls this 'the first detection of giant Lyα emission tracing cosmic filaments, linked to normal galaxies,' but it also cites Tornotti et al. (2024b) as 'another recent example.' The novelty claim should be qualified to avoid contradiction with contemporaneous work.
- [§1 and §3.2] The definition of [X/H] in the introduction uses the solar metallicity of Grevesse et al. (2012), while the Cloudy models assume Asplund et al. (2009) abundances; the consistency of these abundance scales should be stated explicitly.
- [§3.2] The reported uncertainties on [X/H] and nH are formal posterior intervals; a brief statement of systematic uncertainties from the assumed uniform-slab geometry and from variations in the ionizing spectrum would help the reader gauge the robustness of the central claim.
Circularity Check
No circularity: absorption-line fitting, LAE overdensity statistics, and nebula detection are independent steps; the UVB radiation-field tension is a modeling assumption, not a reduction by construction.
full rationale
The derivation chain is self-contained in the sense required by the circularity check. The [X/H] and nH values for S1/S2/S3 are obtained by fitting Cloudy photoionization models to measured H I and metal column densities (Sections 3.2 and 3.3), which is standard parameter estimation, not a prediction of the fitted inputs. The LAE overdensity is tested against the independent luminosity function of Drake et al. (2017) and Herenz et al. (2019), and the linear alignment is assessed with a Monte Carlo random-placement simulation; neither presupposes a filament. The extended Ly-alpha nebula is independently detected with CubEx on PSF- and continuum-subtracted MUSE data, and the claim that it is powered by in-situ recombination is an interpretation comparing the observed surface brightness to the UVB-only expectation (Section 4.2). The only internal tension is that the absorption-line models for S2 exclude the LAE radiation field that Section 4.2 invokes to explain the nebula, but this is a systematic modeling assumption (and is acknowledged with a 0.33 dex correction for LAE Id:2), not a step in which the conclusion is assumed by construction or by self-citation. Self-citations to MUSEQuBES survey data papers (Muzahid et al. 2020, 2021; Banerjee et al. 2023, 2024) provide the data products and a Ly-alpha redshift correction, but they are not used to define the physical result; the central claim therefore has independent empirical content.
Assumptions & free parameters
free parameters (3)
- Hydrogen density nH of S2 =
log10 nH/cm^-3 = -3.95 (HM05), -4.27 (KS18)
- Metallicity [X/H] of S2 =
-3.69 (HM05), -4.08 (KS18)
- Density prior for S3 =
log10 nH/cm^-3 ≈ -3.5 ± 0.5
assumptions (5)
- domain assumption Flat ΛCDM cosmology with H0=70 km/s/Mpc, Ωm=0.3, ΩΛ=0.7
- domain assumption The absorbing gas is a uniform slab in thermal and ionization equilibrium, with solar abundance ratios, no dust, illuminated by the HM05 or KS18 metagalactic UV background plus CMB
- domain assumption Lyman-alpha redshifts of LAEs can be corrected to systemic using the empirical relation of Muzahid et al. 2020
- domain assumption The velocity association between absorption systems S1, S2, S3 and G7 LAEs implies physical proximity within a single filament
- standard math Voigt profile fitting with vpfit correctly separates the roughly 30 H I components and contaminating transitions
Cite this review
Pith. "Pith review of MUSEQuBES: Unveiling Cosmic Web Filaments at $z\approx3.6$ through Dual Absorption and Emission Line Analysis." pith.science (2026). https://pith.science/paper/LUCV7Z6X
@misc{pith2026241204546,
  author       = {Pith},
  title        = {Pith review of: MUSEQuBES: Unveiling Cosmic Web Filaments at $z\approx3.6$ through Dual Absorption and Emission Line Analysis},
  year         = {2026},
  howpublished = {\url{https://pith.science/paper/LUCV7Z6X}},
  note         = {Machine review of arXiv:2412.04546}
}
abstract
According to modern cosmological models, galaxies are embedded within cosmic filaments, which supply a continuous flow of pristine gas, fueling star formation and driving their evolution. However, due to their low density, the direct detection of diffuse gas in cosmic filaments remains elusive. Here, we report the discovery of an extremely metal-poor ($[ X/H] \approx -3.7$), low-density ($\log_{10} n_{\rm H}/{\rm cm^{-3}} \approx -4$, corresponding to an overdensity of $\approx 5$) partial Lyman limit system (pLLS) at $z\approx3.577$ along the quasar sightline Q1317--0507, probing cosmic filaments. Additionally, two other low-metallicity (\met$\lesssim -2$) absorption systems are detected at similar redshifts, one of which is also a pLLS. VLT/MUSE observations reveal a significant overdensity of \lya\ emitters (LAEs) associated with these absorbers. The spatial distribution of the LAEs strongly suggests the presence of an underlying filamentary structure. This is further supported by the detection of a large \lya\ emitting nebula with a surface brightness of $\geq 10^{-19}~\rm erg~cm^{-2}~s^{-1}~arcsec^{-2}$, with a maximum projected linear size of $\approx 260$~pkpc extending along the LAEs. This is the first detection of giant \lya\ emission tracing cosmic filaments, linked to normal galaxies and likely powered by in-situ recombination.
Figures


Figures from the paper (1 more)

Forward citations
Cited by 1 Pith paper
-
The cosmic web's Lyman-$\alpha$ glow at $z \approx 2.5$; hydrodynamic models, dust, and wide-field, narrow-band detection
Five cosmological simulations predict that the faint ultraviolet excess seen by the Condor telescope at z≈2.5 is Lyman-alpha light from the cosmic web, with measurable detection thresholds for wide-field surveys.
Reference graph
Works this paper leans on
-
[1]
Asplund, M., Grevesse, N., Sauval, A. J., & Scott, P. 2009, ARA&A, 47, 481, doi: 10.1146/annurev.astro.46.060407.145222 Astropy Collaboration, Robitaille, T. P., Tollerud, E. J., et al. 2013, A&A, 558, A33, doi: 10.1051/0004-6361/201322068
arXiv 2009
-
[2]
2010, in Society of Photo-Optical Instrumentation Engineers (SPIE) Conference Series, Vol
Bacon, R., Accardo, M., Adjali, L., et al. 2010, in Society of Photo-Optical Instrumentation Engineers (SPIE) Conference Series, Vol. 7735, Ground-based and Airborne Instrumentation for Astronomy III, ed. I. S. McLean, S. K. Ramsay, & H. Takami, 773508, doi: 10.1117/12.856027
-
[3]
2021, A&A, 647, A107, doi: 10.1051/0004-6361/202039887
Bacon, R., Mary, D., Garel, T., et al. 2021, A&A, 647, A107, doi: 10.1051/0004-6361/202039887
-
[4]
2023, MNRAS, 524, 5148, doi: 10.1093/mnras/stad2022
Cantalupo, S. 2023, MNRAS, 524, 5148, doi: 10.1093/mnras/stad2022
-
[5]
2024, arXiv e-prints, arXiv:2411.11959
Banerjee, E., Muzahid, S., Schaye, J., et al. 2024, arXiv e-prints, arXiv:2411.11959. https://arxiv.org/abs/2411.11959
arXiv 2024
-
[6]
Borisova, E., Cantalupo, S., Lilly, S. J., et al. 2016, ApJ, 831, 39, doi: 10.3847/0004-637X/831/1/39
-
[7]
Hennawi, J. F., & Madau, P. 2014, Nature, 506, 63, doi: 10.1038/nature12898 8
-
[8]
Cantalupo, S., Porciani, C., Lilly, S. J., & Miniati, F. 2005, ApJ, 628, 61, doi: 10.1086/430758
doi:10.1086/430758 2005
Show all 46 references
-
[9]
J., et al
Cantalupo, S., Pezzulli, G., Lilly, S. J., et al. 2019, MNRAS, 483, 5188, doi: 10.1093/mnras/sty3481
2019 doi
-
[10]
F., & Webb, J
Carswell, R. F., & Webb, J. K. 2014, VPFIT: Voigt profile fitting program, Astrophysics Source Code Library, record ascl:1408.015. http://ascl.net/1408.015
2014
-
[11]
Crighton, N. H. M., Hennawi, J. F., & Prochaska, J. X. 2013, ApJL, 776, L18, doi: 10.1088/2041-8205/776/2/L18
2013 doi
-
[12]
Crighton, N. H. M., Hennawi, J. F., Simcoe, R. A., et al. 2015, MNRAS, 446, 18, doi: 10.1093/mnras/stu2088
2015 doi
-
[13]
B., Garel, T., Wisotzki, L., et al
Drake, A. B., Garel, T., Wisotzki, L., et al. 2017, A&A, 608, A6, doi: 10.1051/0004-6361/201731431
2017 doi
- [14]
-
[15]
2016a, MNRAS, 462, 1978, doi: 10.1093/mnras/stw1782
Fumagalli, M., Cantalupo, S., Dekel, A., et al. 2016a, MNRAS, 462, 1978, doi: 10.1093/mnras/stw1782
1978 doi
-
[16]
M., & Prochaska, J
Fumagalli, M., O’Meara, J. M., & Prochaska, J. X. 2016b, MNRAS, 455, 4100, doi: 10.1093/mnras/stv2616
-
[17]
2013, ApJ, 775, 78, doi: 10.1088/0004-637X/775/1/78
Worseck, G. 2013, ApJ, 775, 78, doi: 10.1088/0004-637X/775/1/78
2013 doi
-
[19]
J., & Scott, P
Grevesse, N., Asplund, M., Sauval, A. J., & Scott, P. 2012, in Astronomical Society of the Pacific Conference Series, Vol. 462, Progress in Solar/Stellar Physics with Helio- and Asteroseismology, ed. H. Shibahashi, M. Takata, & A. E. Lynas-Gray, 41
2012
-
[20]
2024, A&A, 688, A37, doi: 10.1051/0004-6361/202347658
Guo, Y., Bacon, R., Wisotzki, L., et al. 2024, A&A, 688, A37, doi: 10.1051/0004-6361/202347658
2024 doi
- [21]
-
[22]
2012, ApJ, 746, 125, doi: 10.1088/0004-637X/746/2/125
Haardt, F., & Madau, P. 2012, ApJ, 746, 125, doi: 10.1088/0004-637X/746/2/125
2012 doi
-
[23]
R., Millman, K
Harris, C. R., Millman, K. J., van der Walt, S. J., et al. 2020, Nature, 585, 357, doi: 10.1038/s41586-020-2649-2
2020 doi
-
[24]
Hellsten, U., Hernquist, L., Katz, N., & Weinberg, D. H. 1998, ApJ, 499, 172, doi: 10.1086/305622
1998 doi
-
[25]
C., Wisotzki, L., Saust, R., et al
Herenz, E. C., Wisotzki, L., Saust, R., et al. 2019, A&A, 621, A107, doi: 10.1051/0004-6361/201834164
2019 doi
- [26]
-
[27]
Hunter, J. D. 2007, Computing in Science and Engineering, 9, 90, doi: 10.1109/MCSE.2007.55
2007 doi
-
[28]
D., Schaye, J., Walth, G
Johnson, S. D., Schaye, J., Walth, G. L., et al. 2022, arXiv e-prints, arXiv:2209.04245. https://arxiv.org/abs/2209.04245 Kereˇ s, D., Katz, N., Weinberg, D. H., & Dav´ e, R. 2005, MNRAS, 363, 2, doi: 10.1111/j.1365-2966.2005.09451.x
2022 arXiv
-
[29]
2019, MNRAS, 484, 4174, doi: 10.1093/mnras/stz174
Khaire, V., & Srianand, R. 2019, MNRAS, 484, 4174, doi: 10.1093/mnras/stz174
2019 doi
-
[30]
M., Howk, J
Lehner, N., O’Meara, J. M., Howk, J. C., Prochaska, J. X., & Fumagalli, M. 2016, ApJ, 833, 283, doi: 10.3847/1538-4357/833/2/283
2016 doi
-
[31]
B., Howk, J
Lehner, N., Wotta, C. B., Howk, J. C., et al. 2018, ApJ, 866, 33, doi: 10.3847/1538-4357/aadd03
2018 doi
-
[32]
M., et al
Lehner, N., Kopenhafer, C., O’Meara, J. M., et al. 2022, ApJ, 936, 156, doi: 10.3847/1538-4357/ac7400
2022 doi
-
[33]
K., Fumagalli, M., Fossati, M., et al
Lofthouse, E. K., Fumagalli, M., Fossati, M., et al. 2023, MNRAS, 518, 305, doi: 10.1093/mnras/stac3089 L´ opez, S., D’Odorico, V., Ellison, S. L., et al. 2016, A&A, 594, A91, doi: 10.1051/0004-6361/201628161
2023 doi
-
[34]
2019, MNRAS, 487, 5070, doi: 10.1093/mnras/stz1501
Mackenzie, R., Fumagalli, M., Theuns, T., et al. 2019, MNRAS, 487, 5070, doi: 10.1093/mnras/stz1501
2019 doi
-
[35]
2014, ARA&A, 52, 415, doi: 10.1146/annurev-astro-081811-125615
Madau, P., & Dickinson, M. 2014, ARA&A, 52, 415, doi: 10.1146/annurev-astro-081811-125615
2014 doi
-
[36]
Carswell, R. F. 2019, MNRAS, 482, 3458, doi: 10.1093/mnras/sty2834
2019 doi
-
[37]
A., et al
Muzahid, S., Schaye, J., Marino, R. A., et al. 2020, MNRAS, 496, 1013, doi: 10.1093/mnras/staa1347
2020 doi
-
[38]
2021, MNRAS, 508, 5612, doi: 10.1093/mnras/stab2933
Muzahid, S., Schaye, J., Cantalupo, S., et al. 2021, MNRAS, 508, 5612, doi: 10.1093/mnras/stab2933
2021 doi
-
[39]
X., Werk, J
Prochaska, J. X., Werk, J. K., Worseck, G., et al. 2017, ApJ, 837, 169, doi: 10.3847/1538-4357/aa6007
2017 doi
-
[40]
C., & Rudie, G
Rakic, O., Schaye, J., Steidel, C. C., & Rudie, G. C. 2011, MNRAS, 414, 3265, doi: 10.1111/j.1365-2966.2011.18624.x
2011
-
[41]
C., et al
Ribaudo, J., Lehner, N., Howk, J. C., et al. 2011, ApJ, 743, 207, doi: 10.1088/0004-637X/743/2/207
2011 doi
-
[42]
2001, ApJ, 559, 507, doi: 10.1086/322421
Schaye, J. 2001, ApJ, 559, 507, doi: 10.1086/322421
2001 doi
-
[43]
2014, The Astrophysical Journal, 788, 74, doi: 10.1088/0004-637x/788/1/74
Shibuya, T., Ouchi, M., Nakajima, K., et al. 2014, The Astrophysical Journal, 788, 74, doi: 10.1088/0004-637x/788/1/74
2014 doi
-
[44]
C., Erb, D
Steidel, C. C., Erb, D. K., Shapley, A. E., et al. 2010, The Astrophysical Journal, 717, 289, doi: 10.1088/0004-637x/717/1/289
2010 doi
-
[45]
2024a, arXiv e-prints, arXiv:2406.17035, doi: 10.48550/arXiv.2406.17035 —
Tornotti, D., Fumagalli, M., Fossati, M., et al. 2024a, arXiv e-prints, arXiv:2406.17035, doi: 10.48550/arXiv.2406.17035 —. 2024b, arXiv e-prints, arXiv:2412.06895, doi: 10.48550/arXiv.2412.06895 9 van de Voort, F., Schaye, J., Altay, G., & Theuns, T. 2012, MNRAS, 421, 2809, d...
-
[46]
2018, MNRAS, 478, L60, doi: 10.1093/mnrasl/sly058
Verhamme, A., Garel, T., Ventou, E., et al. 2018, MNRAS, 478, L60, doi: 10.1093/mnrasl/sly058
2018 doi
-
[47]
E., et al
Virtanen, P., Gommers, R., Oliphant, T. E., et al. 2020, Nature Methods, 17, 261, doi: 10.1038/s41592-019-0686-2
2020 doi
Reviewed August 11, 2026 · model on record in the stance chip above.
Discussion (0). Continue with ORCID to comment.