Synchrotron and free-free mapping with simulated REACH observations between 50-170 MHz
Pith reviewed 2026-07-02 01:07 UTC · model grok-4.3
The pith
Fitting independent synchrotron and free-free components to low-frequency data enables component-separated radio sky maps.
A machine-rendered reading of the paper's core claim, the machinery that carries it, and where it could break.
Core claim
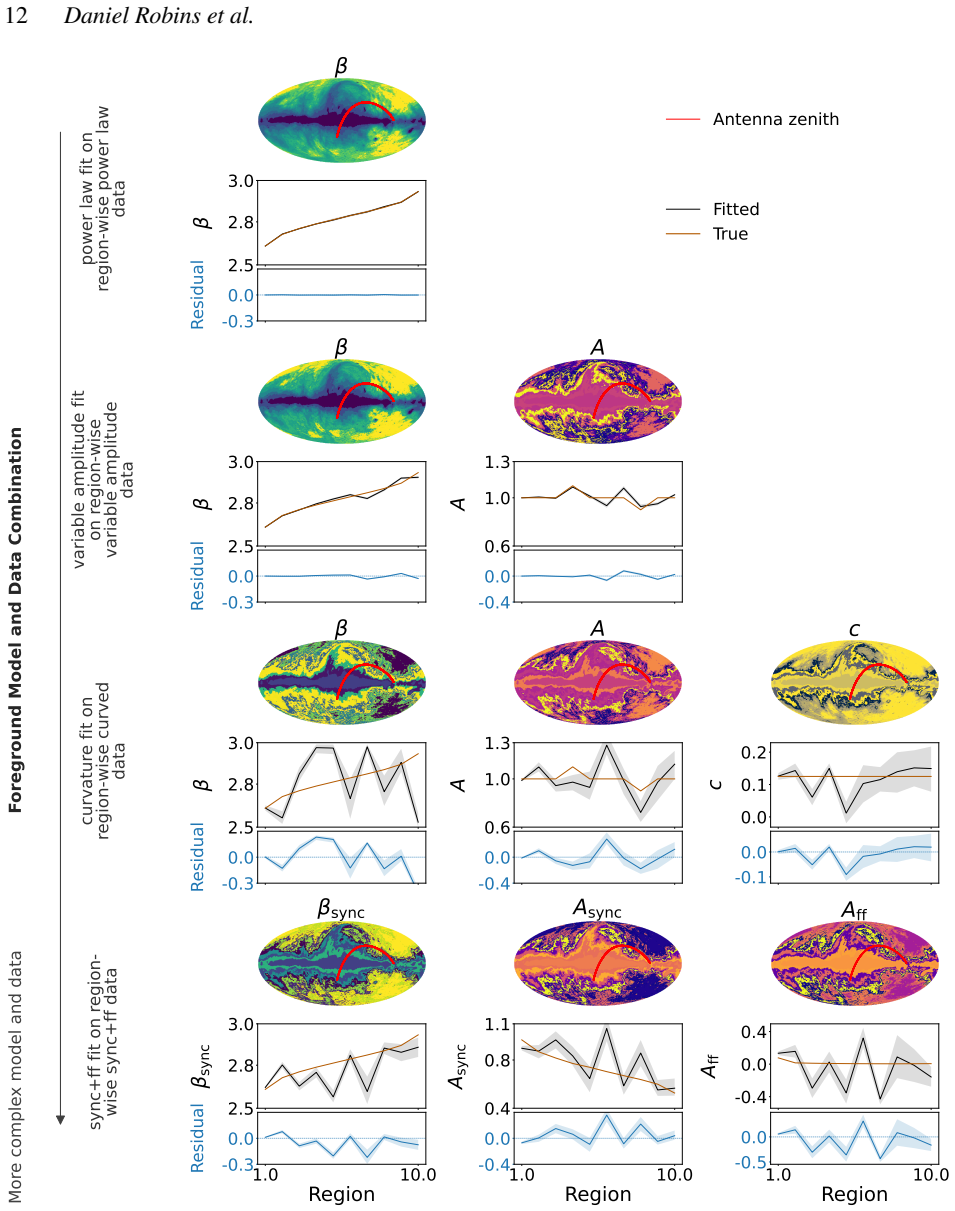
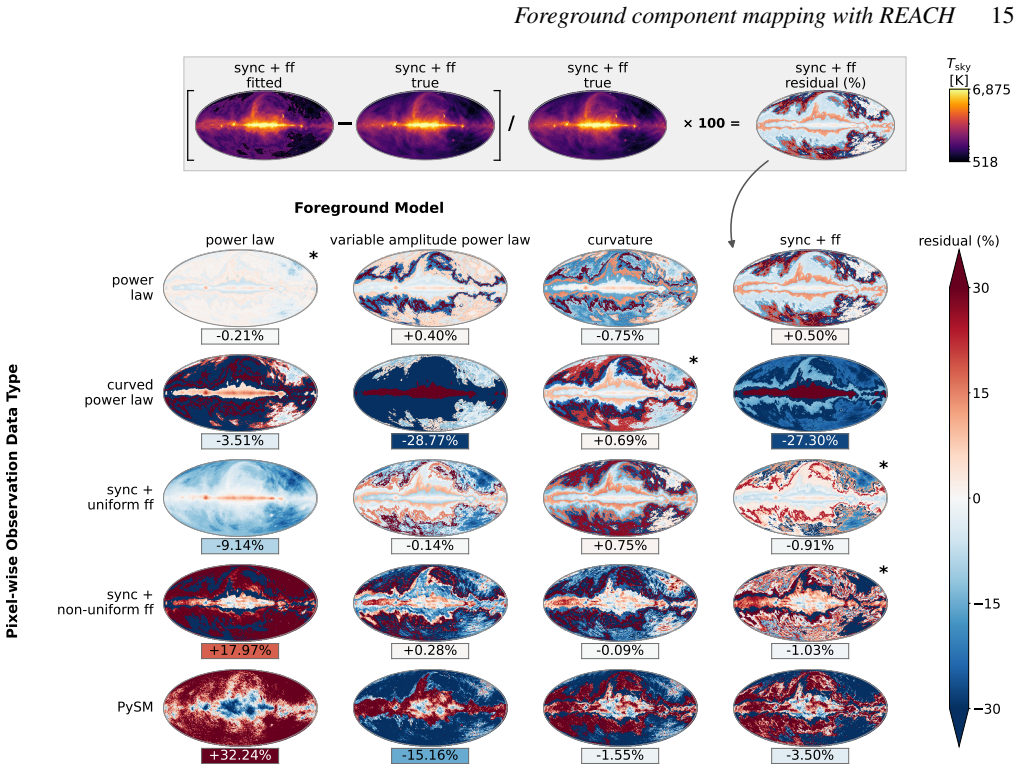
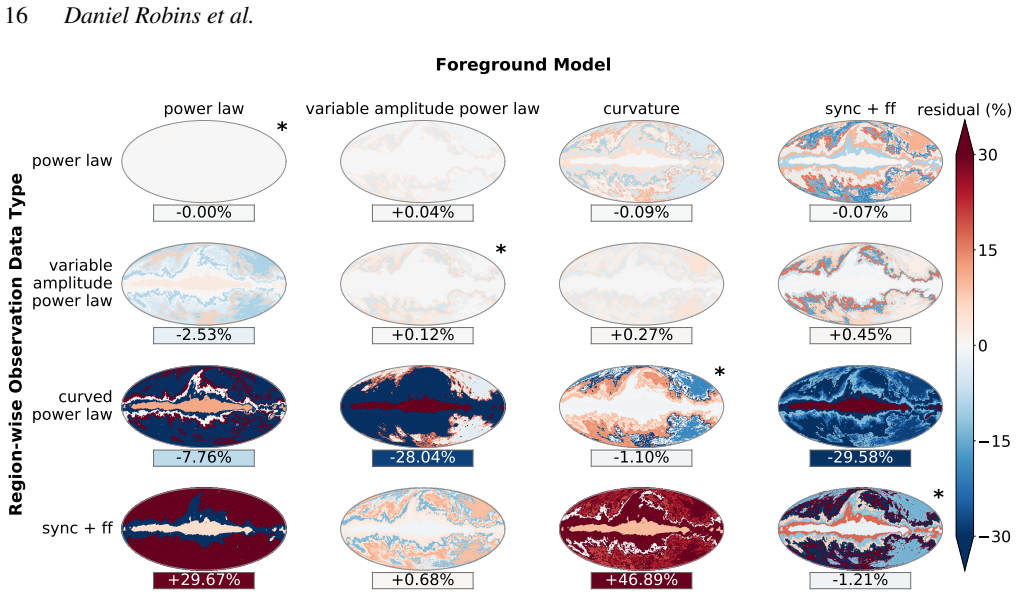
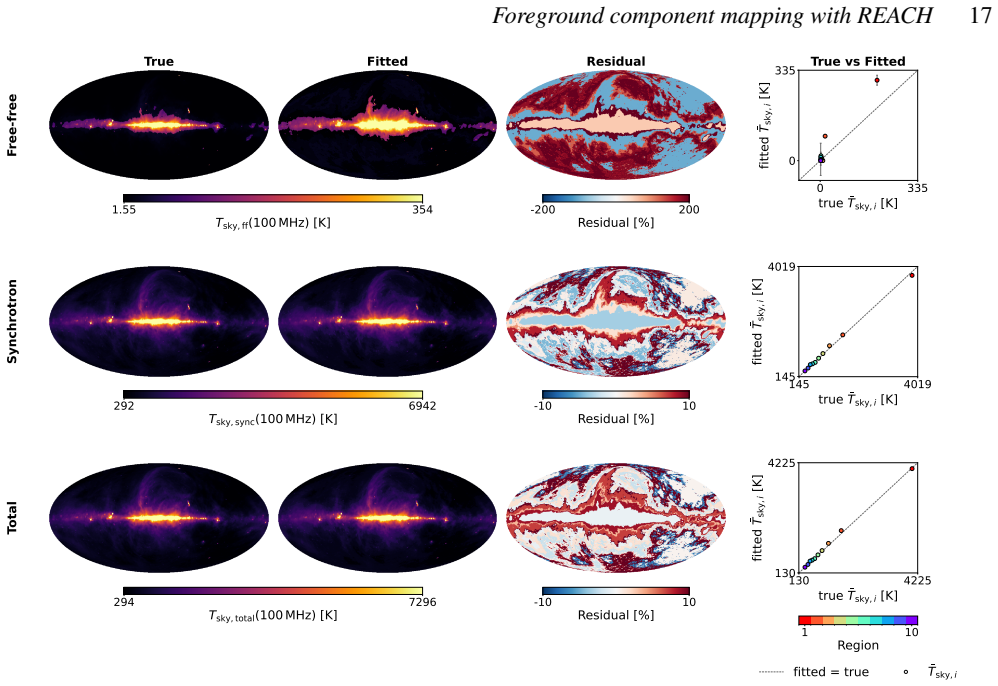
Fitting a foreground with independent synchrotron and free-free emission enables component-separated sky mapping at 50-170 MHz. Synchrotron is well-recovered across the sky, but free-free recovery is limited. More complex foreground datasets require correspondingly complex models to recover the 21cm signal, yet these models introduce degeneracies that limit accurate recovery of foreground parameters.
What carries the argument
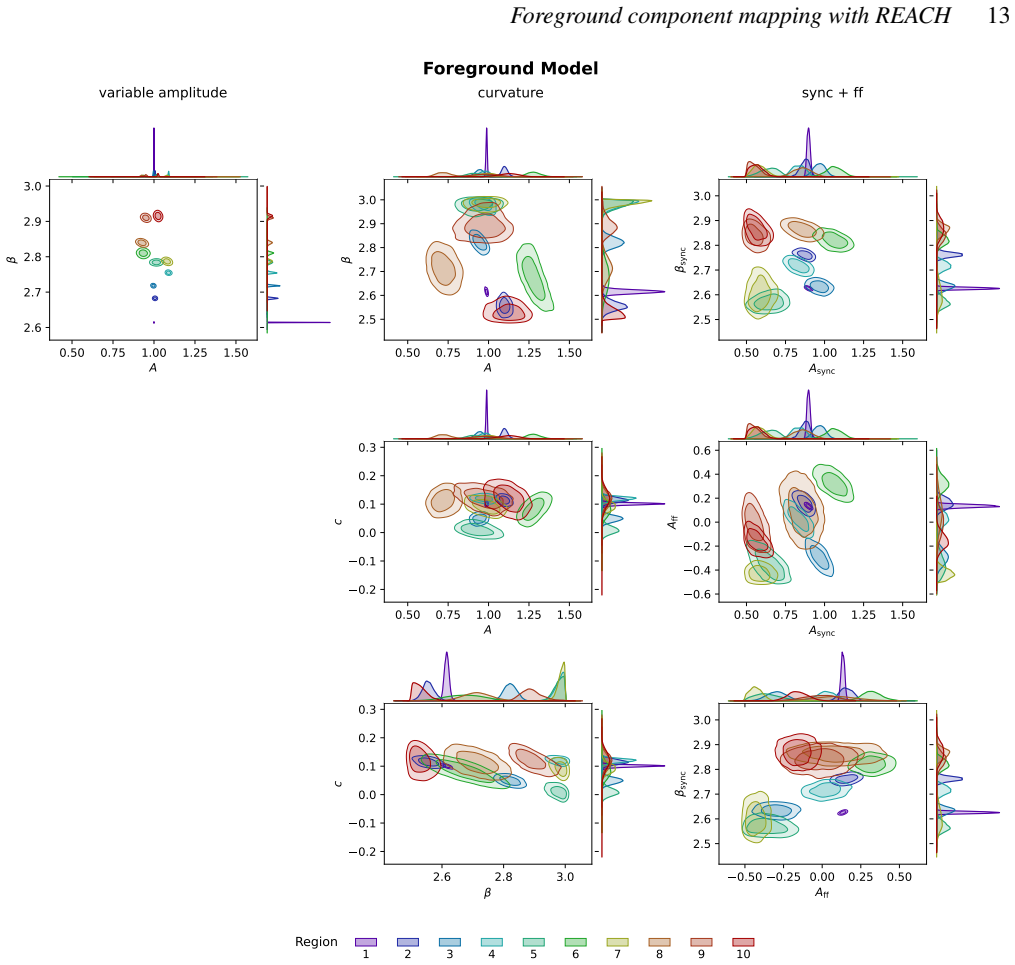
Joint fitting of signal and foreground spectral parameters to an existing sky map, using physically motivated foreground models that increase in complexity from a pure synchrotron power law to models including variable amplitudes, curvature, and a free-free component.
If this is right
- More complex datasets require correspondingly complex models to recover the 21cm signal without bias.
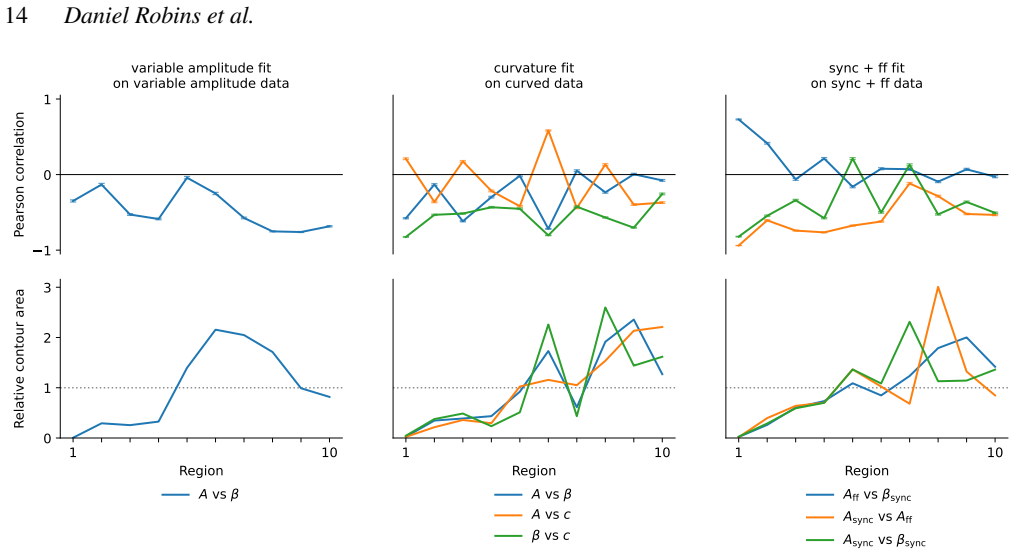
- Added model complexity introduces degeneracies that limit accurate recovery of foreground parameters.
- Synchrotron emission is recovered well across the sky.
- Free-free recovery remains limited.
- The method supports probing Galactic physics at uniquely low frequencies in addition to 21cm detection.
Where Pith is reading between the lines
- Component-separated maps at these frequencies could supply new constraints on the distribution of ionized gas in the Galaxy.
- The same fitting approach might be adapted to other wide-band radio datasets to test consistency of emission models.
- Limited free-free recovery suggests that additional frequency coverage or polarization data could be needed to break degeneracies.
- The technique offers a route to absolutely calibrated maps that could serve as reference fields for higher-frequency surveys.
Load-bearing premise
Simulated observations accurately represent the true foreground emission so that recovery performance in simulations indicates real-world performance.
What would settle it
Direct comparison of recovered synchrotron and free-free maps against independent low-frequency measurements that show whether the separation remains accurate once real instrumental effects and unmodeled emission are present.
Figures
read the original abstract
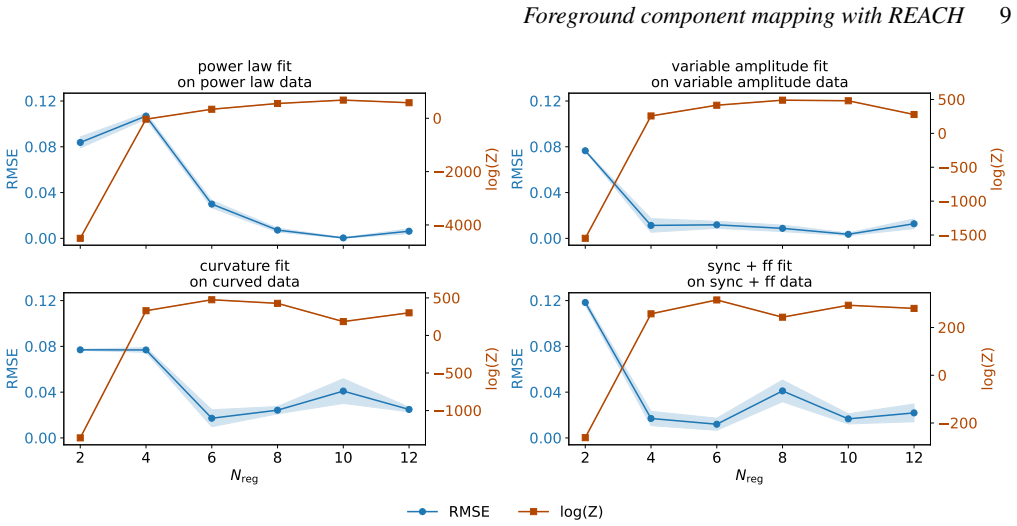
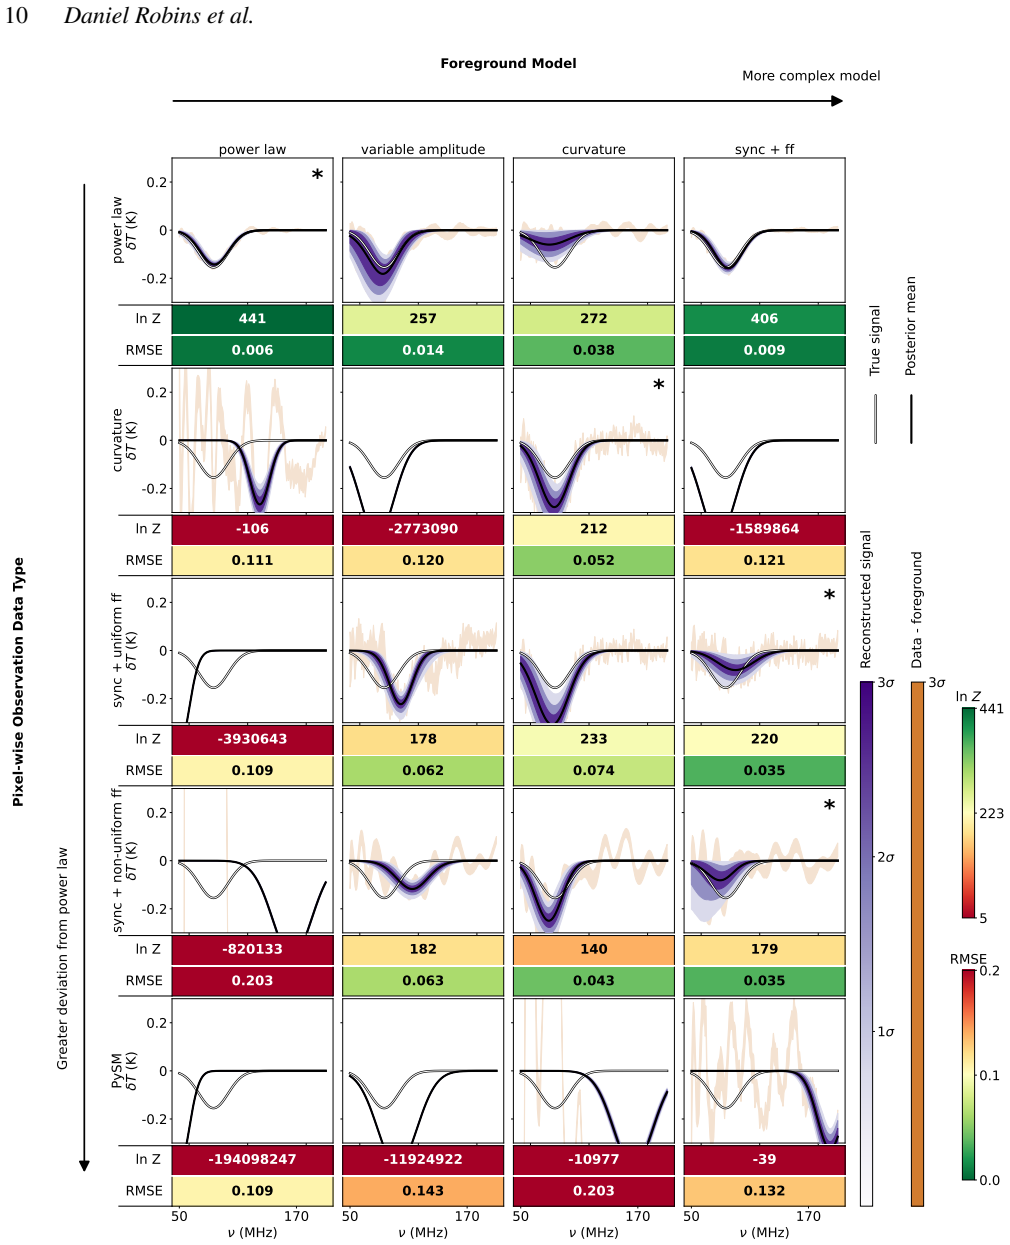
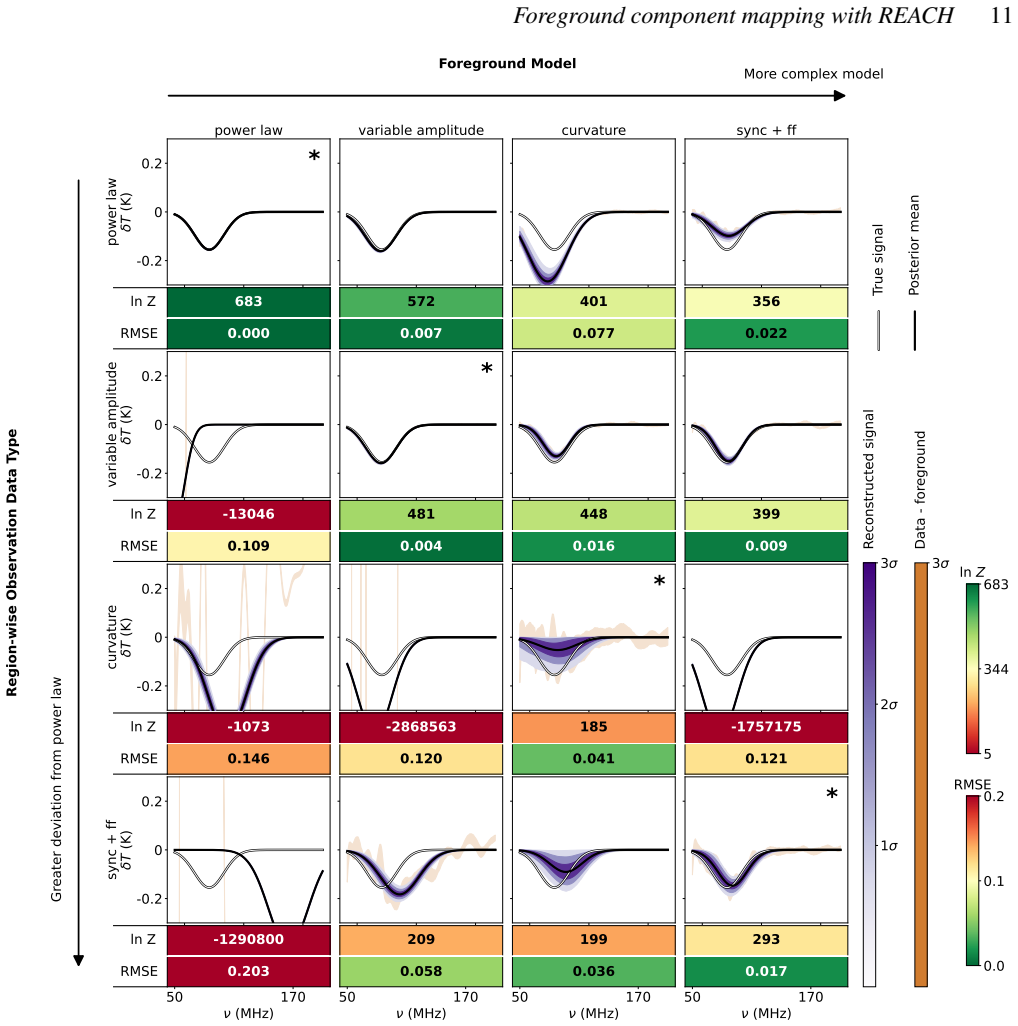
Global 21cm experiments aim to detect the hydrogen 21cm signal by separating it from foreground emission that can be orders of magnitude brighter than the signal. REACH (the Radio Experiment for the Analysis of Cosmic Hydrogen) forward-models the sky by jointly fitting signal and foreground spectral parameters to an existing sky map. The fitted parameters yield spectrally constrained, absolutely calibrated maps of the radio sky across the full 50-170 MHz observing band, among the lowest continuous frequencies yet mapped. We assess REACH's ability to fit the 21cm signal and recover accurate foreground maps, using physically motivated foreground models of increasing complexity (starting from a pure synchrotron power law model, then introducing variable amplitudes, curvature, and a free-free component). We evaluate these models against simulated REACH observations of correspondingly complex foregrounds, based on the Global Sky Model and the Python Sky Model. To recover the 21cm signal, more complex datasets require correspondingly complex models, but this introduces degeneracies which limit accurate recovery of foreground parameters. Fitting a foreground with independent synchrotron and free-free emission enables component-separated sky mapping, which has applications beyond radio cosmology; synchrotron is well-recovered across the sky, but free-free recovery is limited. REACH is therefore capable of probing Galactic physics at uniquely low frequencies, alongside its primary goal of detecting the 21cm signal.
Editorial analysis
A structured set of objections, weighed in public.
Referee Report
Summary. The paper presents a simulation-based assessment of the REACH experiment's forward-modeling approach for jointly recovering the 21cm signal and producing absolutely calibrated, component-separated maps of synchrotron and free-free emission over 50-170 MHz. Using foreground models of increasing complexity (power-law synchrotron, then with variable amplitude/curvature, then adding free-free) fit to simulated observations generated from the Global Sky Model (GSM) and Python Sky Model (PSM), it finds that more complex data require correspondingly complex models but introduce degeneracies; independent synchrotron + free-free fitting enables component separation, with synchrotron well recovered across the sky while free-free recovery is limited.
Significance. If the simulation results hold under realistic conditions, the demonstration that independent synchrotron and free-free fitting yields component-separated maps (with robust synchrotron recovery) provides a concrete path to low-frequency Galactic astrophysics applications alongside the primary 21cm goal. The use of independent external sky models (GSM/PSM) as truth for recovery testing is a strength that avoids circularity in the performance metrics.
major comments (2)
- [Abstract, discussion] Abstract and discussion: The central claim that the approach 'enables component-separated sky mapping, which has applications beyond radio cosmology' and that 'REACH is therefore capable of probing Galactic physics' is load-bearing on the assumption that GSM and PSM accurately represent true foreground spectral/spatial structure at 50-170 MHz. No quantitative validation against independent low-frequency observations (e.g., from other experiments) is provided to bound the model mismatch, which directly limits the strength of the real-world extension.
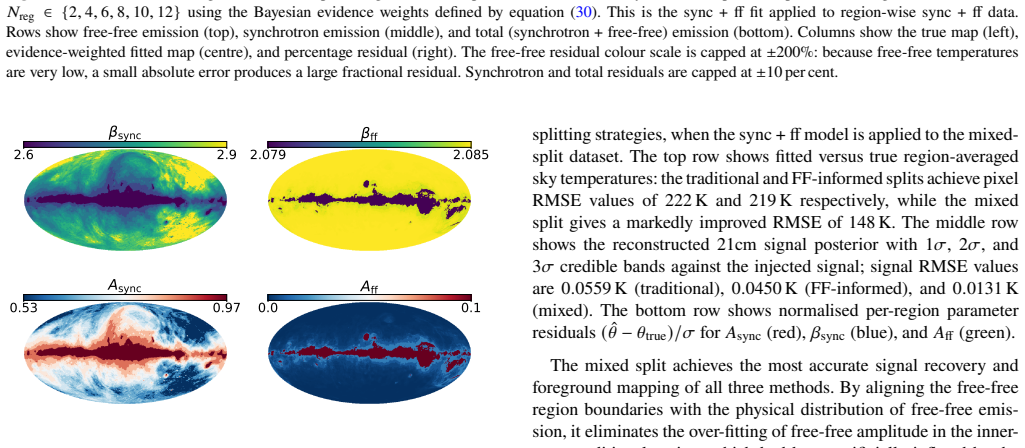
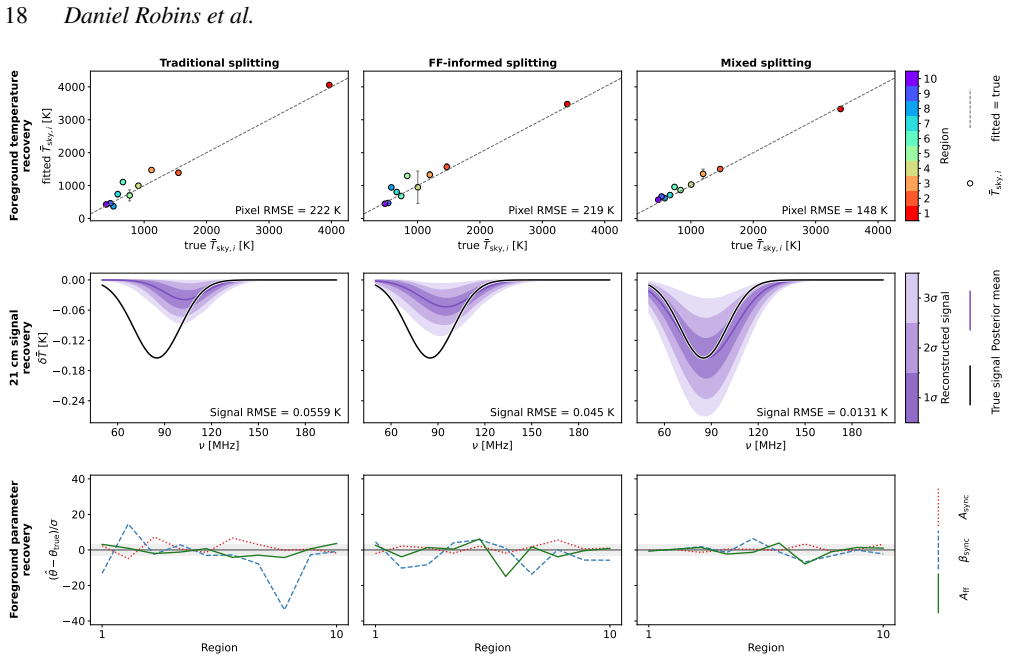
- [Results section on increasing model complexity] Results on model complexity: While the text states that 'more complex datasets require correspondingly complex models but this introduces degeneracies which limit accurate recovery of foreground parameters,' no explicit quantification (e.g., parameter covariance matrices or degeneracy metrics between free-free amplitude and synchrotron curvature) is shown to support the differential recovery performance between synchrotron and free-free.
minor comments (2)
- [Title, abstract] The title and abstract could more explicitly note that all results are simulation-based rather than on real REACH data to avoid potential misreading of the scope.
- [Methods on foreground models] Notation for the free-free amplitude parameter should be defined consistently when first introduced in the model descriptions.
Simulated Author's Rebuttal
We thank the referee for their constructive and detailed comments. We address each major comment below and will revise the manuscript accordingly to improve clarity and support for the claims.
read point-by-point responses
-
Referee: [Abstract, discussion] Abstract and discussion: The central claim that the approach 'enables component-separated sky mapping, which has applications beyond radio cosmology' and that 'REACH is therefore capable of probing Galactic physics' is load-bearing on the assumption that GSM and PSM accurately represent true foreground spectral/spatial structure at 50-170 MHz. No quantitative validation against independent low-frequency observations (e.g., from other experiments) is provided to bound the model mismatch, which directly limits the strength of the real-world extension.
Authors: We agree that the extension of our results to real-world Galactic physics applications assumes the fidelity of the GSM and PSM models at 50-170 MHz. The manuscript presents a controlled simulation study that tests recovery performance when the input foregrounds are drawn from these models. To address the concern, we will revise the abstract and discussion sections to explicitly state that the demonstrated component separation holds under the simulated conditions based on GSM/PSM, and that quantitative validation against independent low-frequency observations would be needed to support definitive astrophysical inferences. This revision will clarify the scope of the claims without altering the core simulation results. revision: yes
-
Referee: [Results section on increasing model complexity] Results on model complexity: While the text states that 'more complex datasets require correspondingly complex models but this introduces degeneracies which limit accurate recovery of foreground parameters,' no explicit quantification (e.g., parameter covariance matrices or degeneracy metrics between free-free amplitude and synchrotron curvature) is shown to support the differential recovery performance between synchrotron and free-free.
Authors: We acknowledge that explicit quantification of the reported degeneracies would strengthen the results section. In the revised manuscript we will include the parameter covariance matrices obtained from the fits (or derived correlation coefficients) and add degeneracy metrics specifically between free-free amplitude and synchrotron curvature to quantitatively illustrate the differential recovery performance. revision: yes
Circularity Check
No significant circularity; recovery tested against independent external simulation truth.
full rationale
The paper performs a standard simulation-based recovery test: observations are generated from independent external sky models (GSM, PSM), then fitted with parametric models of increasing complexity. Performance metrics (synchrotron recovery across sky, limited free-free recovery) are obtained by direct comparison to the known simulation inputs, not by construction from the fitted parameters. No self-definitional equations, fitted-input-as-prediction steps, or load-bearing self-citations appear in the derivation chain. The central claim about component-separated mapping is validated externally rather than assumed.
Axiom & Free-Parameter Ledger
free parameters (3)
- synchrotron spectral index
- curvature parameter
- free-free amplitude
axioms (2)
- domain assumption Foreground emission consists of synchrotron and free-free components with known spectral dependencies
- domain assumption The Global Sky Model and Python Sky Model provide accurate representations of the radio sky for simulation purposes
Reference graph
Works this paper leans on
-
[1]
Nature Astronomy , year =
-
[2]
Bowman, J. D. and Rogers, A. E. E. and Monsalve, R. A. and Mozdzen, T. J. and Mahesh, N. , title =. Nature , year =
-
[3]
and others , title =
Singh, S. and others , title =. ApJ , year =
-
[4]
and others , title =
Paciga, G. and others , title =. MNRAS , year =
-
[5]
Pritchard, J. R. and Loeb, A. , title =. Reports on Progress in Physics , year =
-
[6]
Furlanetto, S. R. and Oh, S. P. and Briggs, F. H. , title =. Physics Reports , year =
-
[7]
and Shaw, J
Liu, A. and Shaw, J. R. , title =. PASP , year =
-
[8]
Santos, M. G. and Cooray, A. and Knox, L. , title =. ApJ , year =
-
[9]
Harker, G. J. A. and others , title =. MNRAS , year =
-
[10]
and de Bruyn, A
Bernardi, G. and de Bruyn, A. G. and Brentjens, M. A. and others , title =. A&A , year =
-
[11]
and Shankar, N
Vedantham, H. and Shankar, N. U. and Subrahmanyan, R. , title =. ApJ , year =
-
[12]
and others , title =
Kogut, A. and others , title =. ApJ , year =
-
[13]
and Burigana, C
Platania, P. and Burigana, C. and Maino, D. and others , title =. A&A , year =
-
[14]
and Davies, R
Dickinson, C. and Davies, R. D. and Davis, R. J. , title =. MNRAS , year =
-
[15]
and Tegmark, M
de Oliveira-Costa, A. and Tegmark, M. and Gaensler, B. M. and Jonas, J. and Landecker, T. L. and Reich, P. , title =. MNRAS , year =
-
[16]
Remazeilles, M. and Dickinson, C. and Banday, A. J. and Bigot-Sazy, M.-A. and Ghosh, T. , title =. MNRAS , year =. doi:10.1093/mnras/stv1274 , eprint =
-
[17]
Irfan, M. O. , title =. MNRAS , year =
-
[18]
and Anderson, C
Hutschenreuter, S. and Anderson, C. S. and Betti, S. and Bower, G. C. and Brown, J.-A. and others , title =. A&A , year =
-
[19]
and Dunkley, J
Thorne, B. and Dunkley, J. and Alonso, D. and N. MNRAS , year =
-
[20]
and Delabrouille, J
Th\'ebault, C. and Delabrouille, J. and Cardoso, J.-F. , title =. A&A , year =
-
[21]
and others , title =
Zheng, H. and others , title =. MNRAS , year =
-
[22]
and Subrahmanyan, R
Sathyanarayana Rao, M. and Subrahmanyan, R. and Udaya Shankar, N. and Chluba, J. , title =. MNRAS , year =
-
[23]
Handley, W. J. and Hobson, M. P. and Lasenby, A. N. , title =. MNRAS , year =
-
[24]
Handley, W. J. and Hobson, M. P. and Lasenby, A. N. , title =. MNRAS Letters , year =
-
[25]
, title =
Skilling, J. , title =. Bayesian Analysis , year =
-
[26]
, title =
Trotta, R. , title =. Contemporary Physics , year =
-
[27]
Liddle, A. R. , title =. MNRAS , year =
-
[28]
Burnham, K. P. and Anderson, D. R. , title =. 2002 , edition =
2002
-
[29]
, title =
Schwarz, G. , title =. The Annals of Statistics , year =
-
[30]
MNRAS , volume=
A general Bayesian framework to account for foreground map errors in global 21-cm experiments , author=. MNRAS , volume=. 2024 , publisher=
2024
-
[31]
Monsalve, R. A. and Rogers, A. E. E. and Bowman, J. D. and Mozdzen, T. J. , title =. ApJ , year =
-
[32]
and de Lera Acedo, E
Anstey, D. and de Lera Acedo, E. and Handley, W. J. , title =. MNRAS , year =
-
[33]
Bevins, H. T. J. and Handley, W. J. and Fialkov, A. and de Lera Acedo, E. and Greenhill, L. J. and Price, D. C. , title =. MNRAS , year =
-
[34]
Bevins, H. T. J. and de Lera Acedo, E. and Fialkov, A. and Handley, W. J. and Singh, S. and Subrahmanyan, R. and Barkana, R. , title =. Nature Astronomy , year =
-
[35]
Haslam, C. G. T. and Salter, C. J. and Stoffel, H. and Wilson, W. E. , title =. A&AS , year =
-
[36]
I , author=
A radio continuum survey of the northern sky at 1420 MHz. I , author=. A&AS , volume=
-
[37]
Rybicki, G. B. and Lightman, A. P. , title =
-
[38]
Draine, B. T. , title =
-
[39]
MNRAS , volume=
Measurements of the diffuse Galactic synchrotron spectral index and curvature from MeerKLASS pilot data , author=. MNRAS , volume=. 2022 , publisher=
2022
-
[40]
MNRAS , volume=
Measuring the diffuse Galactic synchrotron spectral index and curvature between 45 and 2300 MHz , author=. MNRAS , volume=. 2026 , publisher=
2026
-
[41]
Asad, K. M. B. and Koopmans, L. V. E. and Jeli\'c, V. and others , title =. MNRAS , year =
-
[42]
Pober, J. C. and Liu, A. and Dillon, J. S. and others , title =. ApJ , year =
-
[43]
Harris, C. R. and others , title =. Nature , year =
-
[44]
and others , title =
Virtanen, P. and others , title =. Nature Methods , year =
-
[45]
Hunter, J. D. , title =. Computing in Science & Engineering , year =
-
[46]
and others , title =
Chapman, E. and others , title =. MNRAS , year =
-
[47]
Mertens, F. G. and Ghosh, A. and Koopmans, L. V. E. , title =. MNRAS , year =
-
[48]
Switzer, E. R. and Liu, A. , title =. ApJ , year =
-
[49]
Monsalve, R. A. and others , title =. ApJ , year =
-
[50]
Sims, P. H. and Pober, J. C. , title =. MNRAS , year =
-
[51]
and Ochsenbein, F
Wenger, M. and Ochsenbein, F. and Egret, D. and Dubois, P. and Bonnarel, F. and Borde, S. and Genova, F. and Jasniewicz, G. and Lalo. A&AS , year =
-
[52]
An updated catalogue of 310 Galactic supernova remnants and their statistical properties , author=. J. Astrophys. Astr. , volume=. 2025 , publisher=
2025
-
[53]
and Madore, B
Helou, G. and Madore, B. F. and Schmitz, M. and Bicay, M. D. and Wu, X. and Bennett, J. , title =. Databases and On-line Data in Astronomy , year =
-
[54]
Databases & On-Line Data in Astronomy , pages=
The NASA/IPAC extragalactic database , author=. Databases & On-Line Data in Astronomy , pages=. 1991 , publisher=
1991
-
[55]
John D. Garrett , title =. doi:10.5281/zenodo.4106649 , url =
-
[56]
Condon, J. J. and Ransom, S. M. , title =. 2016 , address =
2016
-
[57]
and Han, J
Xu, Y. and Han, J. L. and Han, J. , title =. , year =
-
[58]
ApJ , volume=
Fitting and comparing galactic foreground models for unbiased 21 cm cosmology , author=. ApJ , volume=. 2023 , publisher=
2023
-
[59]
Landecker, T. L. and Wielebinski, R. , title =. Aust. J. Phys. Astrophys. Suppl. , year =
-
[60]
and Dickinson, C
Remazeilles, M. and Dickinson, C. and Banday, A. J. and Bigot-Sazy, M.-A. and Ghosh, T. , title =. MNRAS , year =
-
[61]
A&A , volume=
All-sky Galactic radiation at 45 MHz and spectral index between 45 and 408 MHz , author=. A&A , volume=. 2011 , publisher=
2011
-
[62]
MNRAS , volume=
Informing antenna design for sky-averaged 21-cm experiments using a simulated Bayesian data analysis pipeline , author=. MNRAS , volume=. 2022 , publisher=
2022
-
[63]
MNRAS , volume=
Bayesian evidence for flux scale errors in Galactic synchrotron maps , author=. MNRAS , volume=. 2025 , publisher=
2025
-
[64]
Nature Astronomy , pages=
Precise measurement of the absolute sky brightness at 60--350 MHz , author=. Nature Astronomy , pages=. 2026 , publisher=
2026
-
[65]
Understanding the Epoch of Cosmic Reionization: Challenges and Progress , volume=
The 21-cm Line as a Probe of Reionization , author=. Understanding the Epoch of Cosmic Reionization: Challenges and Progress , volume=. 2016 , publisher=
2016
-
[66]
Davies, R. D. and Wilkinson, A. , title =. preprint (arXiv:astro-ph/9804208) , year =
work page internal anchor Pith review Pith/arXiv arXiv
-
[67]
Morales, M. F. and Wyithe, J. S. B. , title =. ARA&A , year =
-
[68]
Singh, Saurabh and Nambissan T., Jishnu and Subrahmanyan, Ravi and Shankar, N. Udaya and Girish, B. S. and Raghunathan, A. and Somashekar, R. and Srivani, K. S. and Rao, Mayuri Sathyanarayana , title =. Nature Astronomy , year =. doi:10.1038/s41550-022-01619-8 , eprint =
-
[69]
Anstey, Dominic and de Lera Acedo, Eloy and Handley, Will , title =. MNRAS , year =. doi:10.1093/mnras/stad156 , eprint =
-
[70]
doi:10.1051/0004-6361/201526803 , eprint =
A&A , year =. doi:10.1051/0004-6361/201526803 , eprint =
-
[71]
Can the reionization epoch be detected as a global signature in the cosmic background?
Can the reionization epoch be detected as a global signature in the cosmic background?. , keywords =. doi:10.48550/arXiv.astro-ph/9901320 , archivePrefix =. astro-ph/9901320 , primaryClass =
work page internal anchor Pith review Pith/arXiv arXiv doi:10.48550/arxiv.astro-ph/9901320
-
[72]
A&A , volume=
Spectral index of synchrotron emission: insights from the diffuse and magnetised interstellar medium , author=. A&A , volume=. 2021 , publisher=
2021
-
[73]
2019 , publisher=
The Cosmic 21-cm Revolution , author=. 2019 , publisher=
2019
-
[74]
MNRAS , volume=
Distinctive 21-cm structures of the first stars, galaxies and quasars , author=. MNRAS , volume=. 2014 , publisher=
2014
-
[75]
, title =
Mirocha, Jordan and Furlanetto, Steven R. , title =. MNRAS , year =
-
[76]
MNRAS , year =
Gessey-Jones, Thomas and others , title =. MNRAS , year =
-
[77]
and Sun, Guochao , title =
Mirocha, Jordan and Furlanetto, Steven R. and Sun, Guochao , title =. MNRAS , year =
-
[78]
and Mirocha, Jordan and Furlanetto, Steven R
Mebane, Richard H. and Mirocha, Jordan and Furlanetto, Steven R. , title =. MNRAS , year =
-
[79]
Nature , year =
Barkana, Rennan , title =. Nature , year =
-
[80]
Nature , year =
Fialkov, Anastasia and Barkana, Rennan and Visbal, Eli , title =. Nature , year =
discussion (0)
Sign in with ORCID, Apple, or X to comment. Anyone can read and Pith papers without signing in.