REVIEW 5 major objections 7 minor 1 cited by
Learning Explainable Stock Predictions with Tweets Using Mixture of Experts
T0 review · 5 major / 7 minor · reviewed 2026-08-15 · deepseek-v4-flash
Pith's one-line read FTS-Text-MoE claims that a sparse mixture-of-experts transformer aligned with tweet and news summaries beats Chronos and Moirai on stock returns and Sharpe ratio.
desk verdict The architecture is clearly described and the dataset update is real, but the paper's central claim of superior returns and Sharpe rests on an evaluation protocol that never appears—no train/test split, no baseline setup, no dates—so the results are unverifiable as out-of-sample. read the letter →
The pith
A machine-rendered reading of the paper's core claim, the machinery that carries it, and where it could break.
The reading
What carries the argument
The load-bearing mechanism is the FTS-Text-MoE decoder: a decoder-only Transformer whose feedforward layers are replaced by a Mixture of Experts with eight experts per layer, top-2 routing, and one shared expert, so only about 50M of 113M parameters are active. Text is reduced to 1-2 factual summaries per day, ranked by relevance to the company, embedded with an SBERT sentence encoder, then mean-pooled with SwiGLU-embedded price points so each time step carries both modalities. A multi-resolution prediction head with horizons {1, 8, 32, 64} plus greedy concatenation lets the same model forecast arbitrary-length sequences.
What would settle it
Rerun the exact experiment with a hard temporal cutoff: train only on data before a fixed date, tune nothing on data after it, and evaluate on the later period; if the Sharpe ratio and MSE advantages over Chronos and Moirai vanish or invert, the reported edge is not predictive. A cheaper check is to inspect whether any predicted day's input text was published after that day's close.
Extended reading notes
Core claim
The central claim is that coupling text to numbers through point-aligned summaries and a sparse MoE decoder is enough to materially improve next-value stock prediction and downstream portfolio metrics. Concretely, the paper shows that adding summarized X (Twitter) comments reduces MSE and MAE across most of eleven industry sectors relative to price-only and news-only inputs, that the model outperforms Chronos and Moirai on cumulative returns (0.1347 versus 0.0079 and -0.0077 in its portfolio setup), and that its Sharpe ratio reaches 1.0818 against 0.3320 for Moirai and 0.1223 for Chronos. The authors interpret the gains as the model capturing short-term volatility with a more proactive strategy rather than the conservative smoothing of the baselines.
Load-bearing premise
The result stands or falls on the assumption that the reported MSE, returns, and Sharpe ratio are computed on a genuine out-of-sample test set with no lookahead; the paper trains for 10,000 steps but never states how the data is split into training, validation, and test periods, nor whether the Chronos and Moirai baselines are used zero-shot.
Editorial extensions
If this is right
- If text-aligned sparse MoE genuinely forecasts next values, portfolio strategies can move from prompt-based LLM calls to a single lightweight model that produces multi-horizon predictions in near real time.
- The multi-resolution head means one model can serve both short-horizon traders (1-8 days) and longer-horizon allocators (32-64 days), removing the need for separate models per horizon.
- Because the model predicts numeric values rather than direction, it plugs directly into mean-variance and risk-parity portfolio optimizers that need return forecasts.
- The reported cost reduction (50M active parameters out of 113M) suggests text-augmented forecasting can run on conventional hardware, not just large inference clusters.
Reading between the lines
- A strict temporal backtest with transaction costs could change the Sharpe gap; the paper's portfolio is rebalanced with no trading-cost adjustment, and the aggressive concentration it documents would erode under realistic slippage.
- The same model should be testable on other text-heavy assets (cryptocurrencies, commodities) and on intraday data, where the lag between news publication and price impact is shorter.
- The ranking pipeline that selects one summary per day could be the true source of signal; an ablation that replaces summaries with random tweets or with sentiment scores alone would isolate whether factual content or mere volume carries the gain.
Signed reviews
Editorial analysis
A structured set of objections, weighed in public.
Referee Report
Summary. The paper proposes FTS-Text-MoE, a decoder-only Mixture-of-Experts Transformer for stock price forecasting that combines numerical time series with daily news and tweet summaries via point-wise token embeddings, and uses multi-resolution prediction heads to forecast at several horizons. The authors report improved MSE/MAE over Chronos and Moirai in some sectors, and report a portfolio with higher cumulative return and Sharpe ratio than the baselines. They also describe an extension of the FNSPID news dataset to January 2025. The paper's central claims are that FTS-Text-MoE 'outperforms baseline methods in terms of investment returns and Sharpe ratio' and demonstrates 'superior accuracy'.
Significance. If the empirical claims were established, the paper would contribute a useful sparse architecture for multimodal financial forecasting, a cleaned text-summarization pipeline, and an updated news dataset. The architectural description is detailed, and the proposed alignment of text summaries with price series is plausible. However, the evidence presented does not currently support the headline claims: Table 1 is internally inconsistent with the 'superior accuracy' statement, and the portfolio results in Table 2 are not accompanied by a defined out-of-sample evaluation protocol. The paper's practical significance is therefore contingent on a substantial revision of the evaluation methodology.
major comments (5)
- [Abstract and §4.2.1, Table 1] The claim that FTS-Text-MoE shows 'superior accuracy' is contradicted by Table 1. In Consumer Defensive the best FTS-Text-MoE MSE is 0.5700 versus 0.1946 for Chronos and 0.1533 for Moirai; in Utilities it is 0.2797 versus 0.2517 for Moirai; in Energy it is 0.4196 versus 0.2094 for Chronos and 0.3204 for Moirai; in Technology it is 0.8688 versus 0.8681 for Chronos and 0.5858 for Moirai; in Real Estate it is 0.3892 versus 0.2282 for Chronos; and in Industrials it is 0.5829 versus 0.4708 for Chronos and 0.2126 for Moirai. The paper should either provide an aggregate, statistically valid comparison that supports the abstract's claim or substantially weaken the claim.
- [§4.5, Table 2, and Appendix A.3] The central result—overall return 0.1347 and Sharpe ratio 1.0818—is not verifiable as an out-of-sample result. Appendix A.3 states only training steps, batch size, and optimizer settings; it never specifies a train/validation/test split, the evaluation period, the rebalancing frequency, the risk-free rate used in Eq. (17), or whether Chronos and Moirai are used zero-shot, fine-tuned, or retrained. Without a defined temporal split and a statement that test-period text and price data were excluded from training, the reported numbers could be in-sample reconstructions. Section 6 discusses lag and misinformation but does not address lookahead leakage, which is a load-bearing omission.
- [§4.1 and §4.2.2] The baseline comparison is not controlled. The paper never states whether Chronos and Moirai are evaluated in their pretrained form or fine-tuned on the same data, nor whether they receive the same context length and forecast horizon. The text in §4.2.2 concedes that FTS-Text-MoE 'falls short of surpassing Chronos and Moirai in some industries and scenarios,' which conflicts with the unqualified superiority claims in the abstract and conclusion. Without a calibrated protocol, the relative performance cannot be interpreted.
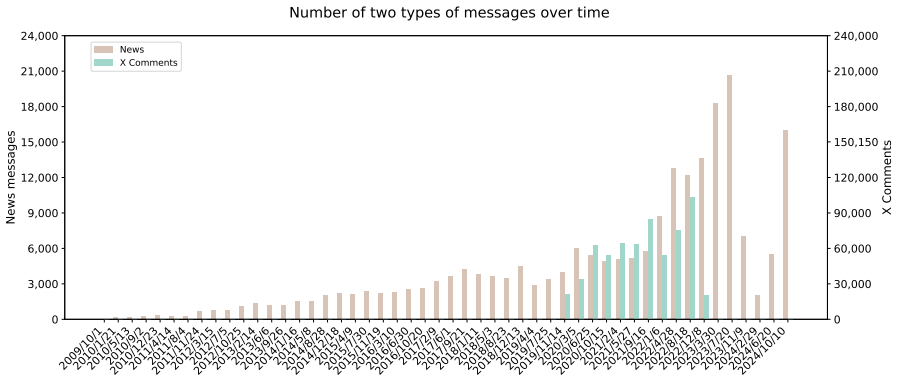
- [Appendix B.2–B.3 and §3.1] The data alignment appears inconsistent. Tweet data cover only 2020–2022, while news data begin as early as 2009 and, for some stocks, only begin in 2024 or 2023 (e.g., AAPL news from 2022, META news from 2024). The paper does not explain how missing text is handled at time steps without news or tweets, nor why 'Ours ts' and 'Ours ts&news' produce identical MSE/MAE in Consumer Defensive, Utilities, and Energy rows of Table 1. These identical values suggest the text embedding may be zero or absent for those periods, which undermines the claim that text inputs improve accuracy.
- [§3.2 and §5] The claimed computational-efficiency advantage is not measured. The paper states that only 50M of 113M parameters are active, but no runtime, FLOPs, throughput, or energy comparison is reported against dense baselines or against Chronos/Moirai. Since reducing computational cost is one of the stated motivations, the absence of any efficiency experiment leaves this claim unsupported.
minor comments (7)
- [Abstract] There is a typo in the first sentence: 'tex-tual' should be 'textual'.
- [§3.2, Eq. (2)] The notation MA for masked attention is used in Eq. (2) but not defined in the text; please define it explicitly.
- [§3.1 and Algorithm 1] The ranking function score(x,c) is never defined, despite being load-bearing for the selection of the 'top' news and tweets; a precise definition or reference is needed.
- [Appendix B.7, Eq. (17)] The Sharpe ratio formula uses R_f but no value of the risk-free rate is reported anywhere in the paper; specifying R_f and the evaluation dates is necessary for reproducibility.
- [Tables 4 and 5] The columns labeled 'Daily Tweet Count' and 'Daily News Count' appear to contain total message counts over the whole period, not daily counts; the labels should be corrected.
- [§4.2.2] There is an orphan superscript '3' after 'significant fluctuations' with no corresponding footnote; please remove it or add the note.
- [Title and §4.4] The word 'Explainable' in the title is never substantiated: Figure 4 shows top gainers/losers but no explanation mechanism, attribution, or interpretability analysis is presented.
Circularity Check
No circularity identified: the paper's empirical claims rest on an external comparison and its own equations do not reduce any prediction to a fitted input.
full rationale
The paper's load-bearing claim is an empirical result: FTS-Text-MoE is trained on historical prices and aligned text summaries, then compared against external baselines (Chronos and Moirai) using MSE/MAE (Eq. 13) and portfolio metrics (Eqs. 14-17). The model equations (Eqs. 1-7) define a map from past observations X_{1:M} and text T_{1:M} to a forecast of future values, and the loss in Eq. 12 compares those forecasts with actual future values; there is no equation in which the validation target is defined as the fitted model output or in which a fitted parameter is renamed as a prediction. The reported Sharpe ratio and returns are claimed outcomes of applying the trained model, and the paper does not state that the evaluation window coincides with the training window, so the concern about an unstated train/test split is a validity or reproducibility issue rather than a demonstrated circularity. The paper's self-citations are not load-bearing: the transformer and MoE machinery are attributed to external prior work (Vaswani et al.; Shi et al.; Fedus et al.; Nie et al.), and the single co-authored reference (Chen et al. 2024) is cited only as a general deep-learning reference, not to justify the article's central claim. No uniqueness theorem, ansatz, or fitted quantity is imported from prior work by the same authors. Inconsistencies in Table 1, such as identical MSE values for 'Ours ts' and 'Ours ts&news' in some sectors, may weaken the empirical narrative but do not constitute a self-definitional or fitted-input-called-prediction circularity. Therefore, under the rule that circularity requires quoting a specific reduction to inputs, no circular step is present in the paper's own derivation chain.
Assumptions & free parameters
free parameters (5)
- FTS-Text-MoE network weights =
113M total, 50M active
- News and tweet ranking score function score(x,c) =
not specified
- Daily selected text counts (top k news and X comments) =
not reported
- MoE architecture hyperparameters =
8 experts, top-K=2, d_model=384, d_ff=1536, d_expert=192, 12 layers, 12 heads
- Training and loss hyperparameters =
alpha=0.02, lr=5e-5, weight decay 0.1, batch 64, 10,000 steps, warmup 10,000, Huber delta unspecified
assumptions (6)
- domain assumption Same-day alignment of text and price is sufficient; news and tweet effects on stock prices are assumed to act without delay.
- domain assumption Historical prices and text contain exploitable predictive signal for future prices.
- domain assumption Summarized text created by pretrained DistilBART and MiniLM/SBERT preserves the financially relevant content.
- domain assumption The evaluation is free of temporal leakage, meaning there is a proper train/test split and no lookahead.
- domain assumption Chronos and Moirai are evaluated under a protocol comparable to FTS-Text-MoE.
- standard math Transformer attention, RMSNorm, RoPE, and MoE routing behave as specified in the cited literature.
invented entities (1)
-
FTS-Text-MoE architecture with point-wise text/time alignment
Cite this review
Pith. "Pith review of Learning Explainable Stock Predictions with Tweets Using Mixture of Experts." pith.science (2026). https://pith.science/paper/LXNV5XYN
@misc{pith2026250720535,
  author       = {Pith},
  title        = {Pith review of: Learning Explainable Stock Predictions with Tweets Using Mixture of Experts},
  year         = {2026},
  howpublished = {\url{https://pith.science/paper/LXNV5XYN}},
  note         = {Machine review of arXiv:2507.20535}
}
read the original abstract
Stock price movements are influenced by many factors, and alongside historical price data, tex-tual information is a key source. Public news and social media offer valuable insights into market sentiment and emerging events. These sources are fast-paced, diverse, and significantly impact future stock trends. Recently, LLMs have enhanced financial analysis, but prompt-based methods still have limitations, such as input length restrictions and difficulties in predicting sequences of varying lengths. Additionally, most models rely on dense computational layers, which are resource-intensive. To address these challenges, we propose the FTS- Text-MoE model, which combines numerical data with key summaries from news and tweets using point embeddings, boosting prediction accuracy through the integration of factual textual data. The model uses a Mixture of Experts (MoE) Transformer decoder to process both data types. By activating only a subset of model parameters, it reduces computational costs. Furthermore, the model features multi-resolution prediction heads, enabling flexible forecasting of financial time series at different scales. Experimental results show that FTS-Text-MoE outperforms baseline methods in terms of investment returns and Sharpe ratio, demonstrating its superior accuracy and ability to predict future market trends.
Figures


Figures from the paper (4 more)


Forward citations
Cited by 1 Pith paper
-
FinMultiTime: A Four-Modal Bilingual Dataset for Financial Time-Series Analysis
FinMultiTime is a four-modal bilingual financial dataset, but the paper's experimental evidence for its benefits is internally inconsistent.
Reference graph
Works this paper leans on
-
[1]
Chronos: Learning the language of time series
Abdul Fatir Ansari, Lorenzo Stella, Ali Caner Turkmen, Xiyuan Zhang, Pedro Mercado, Huibin Shen, Oleksandr Shchur, Syama Sundar Rangapuram, Sebastian Pineda Arango, Shubham Kapoor, and 1 others. Chronos: Learning the language of time series. Transactions on Machine Learning Research
-
[2]
Adebiyi A Ariyo, Adewumi O Adewumi, and Charles K Ayo. 2014. Stock price prediction using the arima model. In 2014 UKSim-AMSS 16th international conference on computer modelling and simulation, pages 106--112. IEEE
work page 2014
-
[3]
Jiayu Chen, Bhargav Ganguly, Yang Xu, Yongsheng Mei, Tian Lan, and Vaneet Aggarwal. 2024. Deep generative models for offline policy learning: Tutorial, survey, and perspectives on future directions. Transactions on Machine Learning Research
work page 2024
-
[4]
Sociodojo: Building lifelong analytical agents with real-world text and time series
Junyan Cheng and Peter Chin. Sociodojo: Building lifelong analytical agents with real-world text and time series. In The Twelfth International Conference on Learning Representations
-
[5]
Aakanksha Chowdhery, Sharan Narang, Jacob Devlin, Maarten Bosma, Gaurav Mishra, Adam Roberts, Paul Barham, Hyung Won Chung, Charles Sutton, Sebastian Gehrmann, and 1 others. 2023. Palm: Scaling language modeling with pathways. Journal of Machine Learning Research, 24(240):1--113
2023
-
[6]
Damai Dai, Chengqi Deng, Chenggang Zhao, RX Xu, Huazuo Gao, Deli Chen, Jiashi Li, Wangding Zeng, Xingkai Yu, and 1 others. 2024. Deepseekmoe: Towards ultimate expert specialization in mixture-of-experts language models. arXiv preprint arXiv:2401.06066
arXiv 2024
-
[7]
Shumin Deng, Ningyu Zhang, Wen Zhang, Jiaoyan Chen, Jeff Z Pan, and Huajun Chen. 2019. Knowledge-driven stock trend prediction and explanation via temporal convolutional network. In Companion proceedings of the 2019 world wide web conference, pages 678--685
work page 2019
-
[8]
Xiao Ding, Yue Zhang, Ting Liu, and Junwen Duan. 2015. Deep learning for event-driven stock prediction. In Proceedings of the 24th International Conference on Artificial Intelligence, pages 2327--2333
work page 2015
Show all 39 references
-
[9]
William Fedus, Barret Zoph, and Noam Shazeer. 2022. Switch transformers: Scaling to trillion parameter models with simple and efficient sparsity. Journal of Machine Learning Research, 23(120):1--39
2022
-
[10]
Christian Francq and Jean-Michel Zakoian. 2019. GARCH models: structure, statistical inference and financial applications. John Wiley & Sons
2019
-
[11]
Torsten Hoefler, Dan Alistarh, Tal Ben-Nun, Nikoli Dryden, and Alexandra Peste. 2021. Sparsity in deep learning: Pruning and growth for efficient inference and training in neural networks. Journal of Machine Learning Research, 22(241):1--124
2021
-
[12]
Yen-Ju Hsu, Yang-Cheng Lu, and J Jimmy Yang. 2021. News sentiment and stock market volatility. Review of Quantitative Finance and Accounting, 57(3):1093--1122
2021
-
[13]
Interpretable mixture of experts
Aya Abdelsalam Ismail, Sercan O Arik, Jinsung Yoon, Ankur Taly, Soheil Feizi, and Tomas Pfister. Interpretable mixture of experts. Transactions on Machine Learning Research
-
[14]
Robert A Jacobs, Michael I Jordan, Steven J Nowlan, and Geoffrey E Hinton. 1991. Adaptive mixtures of local experts. Neural computation, 3(1):79--87
1991
-
[15]
Kelvin JL Koa, Yunshan Ma, Ritchie Ng, and Tat-Seng Chua. 2023. Diffusion variational autoencoder for tackling stochasticity in multi-step regression stock price prediction. In Proceedings of the 32nd ACM International Conference on Information and Knowledge Management, pages ...
2023
-
[16]
Kelvin JL Koa, Yunshan Ma, Ritchie Ng, and Tat-Seng Chua. 2024. Learning to generate explainable stock predictions using self-reflective large language models. In Proceedings of the ACM Web Conference 2024, pages 4304--4315
2024
-
[17]
Gueorgui Konstantinov, Andreas Chorus, and Jonas Rebmann. 2020. A network and machine learning approach to factor, asset, and blended allocation. Journal of Portfolio Management, 46(6):54--71
2020
-
[18]
Pulikandala Nithish Kumar, Nneka Umeorah, and Alex Alochukwu. 2024. Dynamic graph neural networks for enhanced volatility prediction in financial markets. arXiv preprint arXiv:2410.16858
2024 arXiv
-
[19]
Gshard: Scaling giant models with conditional computation and automatic sharding
Dmitry Lepikhin, HyoukJoong Lee, Yuanzhong Xu, Dehao Chen, Orhan Firat, Yanping Huang, Maxim Krikun, Noam Shazeer, and Zhifeng Chen. Gshard: Scaling giant models with conditional computation and automatic sharding. In International Conference on Learning Representations
-
[20]
Shengsheng Lin, Weiwei Lin, Wentai Wu, Haojun Chen, and Junjie Yang. 2024. Sparsetsf: Modeling long-term time series forecasting with* 1k* parameters. In International Conference on Machine Learning, pages 30211--30226. PMLR
2024
-
[21]
Chenxi Liu, Qianxiong Xu, Hao Miao, Sun Yang, Lingzheng Zhang, Cheng Long, Ziyue Li, and Rui Zhao. 2025. Timecma: Towards llm-empowered multivariate time series forecasting via cross-modality alignment. In Proceedings of the AAAI Conference on Artificial Intelligence, volume 3...
2025
-
[22]
Andrew W Lo. 2002. The statistics of sharpe ratios. Financial analysts journal, 58(4):36--52
2002
-
[23]
Douglas C Montgomery, Elizabeth A Peck, and G Geoffrey Vining. 2021. Introduction to linear regression analysis. John Wiley & Sons
2021
-
[24]
Ronghao Ni, Zinan Lin, Shuaiqi Wang, and Giulia Fanti. 2024. Mixture-of-linear-experts for long-term time series forecasting. In International Conference on Artificial Intelligence and Statistics, pages 4672--4680. PMLR
2024
-
[25]
A time series is worth 64 words: Long-term forecasting with transformers
Yuqi Nie, Nam H Nguyen, Phanwadee Sinthong, and Jayant Kalagnanam. A time series is worth 64 words: Long-term forecasting with transformers. In The Eleventh International Conference on Learning Representations
-
[26]
Robert P Schumaker and Hsinchun Chen. 2009. Textual analysis of stock market prediction using breaking financial news: The azfin text system. ACM Transactions on Information Systems (TOIS), 27(2):1--19
2009
-
[27]
Noam Shazeer. 2020. Glu variants improve transformer. arXiv e-prints, pages arXiv--2002
2020
-
[28]
Xiaoming Shi, Shiyu Wang, Yuqi Nie, Dianqi Li, Zhou Ye, Qingsong Wen, and Ming Jin. 2024. Time-moe: Billion-scale time series foundation models with mixture of experts. arXiv preprint arXiv:2409.16040
2024 arXiv
-
[29]
Jianlin Su, Murtadha Ahmed, Yu Lu, Shengfeng Pan, Wen Bo, and Yunfeng Liu. 2024. Roformer: Enhanced transformer with rotary position embedding. Neurocomputing, 568:127063
2024
-
[30]
Hugo Touvron, Thibaut Lavril, Gautier Izacard, Xavier Martinet, Marie-Anne Lachaux, Timoth \'e e Lacroix, Baptiste Rozi \`e re, Naman Goyal, Eric Hambro, Faisal Azhar, and 1 others. 2023. Llama: Open and efficient foundation language models. arXiv preprint arXiv:2302.13971
2023 arXiv
-
[31]
Ashish Vaswani, Noam Shazeer, Niki Parmar, Jakob Uszkoreit, Llion Jones, Aidan N Gomez, ukasz Kaiser, and Illia Polosukhin. 2017. Attention is all you need. Advances in neural information processing systems, 30
2017
-
[32]
Chengsen Wang, Qi Qi, Jingyu Wang, Haifeng Sun, Zirui Zhuang, Jinming Wu, Lei Zhang, and Jianxin Liao. 2025. Chattime: A unified multimodal time series foundation model bridging numerical and textual data. In Proceedings of the AAAI Conference on Artificial Intelligence, volum...
2025
-
[33]
Gerald Woo, Chenghao Liu, Akshat Kumar, Caiming Xiong, Silvio Savarese, and Doyen Sahoo. 2024. Unified training of universal time series forecasting transformers. In Proceedings of the 41st International Conference on Machine Learning, pages 53140--53164
2024
-
[34]
Yumo Xu and Shay B Cohen. 2018. Stock movement prediction from tweets and historical prices. In Proceedings of the 56th Annual Meeting of the Association for Computational Linguistics (Volume 1: Long Papers), pages 1970--1979
2018
-
[35]
Linyi Yang, Tin Lok James Ng, Barry Smyth, and Riuhai Dong. 2020. Html: Hierarchical transformer-based multi-task learning for volatility prediction. In Proceedings of The Web Conference 2020, pages 441--451
2020
-
[36]
Ailing Zeng, Muxi Chen, Lei Zhang, and Qiang Xu. 2023. Are transformers effective for time series forecasting? In Proceedings of the AAAI conference on artificial intelligence, volume 37, pages 11121--11128
2023
-
[37]
Biao Zhang and Rico Sennrich. 2019. Root mean square layer normalization. Advances in Neural Information Processing Systems, 32
2019
-
[38]
online" 'onlinestring :=
ENTRY address archivePrefix author booktitle chapter edition editor eid eprint eprinttype howpublished institution journal key month note number organization pages publisher school series title type volume year doi pubmed url lastchecked label extra.label sort.label short.list...
-
[39]
write newline
" write newline "" before.all 'output.state := FUNCTION n.dashify 't := "" t empty not t #1 #1 substring "-" = t #1 #2 substring "--" = not "--" * t #2 global.max substring 't := t #1 #1 substring "-" = "-" * t #2 global.max substring 't := while if t #1 #1 substring * t #2 gl...
Reviewed August 15, 2026 · model on record in the stance chip above.
Discussion (0). Continue with ORCID to comment.