REVIEW 2 major objections 6 minor 1 cited by
Mapping Large-Scale-Structure Evolution over Cosmic Times
T0 review · 2 major / 6 minor · reviewed 2026-08-14 · deepseek-v4-flash
Pith's one-line read A space-borne line-intensity mapping mission covering 100–2000 GHz could map large-scale structure across cosmic time, detecting [CII] through the epoch of reionization and beating Planck on key cosmological parameters.
desk verdict A candid, useful science case for a space-borne far-IR/sub-mm LIM mission; the headline forecasts are genuinely new for this instrument but rest on line-luminosity assumptions that the authors themselves rate as uncertain by an order of magnitude at high z. read the letter →
The pith
A machine-rendered reading of the paper's core claim, the machinery that carries it, and where it could break.
The reading
What carries the argument
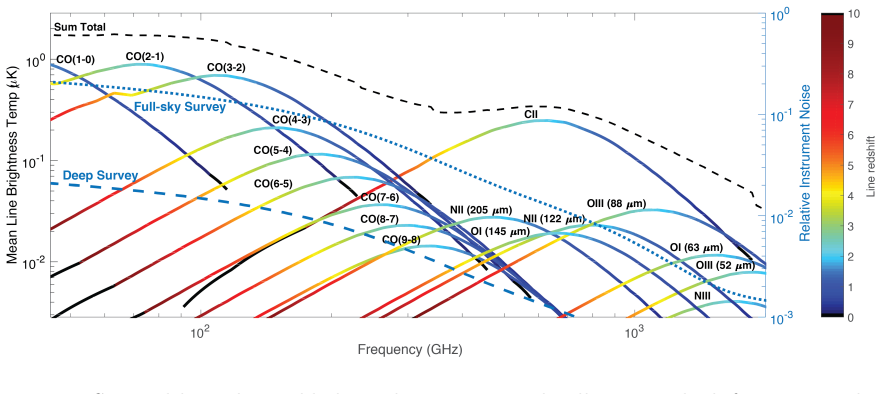
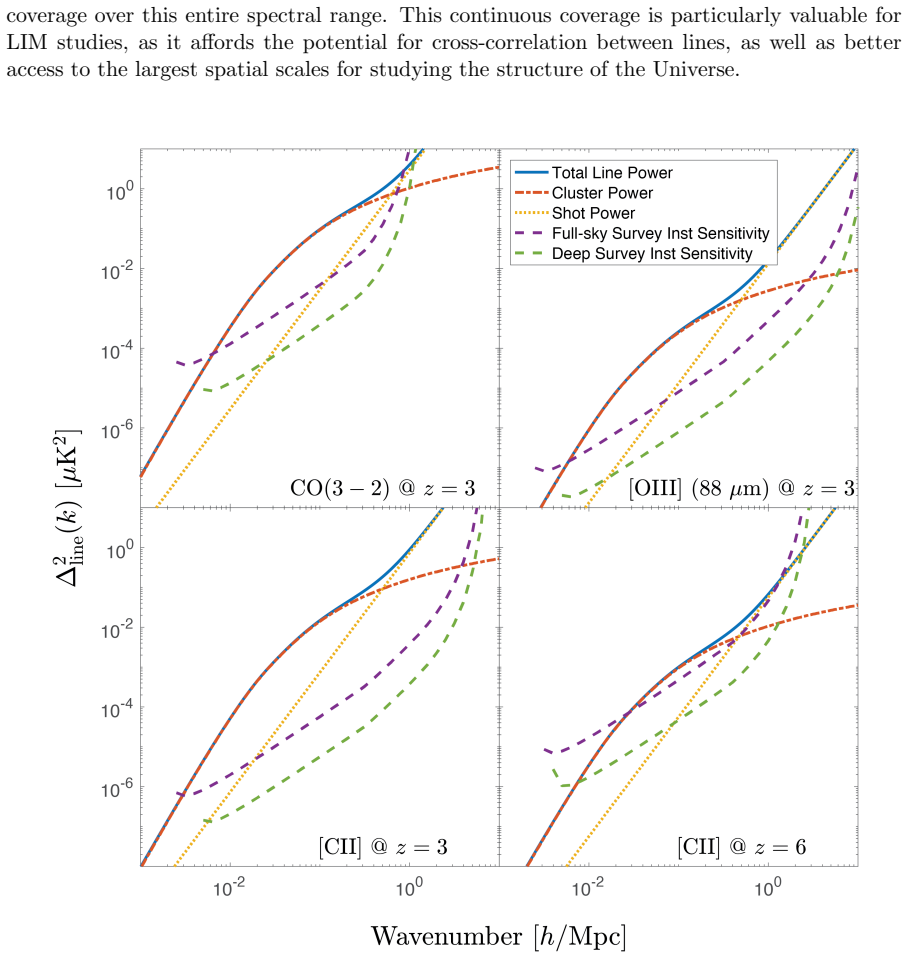
The machinery that carries the argument is line-intensity mapping (LIM), in which all photons at a given frequency are collected and the spatial fluctuations of redshifted spectral-line emission trace the underlying density field. What makes this mission concept work, in the paper's telling, is broad continuous frequency coverage: observing several CO rotational lines plus [CII] from the same low-redshift structures lets the observer separate interloping lines in map space, so that [CII] at z>6 can be recovered cleanly. Forecast power-spectrum sensitivities are computed for a 3.5 m telescope cooled to ~8 K with R=300 spectroscopy, 64 dual-polarization beams, and two surveys (full sky and 400 deg² deep), using line intensities derived from IR-luminosity scaling relations and star-formation histories from the EAGLE simulation.
What would settle it
A targeted program with ALMA or JWST measuring rest-frame [CII] 158 µm and CO(1-0) line-to-infrared luminosity ratios for a modest sample at z=6–8 would settle it: if the observed ratios sit at the low end of the modeled range, the predicted EoR [CII] SNR>10 and σ(f_NL)=0.75 collapse.
Extended reading notes
Core claim
The paper's central claim is that a space mission with a 3.5 m telescope cooled to about 8 K, a medium-resolution (R=300) spectrometer covering 100–2000 GHz, and both a full-sky survey and a 400 deg² deep survey would measure the [CII] 158 µm line through the Epoch of Reionization with signal-to-noise above 10, detect low-J CO lines up to J=4-3 at SNR~50 and high-J lines at SNR~10, and yield 1-σ uncertainties on cosmological parameters—such as σ(f_NL^loc)=0.75, a factor of nine improvement over Planck—when [CII] intensity maps are combined with Planck priors. These numbers come from scaling line luminosities from infrared luminosity using observationally calibrated relations assumed constant with redshift. The authors present the estimates as preliminary, explicitly noting that the line-intensity model is uncertain by a factor of a few at low redshift and up to an order of magnitude at z>6, and that the CMB's excitation of high-J CO lines at high redshift was not included.
Load-bearing premise
The forecasts stand on the assumption that high-redshift galaxy line emission follows the observationally calibrated infrared-luminosity scaling relations measured at low redshift, despite acknowledged uncertainties of up to an order of magnitude at z>6 and a neglected CMB-heating effect.
Editorial extensions
If this is right
- A full-sky plus deep 400 deg² survey would detect the [CII] power spectrum from the Epoch of Reionization at signal-to-noise above 10, yielding a direct probe of the ionizing sources and the ionized fraction.
- CO line maps spanning z≈0–8 would constrain the CO spectral line energy distribution and the molecular gas content, tightening the CO-to-H₂ conversion factor used across galaxy evolution.
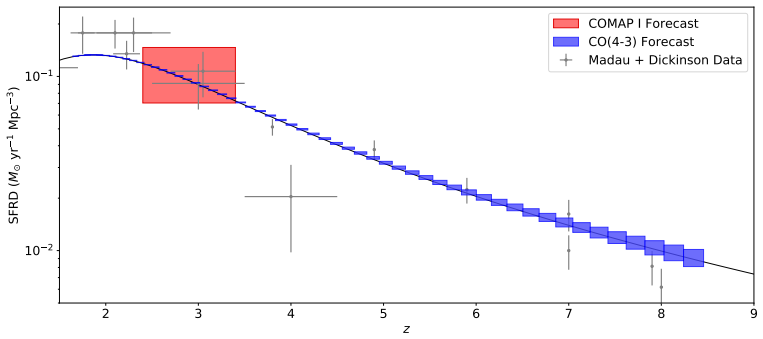
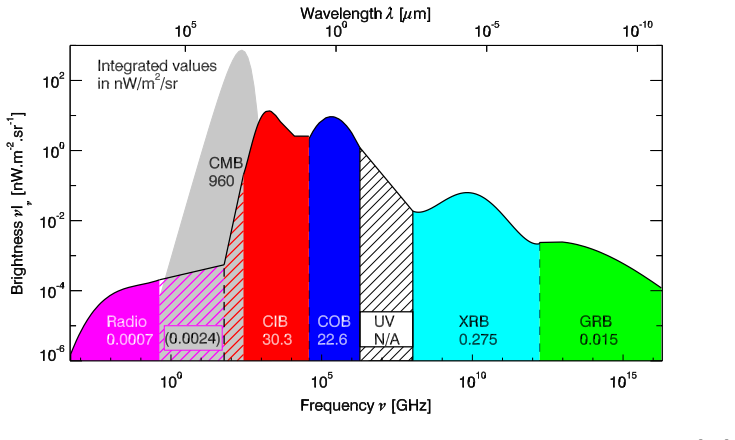
- The same data would improve constraints on the cosmic star-formation-rate density, including the dust-obscured half, and on the buildup of the cosmic infrared background into the Epoch of Reionization.
- With Planck priors, a four-year [CII] survey would measure σ(f_NL^loc)=0.75—a factor-of-nine improvement over Planck—and improve constraints on h, A_s, n_s, and N_eff.
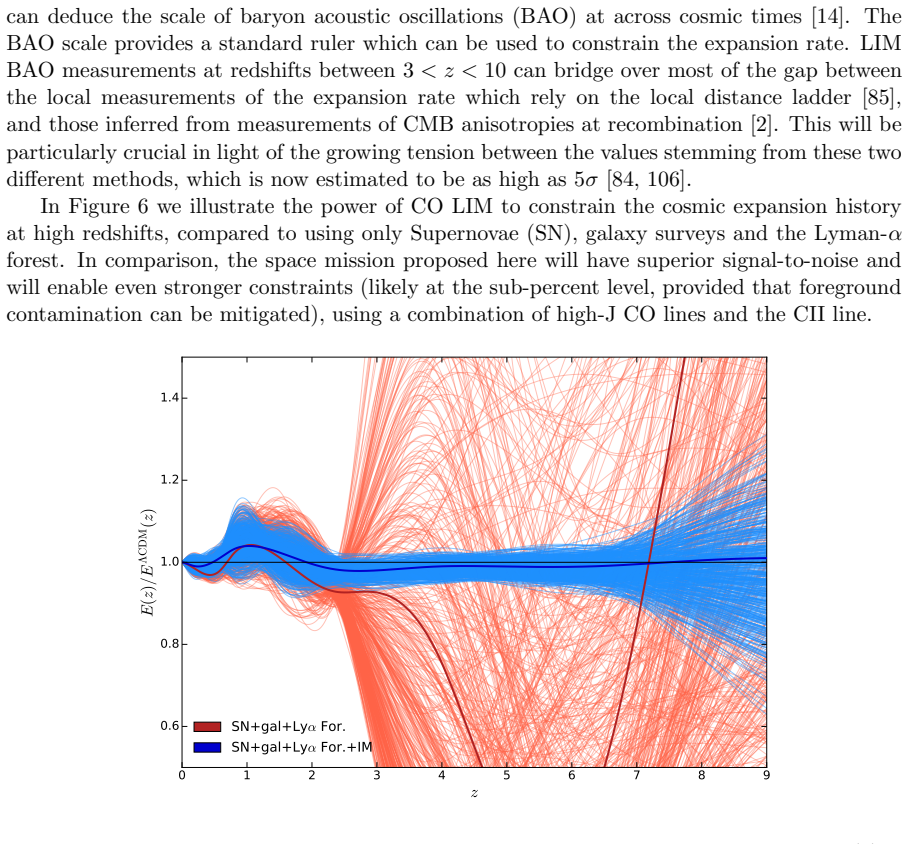
- BAO measurements at 3<z<9 would map the expansion history H(z) across the gap between local distance-ladder estimates and CMB-inferred values, speaking directly to the Hubble tension.
Reading between the lines
- If the map-space line separation works as argued, the mission concept generalizes to other line combinations—for instance [OIII] 88 µm versus high-J CO—making multi-line LIM a multi-tracer cosmological probe without new hardware.
- The mission would measure the very high-redshift line-to-IR ratios that current forecasts must assume, effectively calibrating the astrophysics that all ground-based LIM pathfinders depend on.
- Because the warmer CMB at high redshift can boost high-J CO lines, the high-frequency channels may reveal a CO ladder peaking at higher J than at low redshift; if so, standard low-J CO-to-H₂ conversions would underestimate molecular gas in early galaxies.
Signed reviews
Editorial analysis
A structured set of objections, weighed in public.
Referee Report
Summary. This ESA Voyage-2050 white paper makes the case for a space-borne line-intensity mapping (LIM) mission covering roughly 50--2000 GHz, targeting [CII], CO rotations, and far-infrared fine-structure lines. It argues that such a mission could map large-scale structure from the Epoch of Reionization to the present, constrain the cosmic star formation history and the cosmic infrared background, identify protoclusters, and deliver competitive cosmological constraints. The quantitative centerpiece is a set of preliminary sensitivity and Fisher forecasts: SNR>10 for [CII] during the EoR, SNR around 50 for low-J CO lines, SNR around 10 for high-J CO lines, and a projected 1-sigma uncertainty sigma(f_NL^loc)=0.75, a factor of 9 better than Planck. The paper explicitly labels these as preliminary estimates and emphasizes the need for future refinement of the line-emission models.
Significance. If the forecasts hold, the paper makes a compelling and timely science case for a far-infrared/sub-millimeter LIM space mission, filling a gap between ground-based LIM experiments and UV/optical missions such as SPHEREx and CDIM. The paper benefits from using standard power-spectrum sensitivity estimates and Fisher-matrix methods, and it is appropriately framed as a white paper rather than a final mission design. It also gives useful credit to the many existing LIM efforts. The central weakness is that the headline SNR and cosmological forecasts scale directly with line-luminosity predictions that the paper itself rates as uncertain by up to an order of magnitude at z>6, with the CMB excitation effect on CO transitions not included. Because no robustness test or propagated uncertainty is provided, the quantitative claims are not yet on as firm a footing as the point-value presentation suggests.
major comments (2)
- [Section 1.2 and Figure 2] The line intensities used throughout the forecasts are obtained by scaling line luminosity from infrared luminosity using observationally based relations assumed constant with redshift. The text states that this modeling is uncertain by 'a factor of a few (low-z) to an order of magnitude towards high-z (z > 6)' and that the CMB effect on suppressing low-J CO and enhancing high-J CO at high redshift was not accounted for. Since every power-spectrum sensitivity and Fisher forecast in the paper scales directly with the assumed line amplitude, an order-of-magnitude overestimate of the z~6-8 [CII] and CO luminosities would erase the headline claims in Section 9 and Table 1, including the EoR [CII] SNR>10 and sigma(f_NL^loc)=0.75. The paper should either propagate the line-model uncertainty into the quoted errors or present a robustness test that rescales the line intensities by, for example, factors of 0.3, 1, and 3, and shows which conclusions survive.
- [Section 6.2 and Table 1] The Fisher forecast sigma(f_NL^loc)=0.75 is presented as a point value, but the ingredients of the forecast are not given in this paper: the assumed [CII] luminosity function and bias, the treatment of shot noise and foregrounds, the exact survey parameters, and the prior combination with Planck are all either omitted or cited only indirectly to previous work. Without these details, the reader cannot assess how strongly the constraint depends on the line-intensity model discussed in Section 1.2. The authors should either specify the Fisher-matrix ingredients in an appendix or clearly state which equations from Bernal et al. 2019 and Moradinezhad Dizgah et al. 2019 were used, so that the sensitivity of the forecast to the spectral-line model can be checked.
minor comments (6)
- [Abstract] The sentence 'Only, a space-borne mission can properly meet these requirements.' contains an unnecessary comma after 'Only'.
- [Section 1.1] The word 'intergalatic' should be 'intergalactic' in the first paragraph.
- [Section 3.1] The text says 'planed for launch in 2023'; this should be 'planned for launch in 2023'.
- [Section 5] The phrase 'much modest sensitivity' should be 'much more modest sensitivity' or 'much less demanding sensitivity'.
- [Section 9] The summary sentence 'low-J CO lines with SNR ~50 (up to J=4-3), and of order ~10 for high-J lines)' has mismatched parentheses and the notation 'J=4-3' is confusing; it should refer to CO(1-0) through CO(4-3) or similar.
- [Figure 2 caption] The caption contains the typo 'submillimiter'; it should be 'submillimeter'.
Circularity Check
No circular step: line-intensity forecasts are forward-modeled from external scaling relations, and self-citations supply methods, not target results.
full rationale
Walking the derivation chain from the line-luminosity model (Section 1.2, Fig. 2) to the SNR statements (Summary) and Fisher forecasts (Section 6.2, Table 1), I find no step in which a target result is used as an input or in which a fitted quantity is renamed as a prediction. The line intensities are forward-modeled from IR luminosities via observationally-based scaling relations [19, 88], with the SFR/IR connection taken from the EAGLE simulation and SFRD fit to UV data. The SNR and sigma(f_NL) forecasts are then computed from these fiducial intensities plus a stated instrument model (3.5 m aperture, R=300, 64 beams) and Planck priors. The paper explicitly flags the model's uncertainty ('uncertain by a factor of a few (low-z) to an order of magnitude towards high-z') and the omission of CMB excitation effects; this is a robustness limitation, not circularity. The many self-citations (e.g., [72] for the f_NL Fisher method, [13,14] for BAO forecasts, [21] for SFRD forecasts) provide methods or earlier sensitivity estimates, but the white paper's own specific survey numbers and forecasts do not reduce to those citations as inputs; the cited works are not invoked as the sole justification for the central claims. The central claim is not defined in terms of the method being correct. Hence no circular step under the requiring-evidence standard: score 0.
Assumptions & free parameters
free parameters (5)
- Telescope aperture =
3.5 m
- Mirror temperature and emissivity =
8 K, 1% emissivity
- Spectral resolution =
R = 300
- Number of beams and optical efficiency =
64 dual-polarization beams, 25% (Section 1.2) or 30% (Section 7.2) efficiency
- Survey area and integration time =
Full-sky plus 400 deg^2 deep survey, 10^4 hours each
assumptions (6)
- domain assumption Line luminosities of [CII], CO, [NII], and [OIII] are derived from IR luminosity using observationally-based scaling relations that are assumed constant with redshift.
- domain assumption The SFR density from the EAGLE simulation used to set IR luminosities is a good representation of the real galaxy population.
- domain assumption CMB effects on the CO spectral line energy distribution at high redshift are negligible for the forecasts.
- domain assumption Interloper lines (e.g., CO lines contaminating [CII]) can be separated in map space using spatial correlation with large-scale structure.
- domain assumption Standard cosmological forecasting tools (Fisher matrix, Alcock-Paczynski, scale-dependent bias) from cited literature apply to this instrument.
- domain assumption Planck priors from plike(TT+TE+EE+lowE) are valid inputs for the Fisher forecasts.
Cite this review
Pith. "Pith review of Mapping Large-Scale-Structure Evolution over Cosmic Times." pith.science (2026). https://pith.science/paper/M3EWMHMO
@misc{pith2026190807533,
  author       = {Pith},
  title        = {Pith review of: Mapping Large-Scale-Structure Evolution over Cosmic Times},
  year         = {2026},
  howpublished = {\url{https://pith.science/paper/M3EWMHMO}},
  note         = {Machine review of arXiv:1908.07533}
}
read the original abstract
This paper outlines the science case for line-intensity mapping with a space-borne instrument targeting the sub-millimeter (microwaves) to the far-infrared (FIR) wavelength range. Our goal is to observe and characterize the large-scale structure in the Universe from present times to the high redshift Epoch of Reionization. This is essential to constrain the cosmology of our Universe and form a better understanding of various mechanisms that drive galaxy formation and evolution. We argue that the proposed frequency range would make it possible to probe important metal cooling lines such as [CII] up to very high redshift as well as a large number of rotational lines of the CO molecule. These can be used to trace molecular gas and dust evolution and constrain the buildup in both the cosmic star formation rate density and the cosmic infrared background (CIB). Moreover, surveys at the highest frequencies will detect FIR lines which are used as diagnostics of galaxies and AGN. Tomography of these lines over a wide redshift range will enable invaluable measurements of the cosmic expansion history at epochs inaccessible to other methods, competitive constraints on the parameters of the standard model of cosmology, and numerous tests of dark matter, dark energy, modified gravity and inflation. To reach these goals, large-scale structure must be mapped over a wide range in frequency to trace its time evolution over a reasonable fraction of the volume of the observable Universe. In addition, the surveyed area needs to be very large to beat cosmic variance and to probe the largest scales where its easier to separate the astrophysical and cosmological contributions to the observed signal. Only, a space-borne mission can properly meet these requirements.
Figures

Figures from the paper (4 more)
Forward citations
Cited by 1 Pith paper
-
Reading Between the Lines: Forward Modeling Dust, Continuum, and Spectral Cleaning for Multi-Line Intensity Mapping
Using a SAM-based mock, multi-line intensity-mapping cross-power spectra show dust acts as a line-pair- and redshift-dependent suppression, and PCA cleaning with about 20 modes best balances line recovery against cont...
Reference graph
Works this paper leans on
-
[1]
Aghamousa et al
A. Aghamousa et al. The DESI Experiment Part I: Science,Targeting, and Survey Design. 2016
2016
-
[2]
Aghanim et al
N. Aghanim et al. Planck 2018 results. VI. Cosmological parameters. 2018
2018
-
[3]
Aguirre and STARFIRE Collaboration
J. Aguirre and STARFIRE Collaboration. STARFIRE: The Spectroscopic Terahertz Air- borne Receiver for Far-InfraRed Exploration. In American Astronomical Society Meeting Abstracts #231, volume 231 of American Astronomical Society Meeting Abstracts , page 328.04, Jan. 2018
2018
-
[4]
Akrami et al
Y. Akrami et al. Planck 2018 results. IX. Constraints on primordial non-Gaussianity. 2019
2018
-
[5]
Alcock and B
C. Alcock and B. Paczynski. An evolution free test for non-zero cosmological constant. Nature, 281:358–359, 1979
1979
-
[6]
Amiri et al
M. Amiri et al. Observations of Fast Radio Bursts at Frequencies down to 400 Megahertz. 2019
2019
-
[7]
C. J. Anderson, N. J. Luciw, and Y. C. e. a. Li. Low-amplitude clustering in low-redshift 21-cm intensity maps cross-correlated with 2dF galaxy densities. MNRAS, 476:3382– 3392, May 2018
2018
-
[8]
D. J. Bacon et al. Cosmology with Phase 1 of the Square Kilometre Array: Red Book 2018: Technical specifications and performance forecasts. Submitted to: Publ. Astron. Soc. Austral., 2018
2018
Show all 109 references
-
[9]
Ballardini and R
M. Ballardini and R. Maartens. Measuring ISW with next-generation radio surveys. 2018
2018
-
[10]
Bandura, G
K. Bandura, G. E. Addison, M. Amiri, J. R. Bond, D. Campbell-Wilson, and L. e. a. Connor. Canadian Hydrogen Intensity Mapping Experiment (CHIME) pathfinder. In Ground-based and Airborne Telescopes V, volume 9145 of Proc.SPIE, page 914522, July 2014
2014
-
[11]
Battersby and L
C. Battersby and L. e. a. Armus. The Origins Space Telescope. Nature Astronomy, 2:596–599, Aug 2018
2018
-
[12]
R. A. Battye, I. W. A. Browne, C. Dickinson, G. Heron, B. Maffei, and A. Pourtsidou. H I intensity mapping: a single dish approach. MNRAS, 434:1239–1256, Sept. 2013
2013
-
[13]
J. L. Bernal, P. C. Breysse, H. Gil-Mar´ ın, and E. D. Kovetz. A User’s Guide to Extracting Cosmological Information from Line-Intensity Maps. 2019
2019
-
[14]
J. L. Bernal, P. C. Breysse, and E. D. Kovetz. The Cosmic Expansion History from Line-Intensity Mapping. 2019
2019
-
[15]
J. L. Bernal, L. Verde, and A. G. Riess. The trouble with H0. JCAP, 1610(10):019, 2016
2016
-
[16]
B´ ethermin
M. B´ ethermin. Compter les galaxies infrarouges, raconter leur histoire : propri´ et´ es statistiques des galaxies infrarouges ` a grand redshift et origine du fond extragalactique infrarouge. PhD thesis, IAS (Orsay, France), Sep 2011
2011
-
[17]
B´ ethermin, E
M. B´ ethermin, E. Le Floc’h, O. Ilbert, A. Conley, and e. a. Lagache. HerMES: deep number counts at 250 µm, 350 µm and 500 µm in the COSMOS and GOODS-N fields and the build-up of the cosmic infrared background. A&A, 542:A58, Jun 2012. 19
2012
-
[18]
B´ ethermin, L
M. B´ ethermin, L. Wang, O. Dor´ e, G. Lagache, M. Sargent, E. Daddi, M. Cousin, and H. Aussel. The redshift evolution of the distribution of star formation among dark matter halos as seen in the infrared. A&A, 557:A66, Sep 2013
2013
-
[19]
Bonato, G
M. Bonato, G. De Zotti, D. Leisawitz, M. Negrello, M. Massardi, I. Baronchelli, Z.-Y. Cai, C. M. Bradford, A. Pope, E. J. Murphy, L. Armus, and A. Cooray. Origins Space Telescope: Predictions for far-IR spectroscopic surveys. PASA, 36:e017, Jan 2019
2019
-
[20]
G. C. Bower, G. K. Keating, D. P. Marrone, and S. T. YT Lee Array Team. Cosmic Structure and Galaxy Evolution through Intensity Mapping of Molecular Gas. 227:426.04, Jan. 2016
2016
-
[21]
P. C. Breysse, E. D. Kovetz, P. S. Behroozi, L. Dai, and M. Kamionkowski. Insights from probability distribution functions of intensity maps. Mon. Not. Roy. Astron. Soc. , 467(3):2996–3010, 2017
2017
-
[22]
P. C. Breysse, E. D. Kovetz, and M. Kamionkowski. The high-redshift star formation history from carbon-monoxide intensity maps. MNRAS, 457:L127–L131, Mar. 2016
2016
-
[23]
P. C. Breysse and M. Rahman. Feeding cosmic star formation: exploring high-redshift molecular gas with CO intensity mapping. MNRAS, 468:741–750, June 2017
2017
-
[24]
C. M. Casey, J. A. Zavala, J. Spilker, E. da Cunha, J. Hodge, C.-L. Hung, J. Staguhn, S. L. Finkelstein, and P. Drew. The Brightest Galaxies in the Dark Ages: Galaxies’ Dust Continuum Emission during the Reionization Era. ApJ, 862(1):77, Jul 2018
2018
-
[25]
E. A. Chaikin, N. V. Tyulneva, and A. e. A. Kaurov. Observing Galaxy Mergers at the Epoch of Reionization. ApJ, 853(1):81, Jan 2018
2018
-
[26]
A. Cooray. Extragalactic background light measurements and applications. Royal Society Open Science, 3:150555, Mar 2016
2016
-
[27]
Cooray, T.-C
A. Cooray, T.-C. Chang, S. Unwin, M. Zemcov, A. Coffey, P. Morrissey, N. Raouf, S. Lipscy, M. Shannon, G. Wu, R. Cen, R. R. Chary, O. Dor´ e, X. Fan, G. G. Fazio, S. L. Finkelstein, C. Heneka, B. Lee, P. Linden, H. Nayyeri, J. Rhodes, R. Sadoun, M. B. Silva, H. Trac, H.-Y. Wu, ...
1903 arXiv
-
[28]
Cooray et al
A. Cooray et al. Cosmic Dawn Intensity Mapper. 2016
2016
-
[29]
Creque-Sarbinowski and M
C. Creque-Sarbinowski and M. Kamionkowski. Searching for Decaying and Annihilating Dark Matter with Line Intensity Mapping. Phys. Rev., D98(6):063524, 2018
2018
-
[30]
A. T. Crites et al. The time-pilot intensity mapping experiment. Proc.SPIE, 9153:9153 – 9153 – 9, 2014
2014
-
[31]
R. A. C. Croft et al. Large-scale clustering of Ly α emission intensity from SDSS/BOSS. Mon. Not. Roy. Astron. Soc. , 457(4):3541–3572, 2016
2016
-
[32]
R. A. C. Croft, J. Miralda-Escud´ e, Z. Zheng, M. Blomqvist, and M. Pieri. Intensity mapping with SDSS/BOSS Lyman-α emission, quasars, and their Lyman-α forest. Mon. Not. Roy. Astron. Soc. , 481(1):1320–1336, 2018
2018
-
[33]
Cunnington, I
S. Cunnington, I. Harrison, A. Pourtsidou, and D. Bacon. H I intensity mapping for clustering-based redshift estimation. MNRAS, 482:3341–3355, Jan 2019
2019
-
[34]
da Cunha, B
E. da Cunha, B. Groves, and F. e. a. Walter. On the Effect of the Cosmic Microwave Background in High-redshift (Sub-)millimeter Observations. ApJ, 766(1):13, Mar 2013. 20
2013
-
[35]
Dalgarno and R
A. Dalgarno and R. A. McCray. Heating and Ionization of HI Regions. Annual Review of Astronomy and Astrophysics , 10:375, Jan. 1972
1972
-
[36]
D. R. DeBoer et al. Hydrogen Epoch of Reionization Array (HERA). Publ. Astron. Soc. Pac., 129:045001, 2017
2017
-
[37]
B. R. Dinda, A. A. Sen, and T. R. Choudhury. Dark energy constraints from the 21cm intensity mapping surveys with SKA1. arXiv:1804.11137, Apr 2018
2018 arXiv
-
[38]
Dor´ e, J
O. Dor´ e, J. Bock, M. Ashby, and C. et al. Cosmology with the SPHEREX All-Sky Spectral Survey. arXiv e-prints, page arXiv:1412.4872, Dec 2014
2014 arXiv
-
[39]
Dor´ e et al
O. Dor´ e et al. Science Impacts of the SPHEREx All-Sky Optical to Near-Infrared Spectral Survey II: Report of a Community Workshop on the Scientific Synergies Between the SPHEREx Survey and Other Astronomy Observatories. 2018
2018
-
[40]
A. Endo, K. Karatsu, Y. Tamura, and et al. First light demonstration of the integrated superconducting spectrometer. arXiv e-prints, page arXiv:1906.10216, Jun 2019
1906 arXiv
-
[41]
Fonseca, R
J. Fonseca, R. Maartens, and M. G. Santos. Synergies between intensity maps of hydrogen lines. MNRAS, 479:3490–3497, Sep 2018
2018
-
[42]
Gil-Mar´ ın, J
H. Gil-Mar´ ın, J. Nore˜ na, L. Verde, W. J. Percival, C. Wagner, M. Manera, and D. P. Schneider. The power spectrum and bispectrum of SDSS DR11 BOSS galaxies – I. Bias and gravity. Mon. Not. Roy. Astron. Soc. , 451(1):539–580, 2015
2015
-
[43]
Y. Gong, A. Cooray, and e. a. Silva, Marta. Intensity Mapping of the [CII] Fine Structure Line during the Epoch of Reionization. Astrophys. J., 745:49, 2012
2012
-
[44]
Y. Gong, A. Cooray, and e. a. Silva, Marta B. Intensity Mapping of H α, Hβ, [OII], and [OIII] Lines at z ¡ 5. ApJ, 835(2):273, Feb 2017
2017
-
[45]
A. Hall, C. Bonvin, and A. Challinor. Testing general relativity with 21-cm intensity mapping. Phys. Rev. D , 87:064026, Mar 2013
2013
-
[46]
Heneka, A
C. Heneka, A. Cooray, and C. Feng. Probing the Intergalactic Medium with Ly α and 21 cm Fluctuations. ApJ, 848(1):52, Oct 2017
2017
-
[47]
Herrera-Camus, A
R. Herrera-Camus, A. D. Bolatto, and e. a. Wolfire. [C II] 158 µm Emission as a Star Formation Tracer. ApJ, 800:1, Feb. 2015
2015
-
[48]
G. J. Hill et al. The Hobby-Eberly Telescope Dark Energy Experiment (HETDEX): Description and Early Pilot Survey Results. ASP Conf. Ser. , 399:115–118, 2008
2008
-
[49]
H. T. Ihle et al. Joint power spectrum and voxel intensity distribution forecast on the CO luminosity function with COMAP. Astrophys. J., 871(1):75, 2019
2019
-
[50]
Jain et al
B. Jain et al. Novel Probes of Gravity and Dark Energy. 2013
2013
-
[51]
G. K. Keating, G. C. Bower, and D. P. e. a. Marrone. First Results from COPSS: The CO Power Spectrum Survey. ApJ, 814:140, Dec. 2015
2015
-
[52]
G. K. Keating and e. a. Marrone. COPSS II: The Molecular Gas Content of Ten Million Cubic Megaparsecs at Redshift z 3. ApJ, 830:34, Oct. 2016
2016
-
[53]
Koopmans, J
L. Koopmans, J. Pritchard, and G. e. a. Mellema. The Cosmic Dawn and Epoch of Reionisation with SKA. In Advancing Astrophysics with the Square Kilometre Array (AASKA14), page 1, Apr 2015. 21
2015
-
[54]
L. V. E. Koopmans et al. The Cosmic Dawn and Epoch of Reionization with the Square Kilometre Array. PoS, AASKA14:001, 2015
2015
-
[55]
E. D. Kovetz et al. Line-Intensity Mapping: 2017 Status Report. prepared for Physics Reports, 2017
2017
-
[56]
E. D. Kovetz et al. Astrophysics and Cosmology with Line-Intensity Mapping. 2019
2019
-
[57]
Lagache, M
G. Lagache, M. Cousin, and M. Chatzikos. The [CII] 158µm line emission in high-redshift galaxies. A&A, 609:A130, Feb 2018
2018
-
[58]
K.-G. Lee, A. Krolewski, and M. e. a. White. First Data Release of the COSMOS Ly α Mapping and Tomography Observations: 3D Lyα Forest Tomography at 2.05 < z < 2.55. ApJS, 237(2):31, Aug 2018
2018
-
[59]
T. Y. Li, R. H. Wechsler, K. Devaraj, and S. E. Church. Connecting CO Intensity Map- ping to Molecular Gas and Star Formation in the Epoch of Galaxy Assembly. Astrophys. J., 817(2):169, 2016
2016
-
[60]
A. Lidz, S. R. Furlanetto, S. P. Oh, J. Aguirre, T.-C. Chang, O. Dor´ e, and J. R. Pritchard. Intensity Mapping with Carbon Monoxide Emission Lines and the Redshifted 21 cm Line. Astrophys. J., 741:70, 2011
2011
-
[61]
A. Lidz, O. Zahn, and F. et al. Probing Reionization with the 21 cm-Galaxy Cross Power Spectrum. Astrophys. J., 690:252–266, 2009
2009
-
[62]
Loeb and S
A. Loeb and S. R. Furlanetto. The First Galaxies in the Universe . 2013
2013
-
[63]
Madau and M
P. Madau and M. Dickinson. Cosmic Star Formation History. Ann. Rev. Astron. Astro- phys., 52:415–486, 2014
2014
-
[64]
J. M. Maldacena. Non-Gaussian features of primordial fluctuations in single field infla- tionary models. JHEP, 05:013, 2003
2003
-
[65]
A. S. Maniyar, M. B´ ethermin, and G. Lagache. Star formation history from the cosmic infrared background anisotropies. A&A, 614:A39, Jun 2018
2018
-
[66]
Mashian, A
N. Mashian, A. Loeb, and A. Sternberg. Spectral Distortion of the CMB by the Cumu- lative CO Emission from Galaxies throughout Cosmic History. Mon. Not. Roy. Astron. Soc., 458(1):L99–L103, 2016
2016
-
[67]
Mashian, A
N. Mashian, A. Sternberg, and A. Loeb. Predicting the intensity mapping signal for multi-J CO lines. JCAP, 2015(11):028, Nov 2015
2015
-
[68]
Mashian, A
N. Mashian, A. Sternberg, and A. Loeb. Predicting the intensity mapping signal for multi-J CO lines. JCAP, 1511(11):028, 2015
2015
-
[69]
K. W. Masui et al. Measurement of 21 cm brightness fluctuations at z 0.8 in cross- correlation. Astrophys. J., 763:L20, 2013
2013
-
[70]
K. W. Masui, E. R. Switzer, and B. et al. Measurement of 21 cm Brightness Fluctuations at z ˜0.8 in Cross-correlation. ApJ, 763:L20, Jan. 2013
2013
-
[71]
M´ enard, R
B. M´ enard, R. Scranton, S. Schmidt, C. Morrison, D. Jeong, T. Budavari, and M. Rah- man. Clustering-based redshift estimation: method and application to data. 2013
2013
-
[72]
Moradinezhad Dizgah, G
A. Moradinezhad Dizgah, G. K. Keating, and A. Fialkov. Probing Cosmic Origins with CO and [CII] Emission Lines. Astrophys. J., 870(1):L4, 2019. 22
2019
-
[73]
Moriwaki, N
K. Moriwaki, N. Yoshida, and e. a. Shimizu. The distribution and physical properties of high-redshift [O III] emitters in a cosmological hydrodynamics simulation. MNRAS, 481:L84–L88, Nov. 2018
2018
-
[74]
L. B. Newburgh et al. HIRAX: A Probe of Dark Energy and Radio Transients. Proc. SPIE Int. Soc. Opt. Eng. , 9906:99065X, 2016
2016
-
[75]
Odegard and e
N. Odegard and e. a. Weiland. Determination of the Cosmic Infrared Background from COBE/FIRAS and Planck HFI Observations. ApJ, 877(1):40, May 2019
2019
-
[76]
Padmanabhan
H. Padmanabhan. Constraining the evolution of CII intensity through the end stages of reionization. 2018
2018
-
[77]
A. R. Parsons et al. New Limits on 21cm EoR From PAPER-32 Consistent with an X-Ray Heated IGM at z=7.7. Astrophys. J., 788:106, 2014
2014
-
[78]
A. H. Patil and S. e. a. Yatawatta. Upper Limits on the 21 cm Epoch of Reionization Power Spectrum from One Night with LOFAR. ApJ, 838(1):65, Mar 2017
2017
-
[79]
Pen, T.-C
U.-L. Pen, T.-C. Chang, and e. a. Peterson, Jeffrey B. The GMRT EoR Experiment: Limits on Polarized Sky Brightness at 150 MHz. Mon. Not. Roy. Astron. Soc. , 399:181, 2009
2009
-
[80]
M. M. Pieri et al. WEAVE-QSO: A Massive Intergalactic Medium Survey for the William Herschel Telescope. 2016
2016
-
[81]
Pourtsidou
A. Pourtsidou. Testing gravity at large scales with H I intensity mapping. MNRAS, 461:1457–1464, Sep 2016
2016
-
[82]
A. R. Pullen, O. Dor´ e, and J. Bock. Intensity Mapping across Cosmic Times with the Lyα Line. Astrophys. J., 786:111, 2014
2014
-
[83]
A. R. Pullen, P. Serra, T.-C. Chang, O. Dor´ e, and S. Ho. Search for CII Emission on Cosmological Scales at Redshift Z 2.6. 2017
2017
-
[84]
A. G. Riess and a. a. Casertano. Large Magellanic Cloud Cepheid Standards Provide a 1% Foundation for the Determination of the Hubble Constant and Stronger Evidence for Physics beyond ΛCDM. Astrophys. J., 876(1):85, 2019
2019
-
[85]
A. G. Riess et al. A 2.4% Determination of the Local Value of the Hubble Constant. Astrophys. J., 826(1):56, 2016
2016
-
[86]
B. E. Robertson, R. S. Ellis, S. R. Furlanetto, and J. S. Dunlop. Cosmic Reionization and Early Star-forming Galaxies: a Joint Analysis of new Constraints From Planck and the Hubble Space Telescope. Astrophys. J., 802(2):L19, 2015
2015
-
[87]
M. G. Santos et al. MeerKLASS: MeerKAT Large Area Synoptic Survey. 2017
2017
-
[88]
M. T. Sargent, M. B´ ethermin, and E. e. a. Daddi. The Contribution of Starbursts and Normal Galaxies to Infrared Luminosity Functions at z < 2. ApJL, 747(2):L31, Mar 2012
2012
-
[89]
Schaye, R
J. Schaye, R. A. Crain, R. G. Bower, M. Furlong, and S. et al. The EAGLE project: simulating the evolution and assembly of galaxies and their environments. MNRAS, 446(1):521–554, Jan 2015
2015
-
[90]
S. J. Schmidt, B. M´ enard, and e. a. Scranton, Ryan. Inferring the redshift distribution of the cosmic infrared background. MNRAS, 446(3):2696–2708, Jan 2015. 23
2015
-
[91]
M. B. Silva, M. G. Santos, A. Cooray, and Y. Gong. Prospects for Detecting [CII] Emission During the Epoch of Reionization. Astrophys. J., 806(2):209, 2015
2015
-
[92]
M. B. Silva, M. G. Santos, Y. Gong, A. Cooray, and J. Bock. Intensity Mapping of Ly α Emission during the Epoch of Reionization. ApJ, 763:132, Feb. 2013
2013
-
[93]
M. B. Silva, S. Zaroubi, R. Kooistra, and A. Cooray. Tomographic Intensity Mapping versus Galaxy Surveys: Observing the Universe in H-alpha emission with new generation instruments. arXiv e-prints, page arXiv:1711.09902, Nov. 2017
2017 arXiv
-
[94]
E. F. Spring and M. J. Micha lowski. Observational evidence for constant gas accretion rate since z = 5. MNRAS, 471(1):L101–L104, Oct 2017
2017
-
[95]
G. J. Stacey et al. CCAT-prime: Science with an Ultra-widefield Submillimeter Obser- vatory at Cerro Chajnantor. 2018
2018
-
[96]
Stein, M
G. Stein, M. A. Alvarez, and J. R. Bond. The mass-Peak Patch algorithm for fast gen- eration of deep all-sky dark matter halo catalogues and its N-body validation. MNRAS, 483:2236–2250, Feb. 2019
2019
-
[97]
G. Sun, L. Moncelsi, M. P. Viero, M. B. Silva, J. Bock, and B. et al. A Foreground Masking Strategy for [C II] Intensity Mapping Experiments Using Galaxies Selected by Stellar Mass and Redshift. ApJ, 856(2):107, Apr 2018
2018
-
[98]
The Origins Space Telescope (OST) Mission Concept Study Interim Report
The OST mission concept study team. The Origins Space Telescope (OST) Mission Concept Study Interim Report. arXiv e-prints, page arXiv:1809.09702, Sep 2018
2018 arXiv
-
[99]
S. J. Tingay, R. Goeke, and e. a. Bowman. The Murchison Widefield Array: The Square Kilometre Array Precursor at Low Radio Frequencies. Publications of the Astronomical Society of Australia, 30:e007, Jan 2013
2013
-
[100]
Vallini, A
L. Vallini, A. Pallottini, A. Ferrara, S. Gallerani, E. Sobacchi, and C. Behrens. CO line emission from galaxies in the Epoch of Reionization. MNRAS, 473(1):271–285, Jan 2018
2018
-
[101]
M. P. van Haarlem, M. W. Wise, A. W. Gunst, G. Heald, and e. a. McKean. LOFAR: The LOw-Frequency ARray. A&A, 556:A2, Aug 2013
2013
-
[102]
Verde, T
L. Verde, T. Treu, and A. G. Riess. Tensions between the Early and the Late Universe. 2019
2019
-
[103]
M. P. Viero, L. Moncelsi, and e. a. Quadri, R. F. HerMES: The Contribution to the Cosmic Infrared Background from Galaxies Selected by Mass and Redshift. ApJ, 779:32, Dec. 2013
2013
-
[104]
Villaescusa-Navarro, S
F. Villaescusa-Navarro, S. Genel, and e. a. Castorina. Ingredients for 21 cm Intensity Mapping. ApJ, 866:135, Oct. 2018
2018
-
[105]
T. Wang, C. Schreiber, and C. e. a. Elbaz. A dominant population of optically invisible massive galaxies in the early Universe. arXiv e-prints, page arXiv:1908.02372, Aug 2019
1908 arXiv
-
[106]
K. C. Wong et al. H0LiCOW XIII. A 2.4% measurement of H0 from lensed quasars: 5.3σ tension between early and late-Universe probes. 2019
2019
-
[107]
F. Wu, Y. Wang, and Z. et al. Tianlai: a 21cm radio telescope array for BAO and dark energy, status and progress. In Proceedings, 51st Rencontres de Moriond, Cosmology session: La Thuile, Italy, March 19-26, 2016 , pages 315–318. ARISF, ARISF, 2016. 24
2016
-
[108]
S. Yang, A. R. Pullen, and E. R. Switzer. Evidence for CII diffuse line emission at redshift z∼ 2.6. 2019
2019
-
[109]
Zhang, D
Z.-Y. Zhang, D. Romano, and R. J. e. a. Ivison. Stellar populations dominated by massive stars in dusty starburst galaxies across cosmic time. Nature, 558:260–263, June 2018. 25
2018
Reviewed August 14, 2026 · model on record in the stance chip above.
Discussion (0). Continue with ORCID to comment.