REVIEW 4 major objections 5 minor 2 cited by
A Theoretical Three-Dimensional Diagram to Separate Star Formation, Active Galactic Nuclei, and Shocks in Galaxies
T0 review · 4 major / 5 minor · reviewed 2026-08-07 · deepseek-v4-flash
Pith's one-line read A theoretical three-dimensional diagram built from two optical line ratios and the [O III] velocity dispersion separates star formation, AGN, and shocks simultaneously in galaxy IFU data.
desk verdict A genuinely new and promising diagnostic idea, but the third axis is empirically anchored and the headline fast-shock detection sits exactly on the method's least-tested assumption. read the letter →
The pith
A machine-rendered reading of the paper's core claim, the machinery that carries it, and where it could break.
The reading
What carries the argument
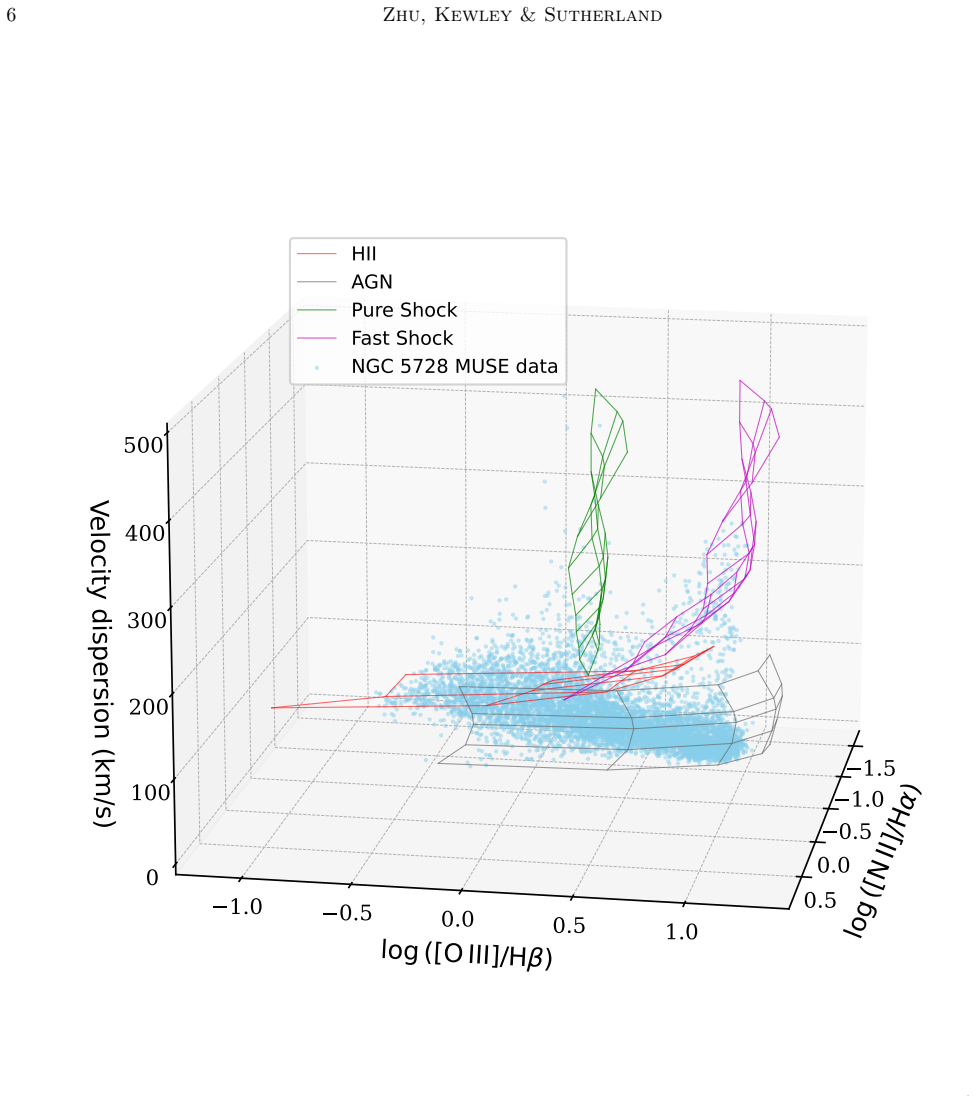
The load-bearing object is the theoretical 3D diagram itself, with axes log([N II]/Hα), log([O III]/Hβ), and the [O III] velocity dispersion. The HII and AGN model grids come from photoionization calculations, while the shock grids come from self-consistent radiative shock and precursor models; because photoionization models do not predict kinematics, the velocity-dispersion coordinates of HII and AGN spaxels are set empirically from the observed average dispersion of spaxels selected by BPT classification, whereas for shocks the shock velocity is used as a proxy for dispersion assuming an upright viewing angle. The separation mechanism is geometric: each spaxel's fractional contribution is computed as the normalized inverse distance to four basis spaxels representing HII, AGN, fast shock, and pure shock, with special rules assigning 100 percent shock contribution to spaxels lying above the shock basis points. The same geometry lets the models' underlying physical parameters be read off from the nearest model grid lines.
What would settle it
Simulate or observe a fast shock whose propagation direction lies nearly in the plane of the sky, so its line-of-sight velocity dispersion is near zero; the 3D diagram would place those spaxels at low [O III] dispersion and classify them as HII or AGN, while an independent tracer such as a broad kinematic component or an X-ray temperature measurement would identify them as shocks, falsifying the projection assumption.
Extended reading notes
Core claim
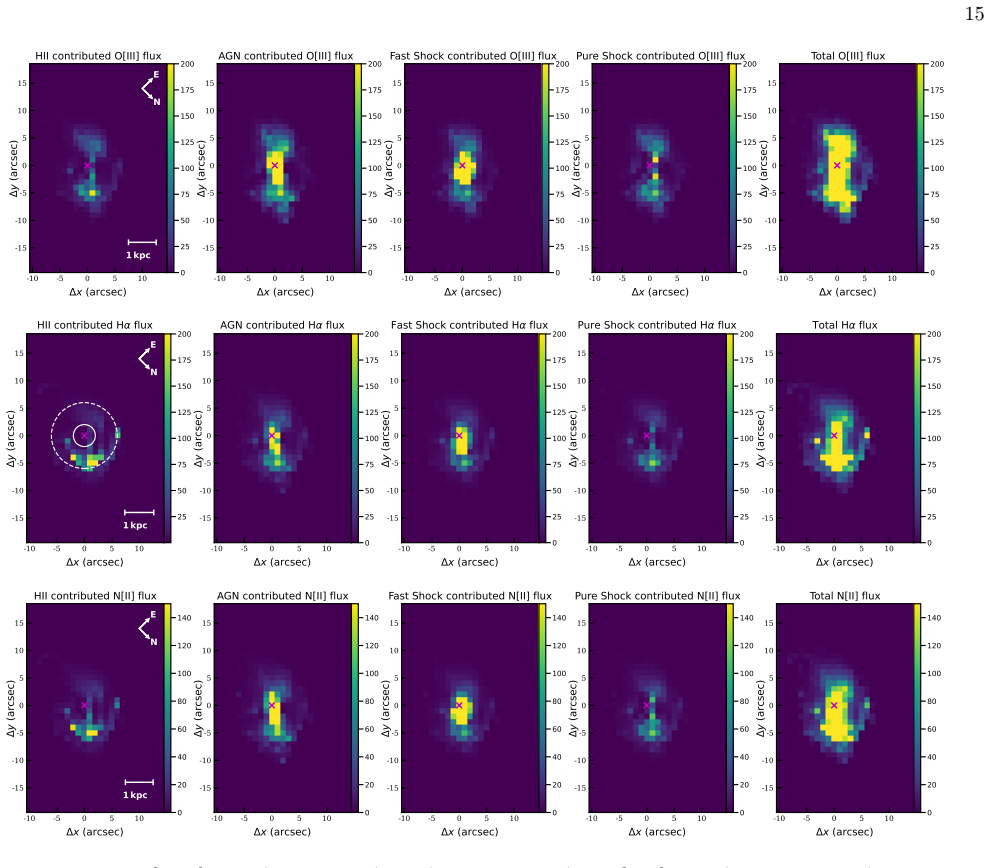
On its own terms, the paper claims that the space defined by [N II]/Hα, [O III]/Hβ, and the [O III] velocity dispersion, populated by theoretical model grids for HII regions, AGN narrow-line regions, and radiative shocks, separates the three excitation families well enough to classify every spaxel. All models are computed with the same atomic data, so differences in predicted line ratios come from the excitation mechanism rather than from inconsistent model assumptions. Applying the diagram to NGC 5728, the paper assigns each spaxel fractional contributions from HII, AGN, fast shocks, and pure shocks by inverse distance to four basis spaxels; the result is a roughly 1 kpc star-forming ring, an AGN bicone extending about 2 kpc from the nucleus, and a fast-shock-dominated structure at the bicone base that is a new detection for this galaxy, with pure shocks forming a surrounding shell. Because each spaxel lands near a model grid line, the same diagram yields gas metallicity, ionization parameter, and pressure for the separated regions.
Load-bearing premise
The load-bearing assumption is that a single measured [O III] velocity dispersion faithfully represents each excitation mechanism: the HII and AGN values are set empirically from selected spaxels, and for shocks the shock velocity is equated to the observed dispersion for shocks moving toward the observer, so any projection, beam smearing, or kinematic blending that changes the dispersion shifts spaxels vertically in the diagram and can turn a shock into an AGN or star-formation classification.
Editorial extensions
If this is right
- Galaxies observed only in optical light can be mapped into star-formation-dominated, AGN-dominated, and shock-dominated regions without X-ray or radio data, enlarging the sample for AGN and feedback studies.
- Separating mechanisms before measuring emission-line fluxes changes derived quantities; for NGC 5728 the Hα-based star formation rate of the ring is estimated at 1.17 ± 0.05 solar masses per year from MUSE data and 0.57 ± 0.04 from the lower-resolution data, both lower than estimates that did not remove shock and AGN contributions.
- IFU data at roughly 1 arcsec resolution reproduce the same excitation structures as higher-resolution data, so the method can be applied to large optical IFU surveys and, at lower physical resolution, to high-redshift space-based IFU observations.
- For NGC 5728 the diagram identifies a fast-shock-dominated region at the base of the AGN bicone and a surrounding shell of pure shock emission, structures that were not visible in 2D BPT classification.
Reading between the lines
- If projection effects were corrected using the galaxy inclination, the same diagram could classify shocks moving across the line of sight rather than only shocks propagating toward the observer, which is the orientation where the current version is most effective.
- Because the three model families share atomic data and abundance sets, the same construction could be transplanted to other line-ratio pairs or to rest-optical lines at high redshift, making the diagram a template for classifying excitation in regimes beyond the local universe.
- The basis-point and inverse-distance recipe is a heuristic, not a fit; its accuracy could be tested directly by comparing the resulting shock fractions against independent tracers such as X-ray plasma temperatures, radio jet structures, or mid-infrared H2 line ratios in the same galaxies.
- Applying the method to large IFU samples could produce a statistical census of how often fast shocks accompany AGN outflows, but beam smearing must be controlled at coarse resolution or the shock fractions will be systematically biased.
Editorial analysis
A structured set of objections, weighed in public.
Referee Report
Summary. The paper proposes a three-dimensional diagnostic diagram for classifying ionizing sources in optical IFU data, with axes log([N II]/Hα), log([O III]/Hβ), and emission-line velocity dispersion. The diagram is populated with MAPPINGS-based theoretical grids for H II regions, AGN narrow-line regions, pure shocks, and fast shocks. Applied to VLT/MUSE and WiFeS/S7 observations of NGC 5728, the method produces a star-forming ring at ~1 kpc, an AGN bicone extending ~2-5 kpc, and a fast-shock-dominated region at the base of the bicone, along with maps of fractional contributions from each mechanism. The authors argue that the diagram simultaneously separates star formation, AGN, and shocks using only optical data.
Significance. If the method holds up, it would be a valuable addition to the IFU toolkit, potentially applicable to large surveys such as SAMI and MaNGA and to high-redshift JWST observations. The paper has real strengths: the model grids are built with a common, self-consistent set of MAPPINGS calculations; the application to two independent datasets (MUSE and S7) yields broadly consistent spatial structures; and the Monte Carlo uncertainty propagation is clearly described. However, the central claim that the z-axis separates fast shocks from AGN and H II regions rests on an assumption that the authors themselves qualify, and several calibration choices are made from the same galaxy to which the method is then applied. These issues are load-bearing for the quantitative classification, so the present version requires substantial revision.
major comments (4)
- [Section 4, velocity dispersion axis]
- [Section 5, Steps (iv)-(vi)]
- [Sections 3.3 and 5, calibration of shock and basis grids]
- [Section 5, Step (v), fast/pure shock divider]
minor comments (5)
- [Section 5, Step (ii)]
- [Section 5, Step (v)]
- [Figures 4 and 7]
- [Introduction]
- [Section 6 and Table 1]
Circularity Check
Partial circularity: the HII/AGN vertical positions are averaged from the same NGC5728 spaxels being classified, shock grids are visually tuned to the same data, and high-sigma spaxels are then assigned to shocks by a data-chosen threshold.
-
fitted input called prediction
[Section 4, paragraph on estimating velocity dispersion for HII and AGN models]
"We estimate the average velocity dispersion from the HII-dominated and AGN-dominated spaxels in the NGC5728 IFU data for the HII and AGN models used in Figure 1. ... we obtain the average velocity dispersion σO[III] = 100km/s for the HII-dominated spaxels and σO[III] = 125km/s for the AGN-dominated spaxels in NGC5728. The HII model and AGN model are then fixed at their corresponding values on the velocity dispersion axis in the theoretical 3D diagram."
The z-coordinates of the 'theoretical' HII and AGN grids are not predicted by the photoionization models; they are the mean observed [O III] velocity dispersion of BPT-selected spaxels in the very same galaxy that the diagram is then used to classify. By construction, the BPT-selected HII and AGN populations have average sigma equal to the grid values, so the vertical separation between HII and AGN is a restatement of the input data rather than an independent prediction. The fractional-contribution scheme in Section 5 then uses these in-sample grid positions to compute distances, making the HII/AGN classification partly self-confirming.
-
fitted input called prediction
[Section 3.3, radiative shock model grid selection]
"In this work, we adjust the contribution from the shocked and the precursor to Hβ luminosities in increments of 0.1 and select the best-fit shock model to match the data via visual inspection. We find a pure shock-dominated model with LHβ,precursor : LHβ,shock =0.1:0.9 and a precursor-dominated model with LHβ,precursor : LHβ,shock =0.7:0.3 provide the best-fit to two shock sequences of the NGC5728 MUSE IFU data."
The precursor-to-shock Hβ ratio is a free parameter that sets where the pure-shock and fast-shock model grids sit in the diagram, and it is fitted by eye to the NGC5728 MUSE data before those grids are used to identify shock spaxels in the same galaxy. The apparent agreement between the shock grids and the data is therefore partly manufactured by tuning the mixture parameter to those data. The later 'first detection' of fast shocks in NGC5728 is not a parameter-free theoretical prediction, because the grid location used to define the shock region was calibrated on the same galaxy.
1 more flagged steps
-
fitted input called prediction
[Section 5, basis-spaxel selection and Step (v)]
"We chose the 100% fast shock spaxel from the maximum point where the AGN-fast shock mixing sequence intersects with the fast shock model grid. ... If zi > z3 and yi > 0.7, ffs = 1.0, fHII, fAGN, fps = 0"
The threshold z3 is not an independent theoretical value; it is the sigma of a 100% fast-shock basis spaxel chosen by visual inspection from the NGC5728 data as the maximum intersection point with the tuned fast-shock grid. Step (v) then promotes every spaxel with sigma above this data-chosen threshold and high [O III]/Hβ to 100% fast shock. Consequently, the fast-shock map is essentially a high-sigma selection on the observed [O III] velocity dispersion axis, with the cutoff derived from the same spaxel distribution, so the claimed fast-shock detection is partly a definitional consequence of the selection rule rather than an independent test.
full rationale
The circularity is partial rather than total. The x- and y-axis predictions ([N II]/Hα and [O III]/Hβ) for the HII, AGN, and shock model grids come from independent MAPPINGS photoionization and shock calculations, so the BPT-plane content of the diagram is not circular. However, the z-axis is the load-bearing novelty, and for HII and AGN it is fixed using the average observed sigma of BPT-selected spaxels in NGC5728, the same galaxy later classified. For shocks, the precursor-to-shock Hβ ratio is visually tuned to the NGC5728 data, and the 100% fast-shock basis spaxel is chosen from the same data; Step (v) then converts all spaxels above that data-chosen sigma threshold into 100% fast shocks. The independent consistency checks (Chandra X-ray, JWST/MIRI molecular shock evidence, and the S7 WiFeS comparison) provide some external support, but the S7 comparison is the same galaxy and the Chandra/JWST comparisons are qualitative. The quoted Monte Carlo uncertainties only propagate line-flux and sigma measurement errors, not the in-sample calibration of the z positions, the visual tuning of shock grids, or the choice of basis spaxels. Overall, the central NGC5728 fast-shock detection reduces in part to a fitted threshold applied to the same data, so a score of 6 captures the partial circularity.
Assumptions & free parameters
free parameters (7)
- Velocity dispersion anchor for HII model grid (sigma_HII) =
100 km/s
- Velocity dispersion anchor for AGN model grid (sigma_AGN) =
125 km/s
- Precursor-to-shock Hbeta ratio for pure shock grid =
0.1:0.9
- Precursor-to-shock Hbeta ratio for fast shock grid =
0.7:0.3
- Basis neighborhood threshold =
d_n < 0.2
- Fast/pure shock divider =
log([O III]/Hβ) = 0.7
- AGN model E_peak for displayed grid =
log E_peak/(keV) = -1.0
assumptions (5)
- domain assumption MAPPINGS V5.2 models provide reliable emission-line predictions for HII regions, AGN NLRs, and radiative shocks.
- domain assumption The three model sets are mutually consistent because they share atomic data and abundance sets, so line-ratio differences come only from excitation source.
- ad hoc to paper Shock velocity can serve as a proxy for observed [O III] velocity dispersion assuming an upright viewing angle.
- domain assumption Single-Gaussian [O III] sigma is dominated by the relevant excitation component and can be compared across HII, AGN, and shock spaxels.
- domain assumption Kauffmann (2003) and Kewley (2001) BPT boundaries correctly identify HII- and AGN-dominated spaxels for calibrating the sigma axis.
Cite this review
Pith. "Pith review of A Theoretical Three-Dimensional Diagram to Separate Star Formation, Active Galactic Nuclei, and Shocks in Galaxies." pith.science (2026). https://pith.science/paper/M4GTQ46D
@misc{pith2026250609962,
  author       = {Pith},
  title        = {Pith review of: A Theoretical Three-Dimensional Diagram to Separate Star Formation, Active Galactic Nuclei, and Shocks in Galaxies},
  year         = {2026},
  howpublished = {\url{https://pith.science/paper/M4GTQ46D}},
  note         = {Machine review of arXiv:2506.09962}
}
abstract
The excitation sources in galaxies are frequently mixed due to AGN and stellar feedback, including star formation, active galactic nuclei (AGNs), and shock excitation. Disentangling the star formation, AGN, and shocks in galaxy integral-field spectra (IFU) at optical wavelengths is crucial to expanding the galaxy sample for AGN and stellar feedback studies, given the lack of multiwavelength observations for most of the galaxies that are observed in optical wavelengths. Previous methods to address this issue either have a limited application range or are highly uncertain in separating AGN from shock excitation (D'Agostino et al. 2019; Johnston et al. 2023). Here, we propose a theoretical three-dimensional (3D) diagram. This theoretical 3D diagram overcomes the limitations of previous methods and can simultaneously separate star formation, AGNs, and shocks in active galaxies. Along with the separation, the new theoretical 3D diagram also constrains the gas metallicity, ionization parameter, and gas pressure within the galaxy. By applying the Very Large Telescope (VLT)/MUSE IFU data and the Wide Field Spectrograph IFU data for NGC5728 on the theoretical 3D diagram, we find a star-forming ring surrounding the galaxy center with a projected radius of $\sim$1 kpc in the sky plane, an AGN ionized-bicone extended up to $\sim$2 kpc from the nuclear center, and a fast shock dominated disk region at the base of the AGN outflow, which is likely associated with a nuclear accretion disk or a result of jet-ISM interaction. The theoretical 3D diagram opens a new window to study the interplay among star formation, AGN, and shocks in active galaxies.
Figures


Figures from the paper (4 more)


Forward citations
Cited by 2 Pith papers
-
Optical Strong Line Ratios Cannot Distinguish Between Stellar Populations and Accreting Black Holes at High Ionization Parameters and Low Metallicities
Optical strong line ratio diagnostics cannot reliably separate stellar from black hole ionizing sources at high ionization parameter and low metallicity, and higher ionization lines such as He II or [Ne V] are needed ...
-
Theoretical Diagnostics for the Physical Conditions in Active Galactic Nuclei under the View of JWST
New mid-IR line diagnostics from MAPPINGS V models to measure physical conditions in AGN for JWST.
Reference graph
Works this paper leans on
-
[1]
1,6HPBE uB T ȷ pKߠ f)!ʂ #(UI5
thebibliography [1] 20pt to REFERENCES 6pt =0pt -12pt 10pt plus 3pt =0pt =0pt =1pt plus 1pt =0pt =0pt -12pt =13pt plus 1pt =20pt =13pt plus 1pt \@M =10000 =-1.0em =0pt =0pt 0pt =0pt =1.0em @enumiv\@empty 10000 10000 `\.\@m \@noitemerr \@latex@warning Empty `thebibliography' environment \@ifnextchar \@reference \@latexerr Missing key on reference command E...
2021
-
[2]
Alatalo, K., Cales, S. L., Rich, J. A., et al. 2016, The Astrophysical Journal Supplement Series, 224, 38, 10.3847/0067-0049/224/2/38
-
[3]
Allen, J. T., Croom, S. M., Konstantopoulos, I. S., et al. 2015, Monthly Notices of the Royal Astronomical Society, 446, 1567, 10.1093/mnras/stu2057
-
[4]
Allen, M. G., Groves, B. A., Dopita, M. A., Sutherland, R. S., & Kewley, L. J. 2008, The Astrophysical Journal Supplement Series, 178, 20, 10.1086/589652
doi:10.1086/589652 2008
-
[5]
Asplund, M., Grevesse, N., Sauval, A. J., & Scott, P. 2009, Annual Review of Astronomy and Astrophysics, 47, 481, 10.1146/annurev.astro.46.060407.145222
arXiv 2009
-
[6]
2010, 7735, 773508, 10.1117/12.856027
Bacon, R., Accardo, M., Adjali, L., et al. 2010, 7735, 773508, 10.1117/12.856027
-
[7]
Baldwin, J. A., Phillips, M. M., & Terlevich, R. 1981, Publications of the Astronomical Society of the Pacific, 93, 5, 10.1086/130766
doi:10.1086/130766 1981
-
[8]
1996, The Astronomical Journal, 111, 346, 10.1086/117787
Beck-Winchatz, B., Bohm, K.-H., & Noriega-Crespo, A. 1996, The Astronomical Journal, 111, 346, 10.1086/117787
Show all 102 references
-
[9]
2016, Monthly Notices of the Royal Astronomical Society, 461, 3111, 10.1093/mnras/stw1234
Belfiore, F., Maiolino, R., Maraston, C., et al. 2016, Monthly Notices of the Royal Astronomical Society, 461, 3111, 10.1093/mnras/stw1234
2016 doi
-
[10]
A., & Tuohy, I
Binette, L., Dopita, M. A., & Tuohy, I. R. 1985, The Astrophysical Journal, 297, 476, 10.1086/163544
1985 doi
-
[11]
2019, Astronomy and Astrophysics, 628, A117, 10.1051/0004-6361/201935829
Bittner, A., Falcón-Barroso, J., Nedelchev, B., et al. 2019, Astronomy and Astrophysics, 628, A117, 10.1051/0004-6361/201935829
2019 doi
-
[12]
J., Page, M
Blustin, A. J., Page, M. J., Fuerst, S. V., Branduardi-Raymont, G., & Ashton, C. E. 2005, Astronomy and Astrophysics, 431, 111, 10.1051/0004-6361:20041775
2005 doi
-
[13]
A., Law, D
Bundy, K., Bershady, M. A., Law, D. R., et al. 2015, The Astrophysical Journal, 798, 7, 10.1088/0004-637X/798/1/7
2015 doi
-
[14]
M., González-Pérez, J
Cairós, L. M., González-Pérez, J. N., Weilbacher, P. M., & Manso Sainz, R. 2022, Astronomy and Astrophysics, 664, A144, 10.1051/0004-6361/202243028
2022 doi
-
[15]
2017, Monthly Notices of the Royal Astronomical Society, 466, 798, 10.1093/mnras/stw3020
Cappellari, M. 2017, Monthly Notices of the Royal Astronomical Society, 466, 798, 10.1093/mnras/stw3020
2017 doi
-
[16]
2004, Publications of the Astronomical Society of the Pacific, 116, 138, 10.1086/381875
Cappellari, M., & Emsellem, E. 2004, Publications of the Astronomical Society of the Pacific, 116, 138, 10.1086/381875
2004 doi
-
[17]
J., Kewley, L
D'Agostino, J. J., Kewley, L. J., Groves, B. A., et al. 2019, Monthly Notices of the Royal Astronomical Society: Letters, 485, L38, 10.1093/mnrasl/slz028
2019 doi
-
[18]
2024, Astronomy & Astrophysics, 689, A263, 10.1051/0004-6361/202449875
Davies, R., Shimizu, T., Pereira-Santaella, M., et al. 2024, Astronomy & Astrophysics, 689, A263, 10.1051/0004-6361/202449875
2024 doi
-
[19]
L., Kewley, L
Davies, R. L., Kewley, L. J., Ho, I.-T., & Dopita, M. A. 2014 a , Monthly Notices of the Royal Astronomical Society, 444, 3961, 10.1093/mnras/stu1740
2014 doi
-
[20]
L., Rich, J
Davies, R. L., Rich, J. A., Kewley, L. J., & Dopita, M. A. 2014 b , Monthly Notices of the Royal Astronomical Society, 439, 3835, 10.1093/mnras/stu234
2014 doi
-
[21]
L., Groves, B., Kewley, L
Davies, R. L., Groves, B., Kewley, L. J., et al. 2016, Monthly Notices of the Royal Astronomical Society, 462, 1616, 10.1093/mnras/stw1754
2016 doi
-
[22]
A., Ilha, G
Deconto-Machado, A., Riffel, R. A., Ilha, G. S., et al. 2022, Astronomy & Astrophysics, 659, A131, 10.1051/0004-6361/202140613
2022 doi
-
[23]
P., Young, P
Del Zanna, G., Dere, K. P., Young, P. R., & Landi, E. 2021, The Astrophysical Journal, 909, 38, 10.3847/1538-4357/abd8ce
2021 doi
-
[24]
W., Jin, C., Blaes, O., & Ward, M
Done, C., Davis, S. W., Jin, C., Blaes, O., & Ward, M. 2012, Monthly Notices of the Royal Astronomical Society, 420, 1848, 10.1111/j.1365-2966.2011.19779.x
2012
-
[25]
2007, Astrophysics and Space Science, 310, 255, 10.1007/s10509-007-9510-z
Dopita, M., Hart, J., McGregor, P., et al. 2007, Astrophysics and Space Science, 310, 255, 10.1007/s10509-007-9510-z
2007 doi
-
[26]
2010, Astrophysics and Space Science, 327, 245, 10.1007/s10509-010-0335-9
Dopita, M., Rhee, J., Farage, C., et al. 2010, Astrophysics and Space Science, 327, 245, 10.1007/s10509-010-0335-9
2010 doi
-
[27]
A., & Sutherland, R
Dopita, M. A., & Sutherland, R. S. 1995, The Astrophysical Journal, 455, 468, 10.1086/176596
1995 doi
-
[28]
1996, The Astrophysical Journal Supplement Series, 102, 161, 10.1086/192255
---. 1996, The Astrophysical Journal Supplement Series, 102, 161, 10.1086/192255
1996 doi
-
[29]
2017, The Astrophysical Journal Supplement Series, 229, 35, 10.3847/1538-4365/aa6542
---. 2017, The Astrophysical Journal Supplement Series, 229, 35, 10.3847/1538-4365/aa6542
2017 doi
-
[30]
A., Sutherland, R
Dopita, M. A., Sutherland, R. S., Nicholls, D. C., Kewley, L. J., & Vogt, F. P. A. 2013, The Astrophysical Journal Supplement Series, 208, 10, 10.1088/0067-0049/208/1/10
2013 doi
-
[31]
A., Shastri, P., Davies, R., et al
Dopita, M. A., Shastri, P., Davies, R., et al. 2015, The Astrophysical Journal Supplement Series, 217, 12, 10.1088/0067-0049/217/1/12
2015 doi
-
[32]
2018, The Astrophysical Journal, 867, 149, 10.3847/1538-4357/aae68e
Durré, M., & Mould, J. 2018, The Astrophysical Journal, 867, 149, 10.3847/1538-4357/aae68e
2018 doi
-
[33]
2019, The Astrophysical Journal, 870, 37, 10.3847/1538-4357/aaf000
---. 2019, The Astrophysical Journal, 870, 37, 10.3847/1538-4357/aaf000
2019 doi
-
[34]
J., Kewley, L
D’Agostino, J. J., Kewley, L. J., Groves, B., et al. 2019 a , The Astrophysical Journal, 878, 2, 10.3847/1538-4357/ab1d5e
2019 doi
-
[35]
J., Poetrodjojo, H., Ho, I.-T., et al
D’Agostino, J. J., Poetrodjojo, H., Ho, I.-T., et al. 2018, Monthly Notices of the Royal Astronomical Society, 479, 4907, 10.1093/mnras/sty1676
2018 doi
-
[36]
J., Kewley, L
D’Agostino, J. J., Kewley, L. J., Groves, B. A., et al. 2019 b , Monthly Notices of the Royal Astronomical Society, 487, 4153, 10.1093/mnras/stz1611
2019 doi
-
[37]
E., Asplund, M., Pettini, M., & Akerman, C
Fabbian, D., Nissen, P. E., Asplund, M., Pettini, M., & Akerman, C. 2009, Astronomy and Astrophysics, 500, 1143, 10.1051/0004-6361/200810095
2009 doi
- [38]
-
[39]
J., Chatzikos, M., Guzmán, F., et al
Ferland, G. J., Chatzikos, M., Guzmán, F., et al. 2017, Revista Mexicana de Astronomia y Astrofisica, 53, 385. https://ui.adsabs.harvard.edu/abs/2017RMxAA..53..385F
2017
-
[40]
A., Sánchez-Blázquez, P., Falcón-Barroso, J., et al
Gadotti, D. A., Sánchez-Blázquez, P., Falcón-Barroso, J., et al. 2019, Monthly Notices of the Royal Astronomical Society, 482, 506, 10.1093/mnras/sty2666
2019 doi
-
[41]
A., Dopita, M
Groves, B. A., Dopita, M. A., & Sutherland, R. S. 2004, The Astrophysical Journal Supplement Series, 153, 75, 10.1086/421114
2004 doi
-
[42]
M., Dettmar, R
Haffner, L. M., Dettmar, R. J., Beckman, J. E., et al. 2009, Reviews of Modern Physics, 81, 969, 10.1103/RevModPhys.81.969
2009 doi
-
[43]
J., Medling, A
Hampton, E. J., Medling, A. M., Groves, B., et al. 2017, Monthly Notices of the Royal Astronomical Society, 470, 3395, 10.1093/mnras/stx1413
2017 doi
-
[44]
J., & Miller, D
Hillier, D. J., & Miller, D. L. 1998, The Astrophysical Journal, 496, 407, 10.1086/305350
1998 doi
-
[45]
J., Dopita, M
Ho, I.-T., Kewley, L. J., Dopita, M. A., et al. 2014, Monthly Notices of the Royal Astronomical Society, 444, 3894, 10.1093/mnras/stu1653
2014 doi
-
[46]
M., Groves, B., et al
Ho, I.-T., Medling, A. M., Groves, B., et al. 2016, Astrophysics and Space Science, 361, 280, 10.1007/s10509-016-2865-2
2016 doi
-
[47]
2004, Astronomy and Astrophysics, 421, 649, 10.1051/0004-6361:20047132
Israelian, G., Ecuvillon, A., Rebolo, R., et al. 2004, Astronomy and Astrophysics, 421, 649, 10.1051/0004-6361:20047132
2004 doi
-
[48]
I., & Thuan, T
Izotov, Y. I., & Thuan, T. X. 1999, The Astrophysical Journal, 511, 639, 10.1086/306708
1999 doi
-
[49]
Jenkins, E. B. 2009, The Astrophysical Journal, 700, 1299, 10.1088/0004-637X/700/2/1299
2009 doi
-
[50]
2012, Monthly Notices of the Royal Astronomical Society, 425, 907, 10.1111/j.1365-2966.2012.21272.x
Jin, C., Ward, M., & Done, C. 2012, Monthly Notices of the Royal Astronomical Society, 425, 907, 10.1111/j.1365-2966.2012.21272.x
2012
-
[51]
2021, Publications of the Astronomical Society of Japan, 73, 1152, 10.1093/pasj/psab065
Joh, K., Nagao, T., Wada, K., Terao, K., & Yamashita, T. 2021, Publications of the Astronomical Society of Japan, 73, 1152, 10.1093/pasj/psab065
2021 doi
-
[52]
2023, Beyond BPT : A New Multi - Dimensional Diagnostic Diagram for Classifying Power Sources Tested Using the SAMI Galaxy Survey , arXiv
Johnston, V., Medling, A., Groves, B., et al. 2023, Beyond BPT : A New Multi - Dimensional Diagnostic Diagram for Classifying Power Sources Tested Using the SAMI Galaxy Survey , arXiv. http://arxiv.org/abs/2307.11831
2023 arXiv
-
[53]
D., Banfield, J., et al
Juneau, S., Goulding, A. D., Banfield, J., et al. 2022, The Astrophysical Journal, 925, 203, 10.3847/1538-4357/ac425f
2022 doi
-
[54]
M., Tremonti, C., et al
Kauffmann, G., Heckman, T. M., Tremonti, C., et al. 2003, Monthly Notices of the Royal Astronomical Society, 346, 1055, 10.1111/j.1365-2966.2003.07154.x
2003
-
[55]
1998, The Astrophysical Journal, 498, 541, 10.1086/305588
Kennicutt, J. 1998, The Astrophysical Journal, 498, 541, 10.1086/305588
1998 doi
-
[56]
J., Dopita, M
Kewley, L. J., Dopita, M. A., Sutherland, R. S., Heisler, C. A., & Trevena, J. 2001, The Astrophysical Journal, 556, 121, 10.1086/321545
2001 doi
-
[57]
J., Groves, B., Kauffmann, G., & Heckman, T
Kewley, L. J., Groves, B., Kauffmann, G., & Heckman, T. 2006, Monthly Notices of the Royal Astronomical Society, 372, 961, 10.1111/j.1365-2966.2006.10859.x
2006
-
[58]
J., Nicholls, D
Kewley, L. J., Nicholls, D. C., Sutherland, R., et al. 2019 a , The Astrophysical Journal, 880, 16, 10.3847/1538-4357/ab16ed
2019 doi
-
[59]
J., Nicholls, D
Kewley, L. J., Nicholls, D. C., & Sutherland, R. S. 2019 b , Annual Review of Astronomy and Astrophysics, 57, 511, 10.1146/annurev-astro-081817-051832
2019 doi
-
[60]
2015, Annual Review of Astronomy and Astrophysics, 53, 115, 10.1146/annurev-astro-082214-122316
King, A., & Pounds, K. 2015, Annual Review of Astronomy and Astrophysics, 53, 115, 10.1146/annurev-astro-082214-122316
2015 doi
-
[61]
S., Reeves, J., et al
Laha, S., Reynolds, C. S., Reeves, J., et al. 2021, Nature Astronomy, 5, 13, 10.1038/s41550-020-01255-2
2021 doi
-
[62]
1996, Astronomy and Astrophysics, 315, L137
Lutz, D., Genzel, R., Sternberg, A., et al. 1996, Astronomy and Astrophysics, 315, L137. https://ui.adsabs.harvard.edu/abs/1996A&A...315L.137L
1996
-
[63]
2021, arXiv:2109.02684 [astro-ph]
Mannucci, F., Belfiore, F., Curti, M., et al. 2021, arXiv:2109.02684 [astro-ph]. http://arxiv.org/abs/2109.02684
2021 arXiv
- [64]
-
[65]
M., U, V., Rich, J
Medling, A. M., U, V., Rich, J. A., et al. 2015, Monthly Notices of the Royal Astronomical Society, 448, 2301, 10.1093/mnras/stv081
2015 doi
-
[66]
Y., et al
Meenakshi, M., Mukherjee, D., Wagner, A. Y., et al. 2022, Monthly Notices of the Royal Astronomical Society, 516, 766, 10.1093/mnras/stac2251
2022 doi
-
[67]
1994, Astronomy and Astrophysics Supplement Series, 103, 97
Meynet, G., Maeder, A., Schaller, G., Schaerer, D., & Charbonnel, C. 1994, Astronomy and Astrophysics Supplement Series, 103, 97. https://ui.adsabs.harvard.edu/abs/1994A&AS..103...97M
1994
-
[68]
A., & Lotz, J
Mortazavi, S. A., & Lotz, J. M. 2019, Monthly Notices of the Royal Astronomical Society, 487, 1551, 10.1093/mnras/stz1331
2019 doi
-
[69]
V., Wagner, A
Mukherjee, D., Bicknell, G. V., Wagner, A. Y., Sutherland, R. S., & Silk, J. 2018, Monthly Notices of the Royal Astronomical Society, 479, 5544, 10.1093/mnras/sty1776
2018 doi
-
[70]
C., Sutherland, R
Nicholls, D. C., Sutherland, R. S., Dopita, M. A., Kewley, L. J., & Groves, B. A. 2017, Monthly Notices of the Royal Astronomical Society, 466, 4403, 10.1093/mnras/stw3235
2017 doi
-
[71]
2012, Astronomy and Astrophysics, 539, A143, 10.1051/0004-6361/201118158
Nieva, M.-F., & Przybilla, N. 2012, Astronomy and Astrophysics, 539, A143, 10.1051/0004-6361/201118158
2012 doi
-
[72]
D., & Thorne, K
Novikov, I. D., & Thorne, K. S. 1973, Astrophysics of black holes. https://ui.adsabs.harvard.edu/abs/1973blho.conf..343N
1973
-
[73]
Osterbrock, D. E. 1989, Astrophysics of gaseous nebulae and active galactic nuclei. https://ui.adsabs.harvard.edu/abs/1989agna.book.....O
1989
-
[74]
Pauldrach, A. W. A., Hoffmann, T. L., & Lennon, M. 2001, Astronomy and Astrophysics, 375, 161, 10.1051/0004-6361:20010805
2001 doi
-
[75]
J., Groves, B., et al
Poetrodjojo, H., D’Agostino, J. J., Groves, B., et al. 2019, Monthly Notices of the Royal Astronomical Society, 487, 79, 10.1093/mnras/stz1241
2019 doi
-
[76]
1997, The Astronomical Journal, 114, 2708, 10.1086/118681
Reipurth, B., Bally, J., & Devine, D. 1997, The Astronomical Journal, 114, 2708, 10.1086/118681
1997 doi
-
[77]
C., Bally, J., & Rodríguez, L
Reipurth, B., Heathcote, S., Yu, K. C., Bally, J., & Rodríguez, L. F. 2000, The Astrophysical Journal, 534, 317, 10.1086/308757
2000 doi
-
[78]
Reynolds, R. J. 1984, The Astrophysical Journal, 282, 191, 10.1086/162190
1984 doi
-
[79]
A., Kewley, L
Rich, J. A., Kewley, L. J., & Dopita, M. A. 2011, The Astrophysical Journal, 734, 87, 10.1088/0004-637X/734/2/87
2011 doi
-
[80]
2015, The Astrophysical Journal Supplement Series, 221, 28, 10.1088/0067-0049/221/2/28
---. 2015, The Astrophysical Journal Supplement Series, 221, 28, 10.1088/0067-0049/221/2/28
2015 doi
-
[81]
D., Rembold, S
Riffel, R., Mallmann, N. D., Rembold, S. B., et al. 2023, Monthly Notices of the Royal Astronomical Society, 524, 5640, 10.1093/mnras/stad2234
2023 doi
-
[82]
Salpeter, E. E. 1955, The Astrophysical Journal, 121, 161, 10.1086/145971
1955 doi
-
[83]
A., Caldwell, N., Wilson, A
Schommer, R. A., Caldwell, N., Wilson, A. S., et al. 1988, The Astrophysical Journal, 324, 154, 10.1086/165887
1988 doi
-
[84]
Schwartz, R. D. 1975, The Astrophysical Journal, 195, 631, 10.1086/153364
1975 doi
-
[85]
T., Mushotzky, R
Shimizu, T. T., Mushotzky, R. F., Meléndez, M., et al. 2017, Monthly Notices of the Royal Astronomical Society, 466, 3161, 10.1093/mnras/stw3268
2017 doi
-
[86]
T., Davies, R
Shimizu, T. T., Davies, R. I., Lutz, D., et al. 2019, Monthly Notices of the Royal Astronomical Society, 490, 5860, 10.1093/mnras/stz2802
2019 doi
-
[88]
2019 b , The Astrophysical Journal, 881, 147, 10.3847/1538-4357/ab2e72
---. 2019 b , The Astrophysical Journal, 881, 147, 10.3847/1538-4357/ab2e72
2019 doi
-
[89]
M., & McKee, C
Shull, J. M., & McKee, C. F. 1979, The Astrophysical Journal, 227, 131, 10.1086/156712
1979 doi
-
[90]
2005, Astronomy and Astrophysics, 430, 655, 10.1051/0004-6361:20041274
Spite, M., Cayrel, R., Plez, B., et al. 2005, Astronomy and Astrophysics, 430, 655, 10.1051/0004-6361:20041274
2005 doi
-
[91]
2018, Astrophysics Source Code Library, ascl:1807.005
Sutherland, R., Dopita, M., Binette, L., & Groves, B. 2018, Astrophysics Source Code Library, ascl:1807.005. https://ui.adsabs.harvard.edu/abs/2018ascl.soft07005S
2018
-
[92]
S., & Dopita, M
Sutherland, R. S., & Dopita, M. A. 1993, The Astrophysical Journal Supplement Series, 88, 253, 10.1086/191823
1993 doi
-
[93]
2017, The Astrophysical Journal Supplement Series, 229, 34, 10.3847/1538-4365/aa6541
---. 2017, The Astrophysical Journal Supplement Series, 229, 34, 10.3847/1538-4365/aa6541
2017 doi
-
[94]
F., Kennicutt, R
Sánchez, S. F., Kennicutt, R. C., Gil de Paz, A., et al. 2012, Astronomy and Astrophysics, 538, A8, 10.1051/0004-6361/201117353
2012 doi
-
[95]
D., Groves, B
Thomas, A. D., Groves, B. A., Sutherland, R. S., et al. 2016, The Astrophysical Journal, 833, 266, 10.3847/1538-4357/833/2/266
2016 doi
-
[96]
D., Dopita, M
Thomas, A. D., Dopita, M. A., Shastri, P., et al. 2017, The Astrophysical Journal Supplement Series, 232, 11, 10.3847/1538-4365/aa855a
2017 doi
-
[97]
2010, Monthly Notices of the Royal Astronomical Society, 404, 1639, 10.1111/j.1365-2966.2010.16407.x
Vazdekis, A., Sánchez-Blázquez, P., Falcón-Barroso, J., et al. 2010, Monthly Notices of the Royal Astronomical Society, 404, 1639, 10.1111/j.1365-2966.2010.16407.x
2010
-
[98]
Veilleux, S., & Osterbrock, D. E. 1987, The Astrophysical Journal Supplement Series, 63, 295, 10.1086/191166
1987 doi
-
[99]
Vogt, F. P. A., Dopita, M. A., & Kewley, L. J. 2013, The Astrophysical Journal, 768, 151, 10.1088/0004-637X/768/2/151
2013 doi
-
[100]
2016, The Astrophysical Journal, 817, 108, 10.3847/0004-637X/817/2/108
Woo, J.-H., Bae, H.-J., Son, D., & Karouzos, M. 2016, The Astrophysical Journal, 817, 108, 10.3847/0004-637X/817/2/108
2016 doi
-
[101]
Zhang, L., Packham, C., Hicks, E. K. S., et al. 2024, The Galaxy Activity , Torus , and Outflow Survey ( GATOS ). ( IV ): Exploring Ionized Gas Outflows in Central Kiloparsec Regions of GATOS Seyferts , 10.3847/1538-4357/ad6a4b
2024 doi
-
[102]
J., & Sutherland, R
Zhu, P., Kewley, L. J., & Sutherland, R. S. 2023, The Astrophysical Journal, 954, 175, 10.3847/1538-4357/acd757
2023 doi
-
[103]
2024, The Astrophysical Journal, 977, 187, 10.3847/1538-4357/ad8f37
---. 2024, The Astrophysical Journal, 977, 187, 10.3847/1538-4357/ad8f37
2024 doi
Reviewed August 7, 2026 · model on record in the stance chip above.
Discussion (0). Continue with ORCID to comment.