Multi-thermal dynamics and transverse oscillations of solar spicules revealed by coordinated SST, IRIS, and SDO observations
Pith reviewed 2026-06-25 19:08 UTC · model grok-4.3
The pith
Solar spicules are multithermal jets connected to the corona whose transverse waves carry energy for heating.
A machine-rendered reading of the paper's core claim, the machinery that carries it, and where it could break.
Core claim
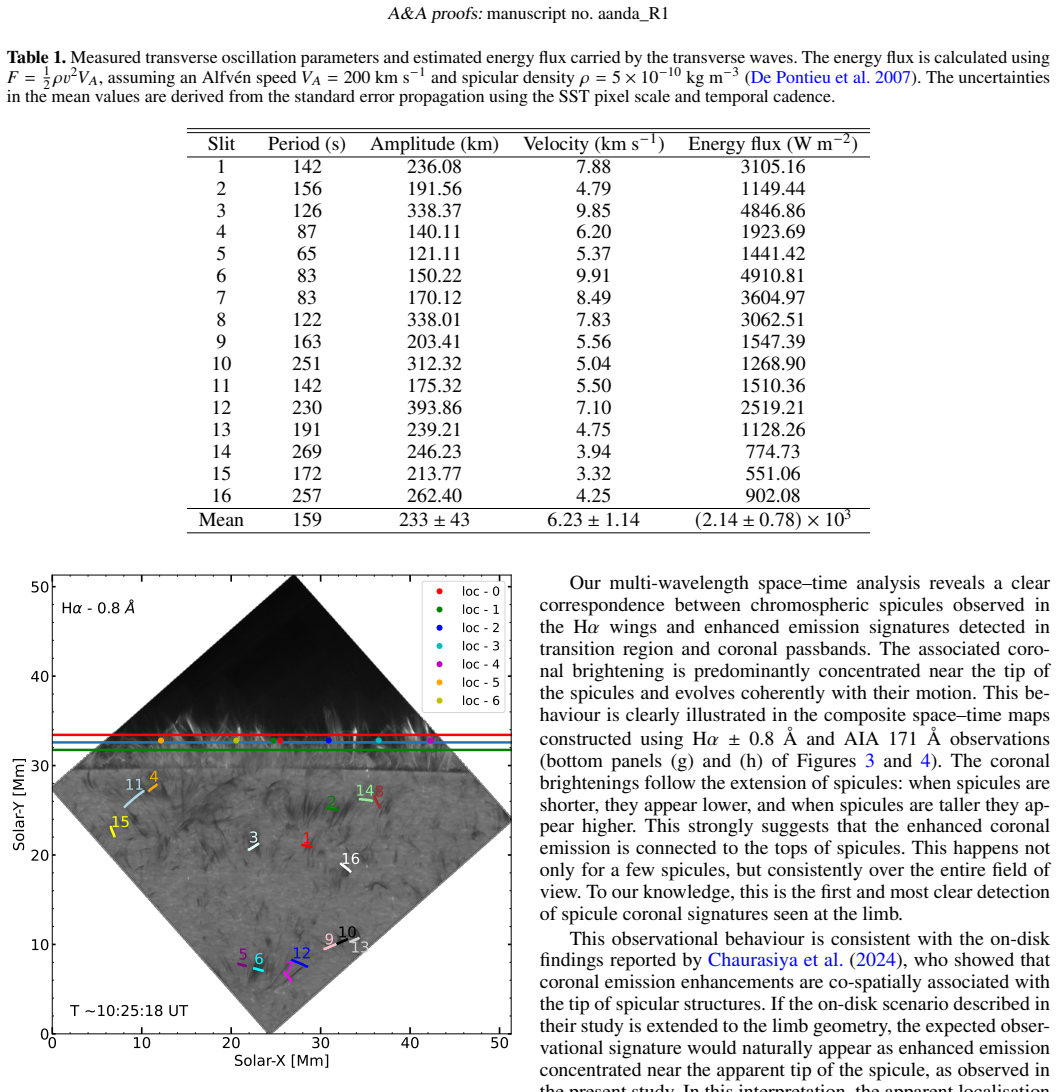
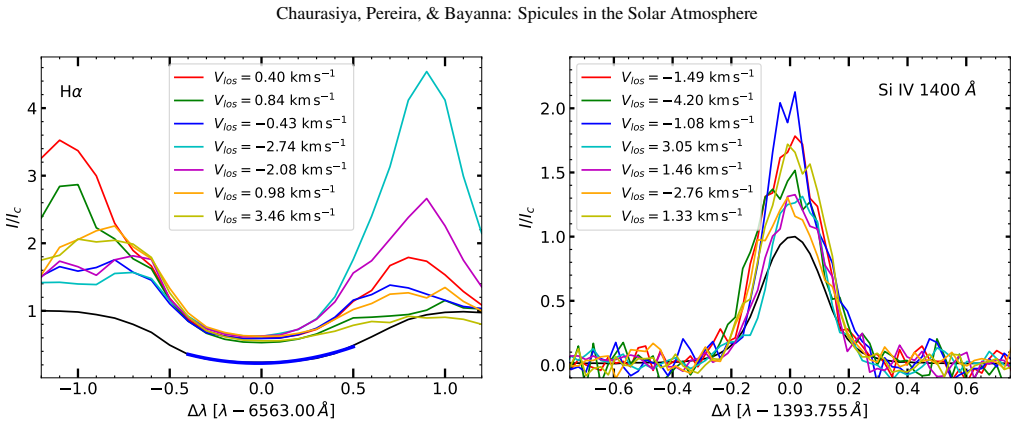
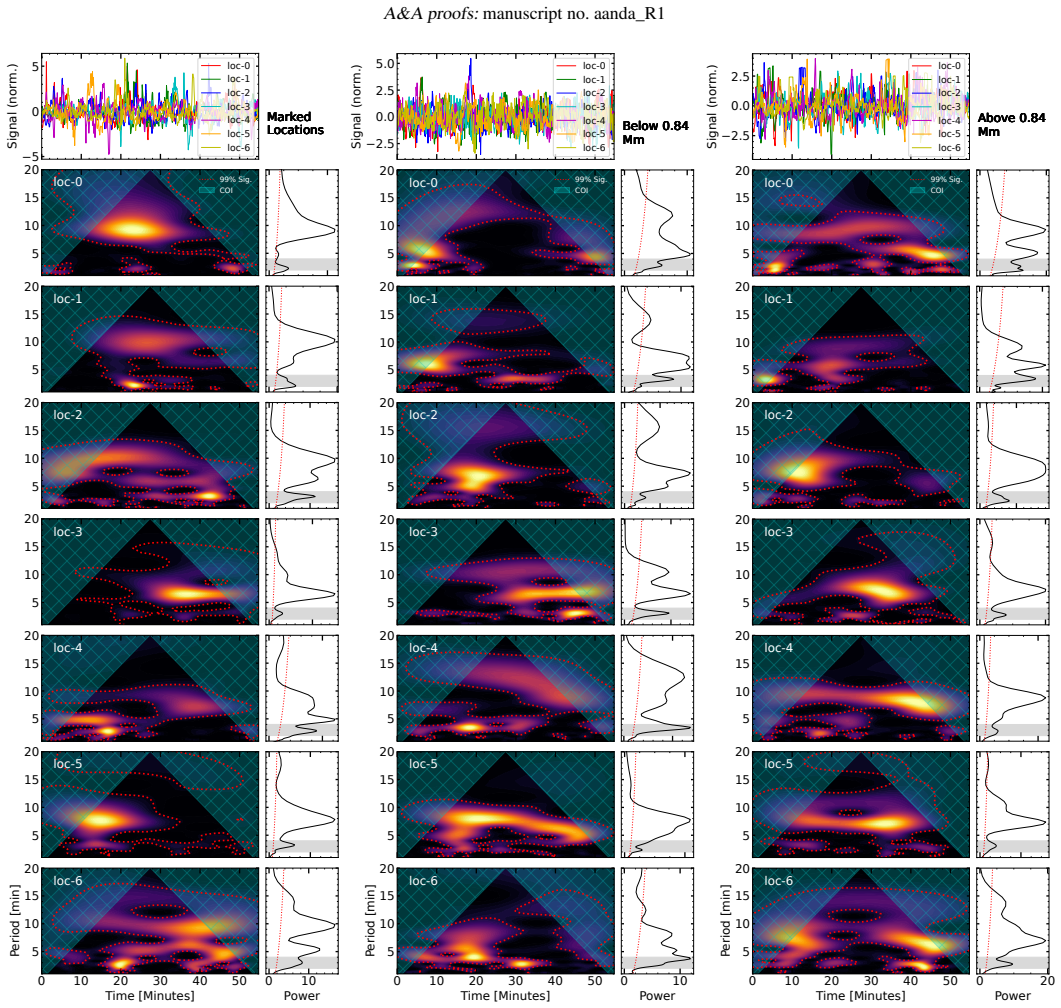
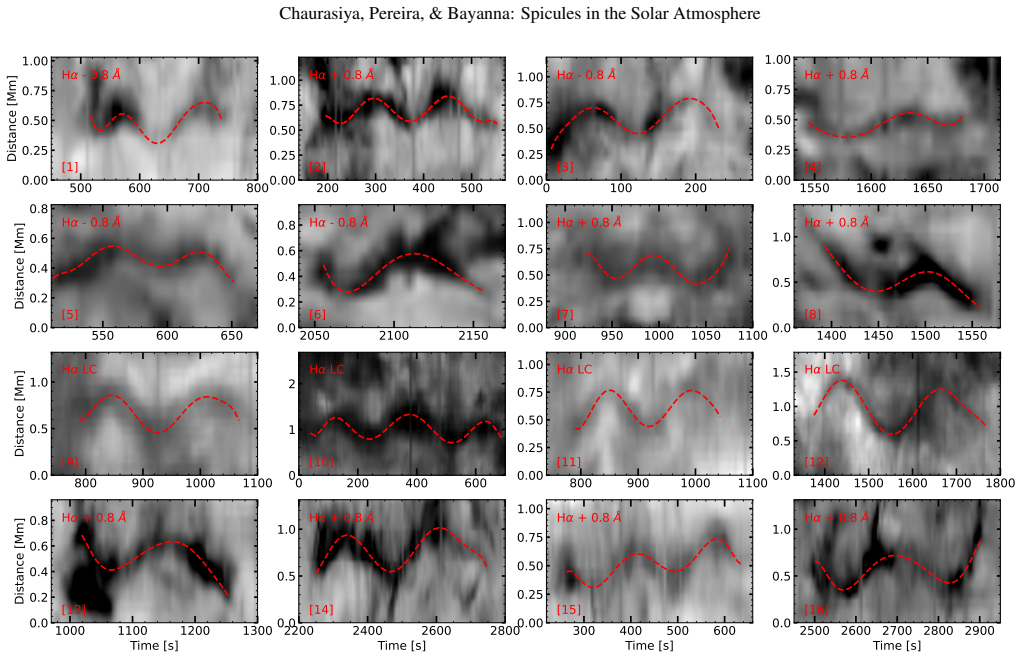
Space-time analysis reveals a clear correspondence between chromospheric spicules and coronal emission in AIA 171 Å that evolves coherently with spicule extension. Doppler velocities from H-alpha and Si IV show opposite signs, indicating multi-thermal plasma flows. Wavelet analysis reveals frequently dominant three-minute oscillations along with high-frequency transverse oscillations of 65 to 270 seconds, velocity amplitudes of 3.3 to 9.9 km/s, and a mean energy flux of (2.14 plus or minus 0.78) times 10 to the 3 W m to the minus 2. These results demonstrate that spicules are multithermal, dynamic structures connected to the transition region and corona, and that transverse waves carry subst
What carries the argument
Space-time diagrams combined with wavelet tracking of transverse displacements across H-alpha, Si IV, and AIA 171 Å channels to extract periods, amplitudes, and wave energy flux.
If this is right
- Spicules supply both mass and energy to the transition region and corona.
- Transverse waves in spicules can deliver an energy flux comparable to quiet-Sun coronal heating requirements.
- Opposite Doppler signs imply simultaneous upflows in cool plasma and downflows in hotter plasma within the same structures.
- Dominant three-minute and shorter-period oscillations point to multiple excitation mechanisms operating in spicules.
Where Pith is reading between the lines
- If the measured energy flux persists over the full height of the atmosphere, spicules could close a measurable fraction of the coronal energy budget.
- Repeating the same multi-telescope tracking at different latitudes or activity levels would test whether the reported wave properties are typical.
- The same displacement-tracking method could be applied to other chromospheric jets to compare their wave-energy contributions.
Load-bearing premise
The observed space-time match between H-alpha spicules and AIA 171 Å emission reflects a direct physical connection rather than a line-of-sight coincidence, and the tracked transverse motions are propagating waves whose energy flux is computed without large unaccounted losses.
What would settle it
Simultaneous imaging in which spicule extensions in H-alpha show no corresponding brightening or extension in AIA 171 Å, or energy-flux values that drop well below 10 to the 3 W m to the minus 2 after correction for damping.
Figures
read the original abstract
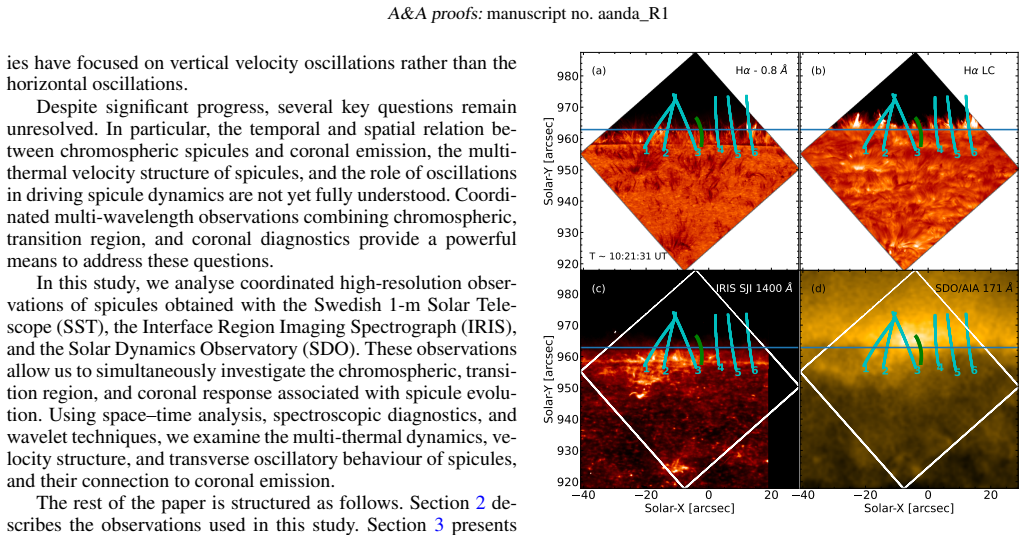
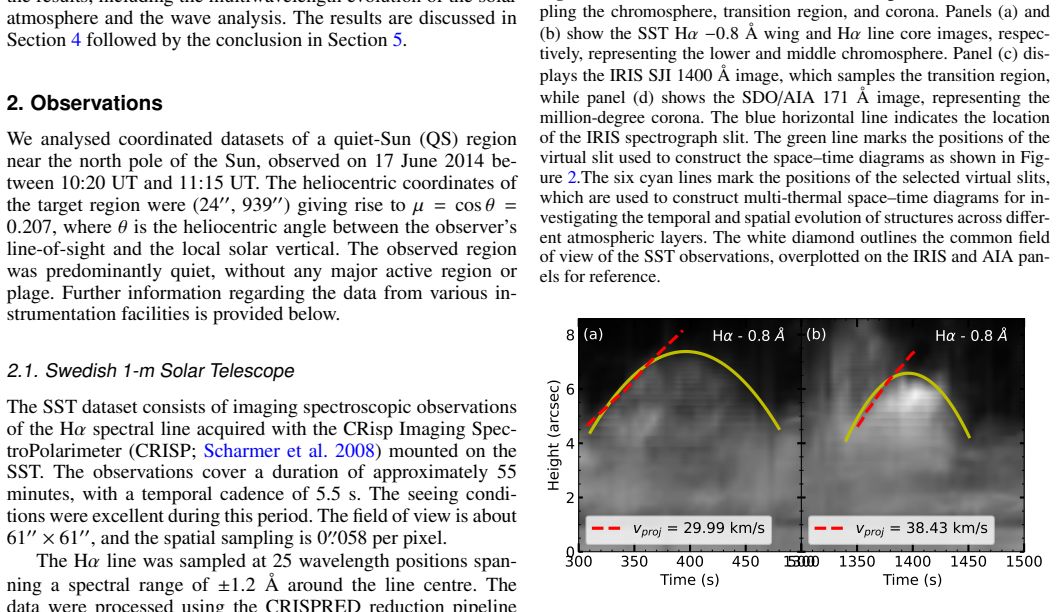
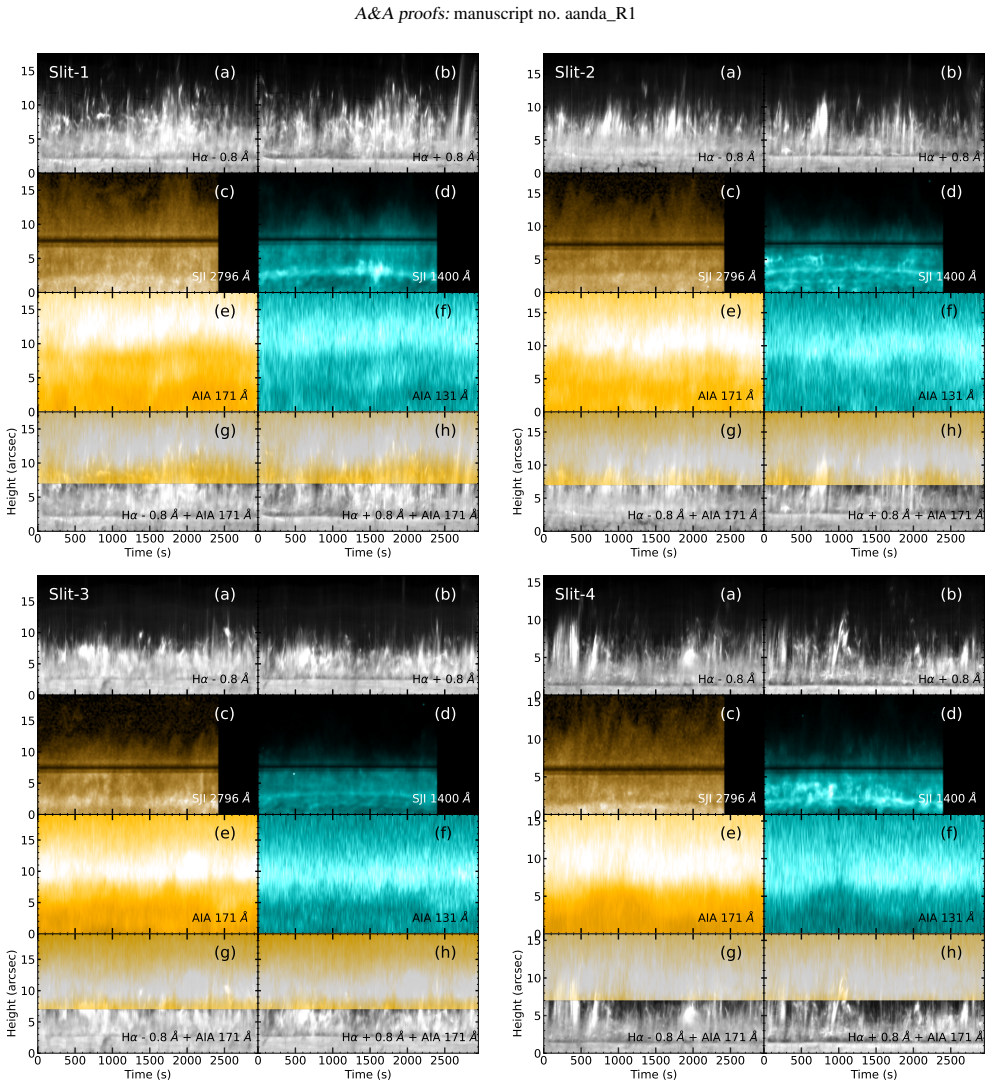
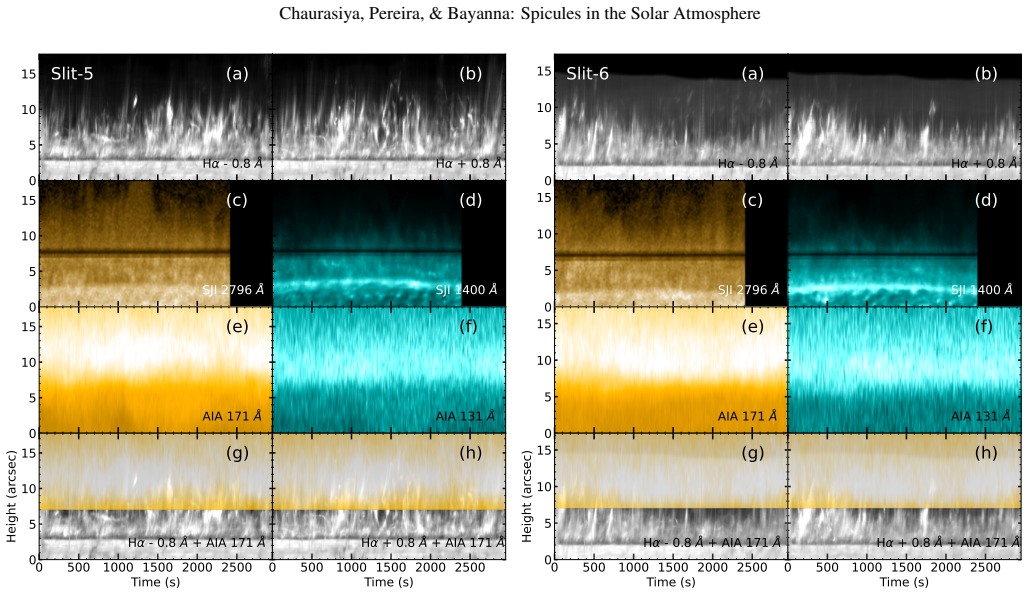
% context heading (optional) {Solar spicules are highly dynamic chromospheric jets that play an important role in the mass and energy balance of the solar atmosphere, though their connection to the transition region and corona remains unclear.} % aims heading (mandatory) {We investigate the dynamical and multi-thermal properties of spicules, their connection to higher atmospheric layers, and their transverse oscillations and associated energy flux.} % methods heading (mandatory) {We analyse coordinated high-resolution observations from the Swedish 1-m Solar Telescope (SST) in H$\alpha$, the Interface Region Imaging Spectrograph (IRIS) in \ion{Si}{iv} 1400~\AA, and the Solar Dynamics Observatory (SDO)/Atmospheric Imaging Assembly (AIA) coronal channels. Space-time diagrams, spectral analysis, and wavelet techniques are used to study temporal evolution, Doppler velocities, and oscillatory properties. Transverse displacements of spicules are tracked to estimate wave properties and energy flux.} % results heading {Space-time analysis reveals a clear correspondence between chromospheric spicules and coronal emission in AIA 171~\AA, evolving coherently with spicule extension. Doppler velocities from H$\alpha$ and \ion{Si}{iv} show opposite signs, indicating multi-thermal plasma flows. Wavelet analysis reveals frequently dominant $\sim$3-minute oscillations, along with high-frequency transverse oscillations (65--270~s) with velocity amplitudes of 3.3--9.9~km~s$^{-1}$ and a mean energy flux of $(2.14 \pm 0.78)\times10^{3}$~W~m$^{-2}$.} % conclusions heading (optional) {These results demonstrate that spicules are multithermal, dynamic structures connected to the transition region and corona, and that transverse waves carry substantial energy, highlighting their role in coronal heating.}
Editorial analysis
A structured set of objections, weighed in public.
Referee Report
Summary. The paper analyzes coordinated SST Hα, IRIS Si IV, and SDO/AIA observations of solar spicules. It reports coherent space-time evolution between chromospheric spicules and coronal AIA 171 Å emission, opposite Doppler signs in Hα and Si IV indicating multi-thermal flows, dominant ~3-minute oscillations plus high-frequency transverse waves (periods 65–270 s, amplitudes 3.3–9.9 km s⁻¹), and a mean transverse-wave energy flux of (2.14 ± 0.78)×10³ W m⁻², concluding that spicules are multi-thermal structures linked to the transition region and corona that supply substantial wave energy for coronal heating.
Significance. If the space-time alignments reflect genuine physical continuity rather than projection, the multi-instrument dataset would strengthen observational evidence that spicules transport mass and wave energy into the upper atmosphere. The reported energy flux value, derived from tracked displacements and wavelet analysis, would contribute a concrete number to the coronal-heating debate, complementing earlier single-instrument studies.
major comments (2)
- [Results, space-time analysis] Results (space-time diagrams): The central claim of a direct multi-thermal connection to the transition region and corona rests on the reported 'clear correspondence' and 'coherent evolution' between Hα spicules and AIA 171 Å emission. No quantitative metric (cross-correlation coefficient, alignment significance test, or Monte Carlo comparison against random LOS overlaps) or forward-modelled projection test is described to distinguish physical continuity from geometric coincidence in an optically thin atmosphere. This interpretation is load-bearing for both the multi-thermal conclusion and the relevance of the derived wave energy flux to coronal heating.
- [Methods (wavelet and tracking) and Results (energy flux)] Methods and Results (energy flux): The transverse-wave energy flux is stated as (2.14 ± 0.78)×10³ W m⁻² with velocity amplitudes 3.3–9.9 km s⁻¹. The manuscript does not specify the exact formula employed, the adopted density and filling factor, the assumption that the tracked displacements represent undamped propagating kink or Alfvén waves without mode conversion, or a full error budget that includes uncertainties in period, amplitude, and propagation speed. Without these details the quoted flux cannot be independently verified as supporting a substantial heating contribution.
minor comments (1)
- [Abstract] The abstract lists the energy-flux uncertainty but provides no corresponding discussion of how the ±0.78 uncertainty was propagated from the individual amplitude and period measurements.
Simulated Author's Rebuttal
We thank the referee for the constructive comments. We address each major comment below and will revise the manuscript accordingly to strengthen the quantitative support and methodological transparency.
read point-by-point responses
-
Referee: [Results, space-time analysis] Results (space-time diagrams): The central claim of a direct multi-thermal connection to the transition region and corona rests on the reported 'clear correspondence' and 'coherent evolution' between Hα spicules and AIA 171 Å emission. No quantitative metric (cross-correlation coefficient, alignment significance test, or Monte Carlo comparison against random LOS overlaps) or forward-modelled projection test is described to distinguish physical continuity from geometric coincidence in an optically thin atmosphere. This interpretation is load-bearing for both the multi-thermal conclusion and the relevance of the derived wave energy flux to coronal heating.
Authors: We acknowledge that the interpretation of physical continuity between chromospheric spicules and coronal emission relies on the visual coherence shown in the space-time diagrams. While these diagrams exhibit aligned evolution, we agree that quantitative metrics would better distinguish genuine connections from projection effects. In the revised manuscript we will add cross-correlation coefficients between the Hα and AIA 171 Å space-time diagrams together with a Monte Carlo test against randomized alignments. A full forward-modelled projection test is beyond the scope of this observational study. revision: partial
-
Referee: [Methods (wavelet and tracking) and Results (energy flux)] Methods and Results (energy flux): The transverse-wave energy flux is stated as (2.14 ± 0.78)×10³ W m⁻² with velocity amplitudes 3.3–9.9 km s⁻¹. The manuscript does not specify the exact formula employed, the adopted density and filling factor, the assumption that the tracked displacements represent undamped propagating kink or Alfvén waves without mode conversion, or a full error budget that includes uncertainties in period, amplitude, and propagation speed. Without these details the quoted flux cannot be independently verified as supporting a substantial heating contribution.
Authors: We agree that the energy-flux derivation must be fully specified to permit independent verification. In the revised manuscript we will explicitly state the formula employed, the adopted density and filling factor, the assumptions regarding undamped propagating kink waves without mode conversion, and a complete error budget that propagates uncertainties from period, amplitude, and propagation speed. These details will be added to the Methods section. revision: yes
Circularity Check
No circularity: results are direct observational measurements and calculations
full rationale
The paper reports coordinated multi-instrument observations of spicules, using space-time diagrams, Doppler velocities from spectra, wavelet analysis for periods, and direct tracking of transverse displacements to compute amplitudes and energy flux via standard wave formulas. None of these steps invoke self-definitional relations, fitted parameters renamed as predictions, or load-bearing self-citations. The energy flux value is computed from measured displacements and periods; the multi-thermal interpretation follows from observed opposite Doppler signs and spatial correspondence. All quantities are externally falsifiable against the raw data and independent of any internal loop or prior author result. This is a standard observational analysis with no derivation chain that reduces to its own inputs.
Axiom & Free-Parameter Ledger
axioms (1)
- domain assumption Standard formulas relating transverse displacement amplitude, period, and plasma density to upward-propagating wave energy flux apply without significant damping or mode conversion in the observed height range.
Reference graph
Works this paper leans on
-
[1]
B., Nakariakov, V
Bate, W., Jess, D. B., Nakariakov, V . M., et al. 2022, ApJ, 930, 129
2022
-
[2]
Beckers, J. M. 1968, Sol. Phys., 3, 367
1968
-
[3]
Bradshaw, S. J. & Klimchuk, J. A. 2015, ApJ, 811, 129
2015
-
[4]
Carlsson, M., De Pontieu, B., & Hansteen, V . H. 2019, ARA&A, 57, 189
2019
-
[5]
& Bayanna, A
Chaurasiya, R. & Bayanna, A. R. 2025, MNRAS, 537, 2243
2025
-
[6]
R., & Erdélyi, R
Chaurasiya, R., Bayanna, A. R., & Erdélyi, R. 2025, MNRAS, 543, 3791
2025
-
[7]
R., Louis, R
Chaurasiya, R., Bayanna, A. R., Louis, R. E., Pereira, T. M. D., & Mathew, S. K. 2024, ApJ, 970, 179
2024
-
[8]
2026, arXiv e-prints, arXiv:2606.02516 de la Cruz Rodríguez, J., Löfdahl, M
Chaurasiya, R., Srivastava, S., Chatterjee, P., et al. 2026, arXiv e-prints, arXiv:2606.02516 de la Cruz Rodríguez, J., Löfdahl, M. G., Sütterlin, P., Hillberg, T., & Rouppe van der V oort, L. 2015, A&A, 573, A40 De Pontieu, B., Carlsson, M., Rouppe van der V oort, L. H. M., et al. 2012, ApJ, 752, L12 De Pontieu, B., Erdélyi, R., & James, S. P. 2004, Natu...
Pith/arXiv arXiv 2026
-
[9]
2007, ApJ, 655, 624 De Pontieu, B., McIntosh, S., Hansteen, V
Carlsson, M. 2007, ApJ, 655, 624 De Pontieu, B., McIntosh, S., Hansteen, V . H., et al. 2007, Publications of the Astronomical Society of Japan, 59, S655 De Pontieu, B., McIntosh, S. W., Carlsson, M., et al. 2011, Science, 331, 55 De Pontieu, B., McIntosh, S. W., Carlsson, M., et al. 2007, Science, 318, 1574 De Pontieu, B., Title, A. M., Lemen, J. R., et ...
2007
-
[10]
Henriques, V . M. J., Kuridze, D., Mathioudakis, M., & Keenan, F. P. 2016, ApJ, 820, 124
2016
-
[11]
B., Jafarzadeh, S., Keys, P
Jess, D. B., Jafarzadeh, S., Keys, P. H., et al. 2023, Living Reviews in Solar Physics, 20, 1
2023
-
[12]
B., Morton, R
Jess, D. B., Morton, R. J., Verth, G., et al. 2015, Space Sci. Rev., 190, 103
2015
-
[13]
Klimchuk, J. A. 2012, Journal of Geophysical Research (Space Physics), 117, A12102
2012
-
[14]
Klimchuk, J. A. & Bradshaw, S. J. 2014, ApJ, 791, 60
2014
-
[15]
R., Title, A
Lemen, J. R., Title, A. M., Akin, D. J., et al. 2012, Sol. Phys., 275, 17
2012
-
[16]
Okamoto, T. J. & De Pontieu, B. 2011, The Astrophysical Journal Letters, 736, L24
2011
-
[17]
A., & Young, P
Patsourakos, S., Klimchuk, J. A., & Young, P. R. 2014, ApJ, 781, 58
2014
-
[18]
Pereira, T. M. D. 2019, Advances in Space Research, 63, 1434
2019
-
[19]
Pereira, T. M. D., De Pontieu, B., & Carlsson, M. 2012, ApJ, 759, 18
2012
-
[20]
Pereira, T. M. D., De Pontieu, B., Carlsson, M., et al. 2014, ApJ, 792, L15
2014
-
[21]
Pereira, T. M. D., Rouppe van der V oort, L., & Carlsson, M. 2016, ApJ, 824, 65
2016
-
[22]
D., Thompson, B
Pesnell, W. D., Thompson, B. J., & Chamberlin, P. C. 2012, Sol. Phys., 275, 3
2012
-
[23]
2019, Science, 366, 890
Samanta, T., Tian, H., Yurchyshyn, V ., et al. 2019, Science, 366, 890
2019
-
[24]
B., Narayan, G., Hillberg, T., et al
Scharmer, G. B., Narayan, G., Hillberg, T., et al. 2008, The Astrophysical Jour- nal, 689, L69
2008
-
[25]
Shetye, J., Verwichte, E., Stangalini, M., & Doyle, J. G. 2021, ApJ, 921, 30
2021
-
[26]
Skogsrud, H., Rouppe van der V oort, L., De Pontieu, B., & Pereira, T. M. D. 2015, ApJ, 806, 170 Sow Mondal, S., Klimchuk, J. A., & Sarkar, A. 2022, ApJ, 937, 71
2015
-
[27]
& Compo, G
Torrence, C. & Compo, G. P. 1998, Bulletin of the American Meteorological Society, 79, 61
1998
-
[28]
& Klimchuk, J
Tripathi, D. & Klimchuk, J. A. 2013, ApJ, 779, 1 Van Noort, M., Rouppe Van Der V oort, L., & Löfdahl, M. G. 2005, Sol. Phys., 228, 191
2013
-
[29]
Withbroe, G. L. & Noyes, R. W. 1977, ARA&A, 15, 363
1977
-
[30]
Zaqarashvili, T. V . & Erdélyi, R. 2009, Space Sci. Rev., 149, 355 Article number, page 10 of 10
2009
discussion (0)
Sign in with ORCID, Apple, or X to comment. Anyone can read and Pith papers without signing in.