Residual-on-Residual Regression as a Tool for Effect Estimation in Observational Data
Pith reviewed 2026-07-01 01:05 UTC · model grok-4.3
The pith
Residual-on-residual regression estimates an approximately constant exposure effect by regressing outcome residuals on exposure residuals after machine learning adjustment for confounders.
A machine-rendered reading of the paper's core claim, the machinery that carries it, and where it could break.
Core claim
The central claim is that residual-on-residual regression estimates the exposure effect in a partially linear model by first fitting confounder-adjusted models for the outcome and the exposure, then regressing the outcome residuals on the exposure residuals via ordinary least squares. This yields interpretable estimates that are unbiased when the effect is approximately constant, and in simulations it outperforms AIPW and TMLE under positivity violations while remaining stable.
What carries the argument
Residual-on-residual regression, which uses ordinary least squares on residuals from machine learning models for outcome and exposure.
Load-bearing premise
The exposure effect remains approximately constant after adjustment for confounders.
What would settle it
A simulation where the true effect varies strongly with levels of a confounder, showing that the residual-on-residual estimate is biased while the true value is known.
Figures
read the original abstract
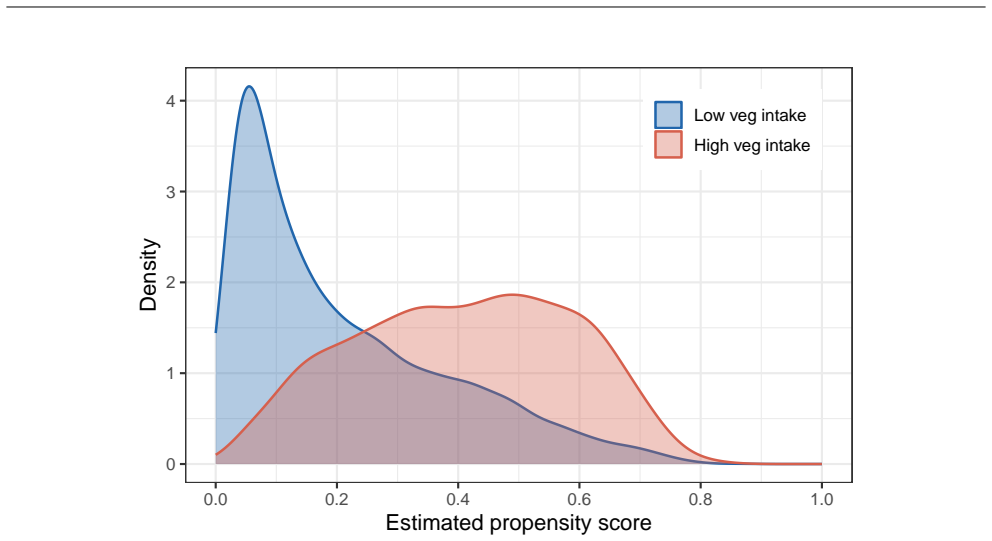
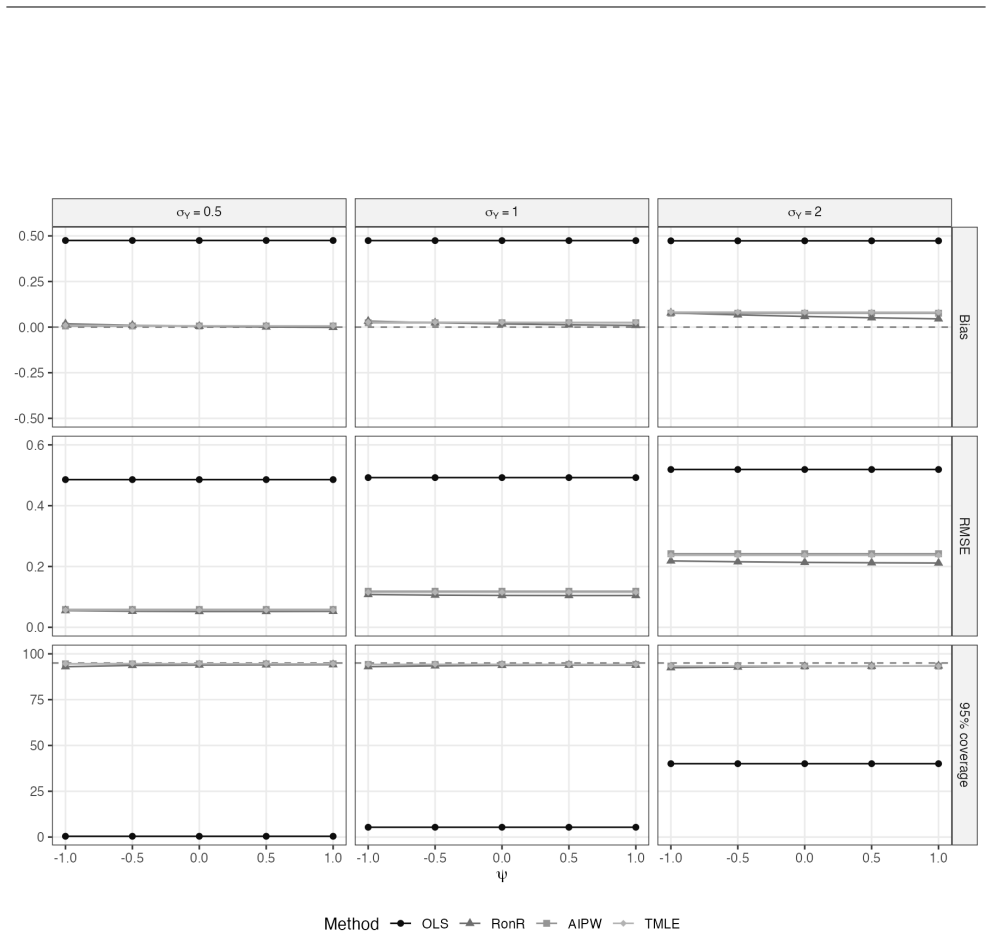
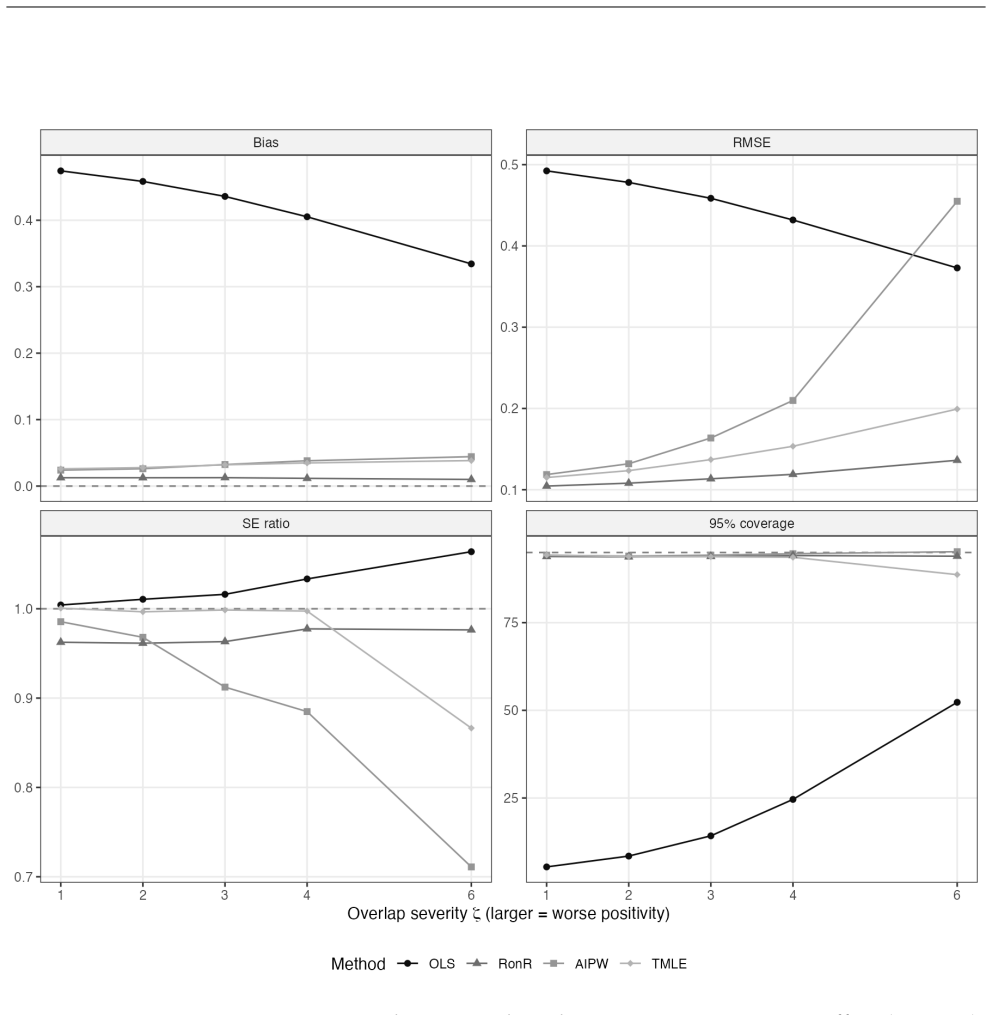
Epidemiologists increasingly use machine learning to adjust for high-dimensional confounding. Augmented inverse probability weighting (AIPW) and targeted maximum likelihood estimation (TMLE) are most widely used but may yield different results and both can become unstable under weak positivity violations. Residual-on-residual regression is a stable alternative that estimates an exposure effect encoded in a partially linear model by fitting confounder adjusted models for the outcome and exposure, then regressing outcome residuals against exposure residuals using ordinary least squares. We illustrate the approach using data from the Nulliparous Pregnancy Outcomes Study: Monitoring Mothers-to-Be (nuMoM2b; $n = 7{,}923$), estimating the association between high vegetable intake density and preeclampsia. Residual-on-residual regression, AIPW, and TMLE yielded concordant estimates, indicating a modest reduction in preeclampsia risk. In simulations, residual-on-residual regression was unbiased with near-nominal confidence interval coverage, performing comparably to AIPW and TMLE and substantially better than a misspecified parametric model when the exposure effect is approximately constant. However, in simulation settings with positivity violations, residual on residual regression outperformed AIPW and TMLE when the true effect was coded in a partially linear model. When the exposure effect is approximately constant, residual-on-residual regression is interpretable, computationally simple, and provides a triangulation strategy for observational causal inference.
Editorial analysis
A structured set of objections, weighed in public.
Referee Report
Summary. The paper claims that residual-on-residual regression provides a stable, interpretable method for estimating exposure effects in observational data under a partially linear model by regressing outcome residuals on exposure residuals after adjusting for confounders using machine learning. It demonstrates concordant results with AIPW and TMLE on the nuMoM2b data for the effect of vegetable intake on preeclampsia, and in simulations shows unbiasedness, good coverage, and better performance than AIPW/TMLE under positivity violations when the partially linear assumption holds.
Significance. If the results hold, this method offers a computationally simple triangulation strategy for causal inference in high-dimensional settings, leveraging the Frisch-Waugh-Lovell partial regression. The simulations and real-data application provide evidence of its utility when the effect is approximately constant after confounder adjustment. Strengths include the focus on stability under weak positivity and the conditional framing of the claims.
major comments (2)
- [§4 (Simulations)] §4 (Simulations): the claim that residual-on-residual regression outperformed AIPW and TMLE under positivity violations is load-bearing for the practical recommendation, yet the manuscript does not report the specific ML algorithms, hyperparameter tuning, or cross-validation procedure used to estimate the nuisance functions; performance comparisons can be sensitive to these choices.
- [§2 (Methods)] §2 (Methods), definition of the estimator: the residual-on-residual procedure is presented as a new tool, but it is the standard Robinson/Frisch-Waugh-Lovell partial-regression estimator; the manuscript should explicitly state the conditions under which the ML-based version retains the known consistency properties and any finite-sample distinctions.
minor comments (3)
- [Abstract] Abstract: the sample size is written as 'n = 7{,}923'; standard formatting (7,923 or 7923) would improve readability.
- [§5 (Application)] §5 (Application): the list of confounders and any dimension-reduction steps applied to the nuMoM2b data should be stated explicitly to allow replication of the concordant estimates.
- [References] References: add citations to Robinson (1988) and the original Frisch-Waugh-Lovell papers to situate the estimator in the existing literature.
Simulated Author's Rebuttal
We thank the referee for the constructive comments and the recommendation for minor revision. We address each major comment below.
read point-by-point responses
-
Referee: [§4 (Simulations)] §4 (Simulations): the claim that residual-on-residual regression outperformed AIPW and TMLE under positivity violations is load-bearing for the practical recommendation, yet the manuscript does not report the specific ML algorithms, hyperparameter tuning, or cross-validation procedure used to estimate the nuisance functions; performance comparisons can be sensitive to these choices.
Authors: We agree that explicit reporting of the machine learning implementation details is necessary for reproducibility and to permit evaluation of whether the reported performance differences are sensitive to those choices. In the revised manuscript we will expand Section 4 to specify the exact learners (including any ensemble or library used), hyperparameter grids or tuning procedures, and cross-validation scheme applied to the nuisance functions. This addition will directly address the concern while preserving the simulation design. revision: yes
-
Referee: [§2 (Methods)] §2 (Methods), definition of the estimator: the residual-on-residual procedure is presented as a new tool, but it is the standard Robinson/Frisch-Waugh-Lovell partial-regression estimator; the manuscript should explicitly state the conditions under which the ML-based version retains the known consistency properties and any finite-sample distinctions.
Authors: We accept that the estimator is the classical Frisch-Waugh-Lovell partial regression (equivalently Robinson’s 1988 estimator) once the nuisance functions have been estimated. Our contribution is the demonstration of its practical stability and interpretability when the nuisance functions are obtained via machine learning in high-dimensional observational settings. In the revision we will (i) cite Robinson (1988) and the FWL theorem explicitly, (ii) state the regularity conditions under which the ML-based version remains consistent (consistent nuisance estimation at appropriate rates together with the partially linear model), and (iii) note finite-sample distinctions that can arise from flexible ML versus parametric nuisance estimation. These clarifications will be added to Section 2 without altering the manuscript’s central claims. revision: yes
Circularity Check
No significant circularity; estimator defined directly via OLS on residuals
full rationale
The paper defines residual-on-residual regression explicitly as fitting confounder-adjusted models for outcome and exposure then applying OLS to the residuals, which is the standard Frisch-Waugh-Lovell partial regression estimator for a partially linear model. All performance claims (unbiasedness, coverage, outperformance under positivity violations) are conditioned on the data-generating process matching that partially linear structure, with no reduction of the estimator to a fitted parameter by construction, no self-citation load-bearing the central claim, and no ansatz or uniqueness theorem imported from prior work. Simulations enforce the same model the estimator targets, which is a standard consistency check rather than a circular prediction. The derivation chain is self-contained against external benchmarks and does not collapse to its inputs.
Axiom & Free-Parameter Ledger
axioms (1)
- domain assumption The exposure effect is approximately constant after adjustment for confounders (partially linear model)
Reference graph
Works this paper leans on
-
[1]
Defining and Identifying Average Treatment Effects.Amer- ican journal of epidemiology
Naimi AI and Whitcomb BW. Defining and Identifying Average Treatment Effects.Amer- ican journal of epidemiology. 2023;192:685–687
2023
-
[2]
Estimating Risk Ratios and Risk Differences Using Regres- sion.American journal of epidemiology
Naimi AI and Whitcomb BW. Estimating Risk Ratios and Risk Differences Using Regres- sion.American journal of epidemiology. 2020;189:508–510
2020
-
[3]
Vansteelandt S and Dukes O. Assumption-lean inference for generalised linear model parameters.Journal of the Royal Statistical Society Series B: Statistical Methodology. 2022; 84:657–685. URL https://doi.org/10.1111/rssb.12504
-
[4]
The Future of Causal Inference.American Journal of Epidemi- ology
Mitra N, Roy J, and Small D. The Future of Causal Inference.American Journal of Epidemi- ology. 2022;191:1671–1676
2022
-
[5]
Challenges in Obtaining Valid Causal Effect Estimates with Machine Learning Algorithms.American Journal of Epidemiology
Naimi AI, Mishler AE, and Kennedy EH. Challenges in Obtaining Valid Causal Effect Estimates with Machine Learning Algorithms.American Journal of Epidemiology. 2023; 192:1536–1544
2023
-
[6]
Machine Learning for Causal Inference: On the Use of Cross-fit Estimators.Epidemiology
Zivich PN and Breskin A. Machine Learning for Causal Inference: On the Use of Cross-fit Estimators.Epidemiology. 2021;32:393
2021
-
[7]
Springer
Hastie T, Tibshirani R, and Friedman JH.The Elements of Statistical Learning: Data Mining, Inference, and Prediction. Springer. 2009
2009
-
[8]
Super Learner.Statistical Applications in Genetics and Molecular Biology
van der Laan MJ, Polley EC, and Hubbard AE. Super Learner.Statistical Applications in Genetics and Molecular Biology. 2007;6:Article 25
2007
-
[9]
Semiparametric Doubly Robust Targeted Double Machine Learning: A Review
Kennedy EH. Semiparametric Doubly Robust Targeted Double Machine Learning: A Review. In:Handbook of Statistical Methods for Precision Medicine. Chapman and Hall/CRC. 2024
2024
-
[10]
Machine learning in the estimation of causal effects: Targeted minimum loss-based estimation and double/debiased machine learning.Biostatistics
Díaz I. Machine learning in the estimation of causal effects: Targeted minimum loss-based estimation and double/debiased machine learning.Biostatistics. 2020;21:353–358. 17
2020
-
[11]
Springer
Tsiatis AA.Semiparametric Theory and Missing Data. Springer. 2006
2006
-
[12]
On the Equivalence between Neyman Orthog- onality and Pathwise Differentiability
Chen Y, Kennedy EH, and Balakrishnan S. On the Equivalence between Neyman Orthog- onality and Pathwise Differentiability. 2026
2026
-
[13]
Adjusting for Differential Rates of Prophylaxis Therapy for PCP in High-Versus Low-Dose AZT Treatment Arms in an AIDS Randomized Trial.J Am Stat Assoc
Robins JM and Greenland S. Adjusting for Differential Rates of Prophylaxis Therapy for PCP in High-Versus Low-Dose AZT Treatment Arms in an AIDS Randomized Trial.J Am Stat Assoc. 1994;89:737–749
1994
-
[14]
Statistical Inference for Variable Importance.The International Journal of Biostatistics
van der Laan MJ. Statistical Inference for Variable Importance.The International Journal of Biostatistics. 2006;2
2006
-
[15]
Rudolph JE, Benkeser D, Kennedy EH, Schisterman EF, and Naimi AI. Estimation of the Average Causal Effect in Longitudinal Data With Time-Varying Exposures: The Challenge of Nonpositivity and the Impact of Model Flexibility.American journal of epidemiology. 2022;191:1962–1969
2022
-
[16]
Invited Commentary: Positivity in Practice.Am J Epidemiol
Westreich D and Cole SR. Invited Commentary: Positivity in Practice.Am J Epidemiol. 2010;171:674–677
2010
-
[17]
Diagnosing and re- sponding to violations in the positivity assumption.Stat Methods in Med Res
Petersen ML, Porter KE, Gruber S, Wang Y, and van der Laan MJ. Diagnosing and re- sponding to violations in the positivity assumption.Stat Methods in Med Res. 2012;21:31– 54
2012
-
[18]
Experiences of Racial Discrimination and Periconceptional Diet Quality.The Journal of nutrition
Bodnar LM, Odoms-Young A, Kirkpatrick SI, Naimi AI, Petersen JM, and Martin CL. Experiences of Racial Discrimination and Periconceptional Diet Quality.The Journal of nutrition. 2023;153:2369–2379
2023
-
[19]
Explaining Practical Differences Between Treatment Effect Estimators with High Dimensional Asymptotics
Yadlowsky S. Explaining Practical Differences Between Treatment Effect Estimators with High Dimensional Asymptotics. 2022
2022
-
[20]
Root-N-Consistent Semiparametric Regression.Econometrica
Robinson PM. Root-N-Consistent Semiparametric Regression.Econometrica. 1988;56:931– 954. 18
1988
-
[21]
2018;21:C1–C68
Chernozhukov V , Chetverikov D, Demirer Met al.Double/debiased machine learning for treatment and structural parameters.The Econometrics Journal. 2018;21:C1–C68
2018
-
[22]
2016;183:519–530
Haas DM, Ehrenthal DB, Koch MAet al.Pregnancy as a Window to Future Cardiovascu- lar Health: Design and Implementation of the nuMoM2b Heart Health Study.American Journal of Epidemiology. 2016;183:519–530
2016
-
[23]
Periconceptional Dietary Pat- terns and Adverse Pregnancy and Birth Outcomes.The Journal of nutrition
Bodnar LM, Kirkpatrick SI, Parisi SM, Jin Q, and Naimi AI. Periconceptional Dietary Pat- terns and Adverse Pregnancy and Birth Outcomes.The Journal of nutrition. 2024;154:680– 690
2024
-
[24]
Beltsville, MD: Agricultural Research Ser- vice, Food Surveys Research Group
Food patterns equivalents database 2011-12. Beltsville, MD: Agricultural Research Ser- vice, Food Surveys Research Group. U.S. Department of Agriculture
2011
-
[25]
Report of the American College of Obstetricians and Gy- necologists’ Task Force on Hypertension in Pregnancy.Obstetrics and Gynecology
Hypertension in pregnancy. Report of the American College of Obstetricians and Gy- necologists’ Task Force on Hypertension in Pregnancy.Obstetrics and Gynecology. 2013; 122:1122–1131
2013
-
[26]
2017;129:31–41
Facco FL, Parker CB, Reddy UMet al.Association Between Sleep-Disordered Breathing and Hypertensive Disorders of Pregnancy and Gestational Diabetes Mellitus.Obstetrics and Gynecology. 2017;129:31–41
2017
-
[27]
Piercy KL, Troiano RP , Ballard RMet al.The Physical Activity Guidelines for Americans. JAMA. 2018;320:2020–2028
2018
-
[28]
2014;25:160–166
Giles-Corti B, Macaulay G, Middleton Net al.Developing a research and practice tool to measure walkability: A demonstration project.Health Promotion Journal of Australia: Official Journal of Australian Association of Health Promotion Professionals. 2014;25:160–166
2014
-
[29]
Making Neighborhood-Disadvantage Metrics Accessi- ble — The Neighborhood Atlas.New England Journal of Medicine
Kind AJH and Buckingham WR. Making Neighborhood-Disadvantage Metrics Accessi- ble — The Neighborhood Atlas.New England Journal of Medicine. 2018;378:2456–2458
2018
-
[30]
A New Approach to Causal Inference in Mortality Studies with a Sustained 19 Exposure Period–Application to Control of the Healthy Worker Survivor Effect.Mathe- matical Modelling
Robins JM. A New Approach to Causal Inference in Mortality Studies with a Sustained 19 Exposure Period–Application to Control of the Healthy Worker Survivor Effect.Mathe- matical Modelling. 1986;7:1393–1512
1986
-
[31]
Implementation of G-Computation on a Sim- ulated Data Set: Demonstration of a Causal Inference Technique.Am J Epidemiol
Snowden JM, Rose S, and Mortimer KM. Implementation of G-Computation on a Sim- ulated Data Set: Demonstration of a Causal Inference Technique.Am J Epidemiol. 2011; 173:731–738
2011
-
[32]
Can Confidence Intervals Be Interpreted?American journal of epidemiology
Naimi AI and Whitcomb BW. Can Confidence Intervals Be Interpreted?American journal of epidemiology. 2020;189:631–633
2020
-
[33]
Estimating predicted probabilities from logistic regression: Different methods correspond to different target populations.Int J Epidemiol
Muller CJ and MacLehose RF. Estimating predicted probabilities from logistic regression: Different methods correspond to different target populations.Int J Epidemiol. 2014;43:962– 970
2014
-
[34]
M-estimation for common epidemiolog- ical measures: Introduction and applied examples.International Journal of Epidemiology
Ross RK, Zivich PN, Stringer JSA, and Cole SR. M-estimation for common epidemiolog- ical measures: Introduction and applied examples.International Journal of Epidemiology. 2024;53:dyae030
2024
-
[35]
Targeted maximum likelihood estimation for a binary treatment: A tutorial.Statistics in Medicine
Luque-Fernandez MA, Schomaker M, Rachet B, and Schnitzer ME. Targeted maximum likelihood estimation for a binary treatment: A tutorial.Statistics in Medicine. 2018; 37:2530–2546
2018
-
[36]
Machine Learning and Causal Inference
Zivich PN, Breskin A, and Kennedy EH. Machine Learning and Causal Inference. In: Wiley StatsRef: Statistics Reference Online. John Wiley & Sons, Ltd. 2022; 1–8
2022
-
[37]
Revisiting g-estimation of the Effect of a Time-varying Exposure Subject to Time-varying Confounding.Epidemiologic Methods
Vansteelandt S and Sjolander A. Revisiting g-estimation of the Effect of a Time-varying Exposure Subject to Time-varying Confounding.Epidemiologic Methods. 2016;5:37–56
2016
-
[38]
Reflection on modern methods: Demystifying robust standard errors for epidemiologists.International journal of epidemiology
Mansournia MA, Nazemipour M, Naimi AI, Collins GS, and Campbell MJ. Reflection on modern methods: Demystifying robust standard errors for epidemiologists.International journal of epidemiology. 2021;50:346–351. 20
2021
-
[39]
Pseudo-random Number Generator Influences on Av- erage Treatment Effect Estimates Obtained with Machine Learning.Epidemiology (Cam- bridge, Mass)
Naimi AI, Yu YH, and Bodnar LM. Pseudo-random Number Generator Influences on Av- erage Treatment Effect Estimates Obtained with Machine Learning.Epidemiology (Cam- bridge, Mass). 2024;35:779–786
2024
-
[40]
Estimating Representative Causal Effects with Double Machine Learn- ing.arXiv preprint arXiv:250607462
Lal A and Chou W. Estimating Representative Causal Effects with Double Machine Learn- ing.arXiv preprint arXiv:250607462. 2026; Version 3
2026
-
[41]
Quasi-oracle estimation of heterogeneous treatment effects
Nie X and Wager S. Quasi-oracle estimation of heterogeneous treatment effects. Biometrika. 2021;108:299–319
2021
-
[42]
Towards optimal doubly robust estimation of heterogeneous causal effects
Kennedy EH. Towards optimal doubly robust estimation of heterogeneous causal effects. Electronic Journal of Statistics. 2023;17:3008–3049
2023
-
[43]
Toward the elimination of race-based medicine: Replace race with racism as preeclampsia risk factor.American Journal of Obstetrics and Gynecology
Ukoha EP , Snavely ME, Hahn MU, Steinauer JE, and Bryant AS. Toward the elimination of race-based medicine: Replace race with racism as preeclampsia risk factor.American Journal of Obstetrics and Gynecology. 2022;227:593–596
2022
-
[44]
2015;212:539.e1–539.e24
Haas DM, Parker CB, Wing DAet al.A description of the methods of the Nulliparous Pregnancy Outcomes Study: Monitoring mothers-to-be (nuMoM2b).Am J Obstet Gynecol. 2015;212:539.e1–539.e24
2015
-
[45]
2013;3:11–20
Walker AM, Patrick AR, Lauer MSet al.A tool for assessing the feasibility of comparative effectiveness research.Comparative Effectiveness Research. 2013;3:11–20
2013
-
[46]
"gaussian
Shams-White MM, Pannucci TE, Lerman JLet al.Healthy Eating Index-2020: Review and Update Process to Reflect the Dietary Guidelines for Americans,2020-2025.Journal of the Academy of Nutrition and Dietetics. 2023;123:1280–1288. 21 A Confounder Selection Participants self-reported sociodemographic characteristics including age, education, race / ethnicity, m...
2020
discussion (0)
Sign in with ORCID, Apple, or X to comment. Anyone can read and Pith papers without signing in.