REVIEW 4 major objections 6 minor 134 references
Diving into dangerous tides: The impact of galaxy cluster tidal environments on satellite galaxy mass densities
T0 review · 4 major / 6 minor · reviewed 2026-08-07 · deepseek-v4-flash
Pith's one-line read The paper claims that a satellite galaxy's mean stellar mass density records the tidal field of its host cluster, with a transition near half the virial radius.
desk verdict A genuinely useful density-distance result for cluster satellites, but the 'universal 0.5 Rvir transition' and the 'photometric probe of halo gravity' claim outrun what the analysis actually shows. read the letter →
The pith
A machine-rendered reading of the paper's core claim, the machinery that carries it, and where it could break.
The reading
What carries the argument
The load-bearing object is the moving average of the mean stellar mass density within twice the stellar half-mass radius, $\langle\bar{\rho}^{\star}_{2h_{\star}}\rangle(r)$, computed with a logarithmic filter over the satellite population. It is tied to the host through the Jacobi density identity $\bar{\rho}_J=|\tau|$, the condition that material remains bound only where the satellite's mean density exceeds the local tidal field magnitude, and through the relation $|\tau|\propto 1/r$ for a spherically symmetric host. Tidal stripping shrinks $h_{\star}$, raising the central stellar mass density, and the transition radius $\Re_{\star}$ is defined empirically either as the minimum of the moving average or as the zero of its radial derivative in the range $0.2<R/R_{\mathrm{vir}}<1$.
What would settle it
Measure $\Re_{\star}$ in a cluster whose tidal field is independently known from satellite kinematics or weak lensing, and compare it with the radius where that tidal field equals the initial stellar density scale assumed in the model; the claim fails if the photometric transition sits elsewhere or shifts when the satellite sample is changed.
Extended reading notes
Core claim
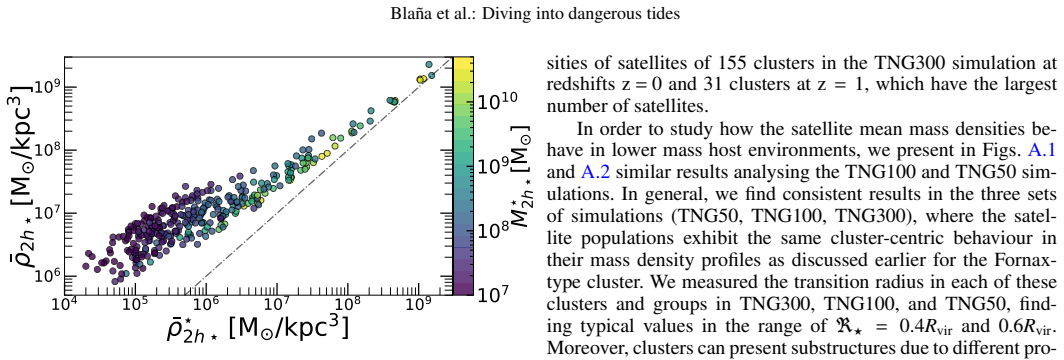
On its own terms, the paper's discovery is that the tidal truncation condition $\bar{\rho}_{\mathrm{tr}}\ge|\tau|$, which ties a satellite's bound mean density to the host tidal field magnitude, imprints a feature in the population-average stellar density profile. The moving average of $\bar{\rho}^{\star}_{2h_{\star}}$ declines gently from the virial radius inward, reaches a minimum at $\Re_{\star}\approx0.5\,R_{\mathrm{vir}}$, and then rises steeply toward the cluster centre, tracking the tidal field profile of an NFW-like host. The same feature appears in the idealized orbital model, in hydrodynamical cosmological simulations over a host mass range $10^{12}$–$10^{15.5}\,M_\odot$, and in all four observed systems, with projection lowering the measured radius by roughly 15%. The paper concludes that $\Re_{\star}$ marks the radius inside which the host tidal field has significantly processed stellar components and can serve as a photometric diagnostic of host gravitational field strength.
Load-bearing premise
The argument isolates the host tidal field only if satellites that have not yet been stripped have the same distribution of mean stellar mass densities in every environment; otherwise the radius where the host tidal field crosses that density scale is set partly by the satellites' initial structure, not by the host.
Editorial extensions
If this is right
- The $\bar{\rho}^{\star}-r$ transition can be measured from photometry alone, extending tidal-field studies to clusters beyond the Local Group where satellite orbits cannot be measured.
- Inside $\Re_{\star}$ the stellar components of surviving satellites have been tidally processed, so cluster-centric trends in galaxy size–mass relations must be interpreted with this trimming in mind.
- The consistent $0.4$–$0.6\,R_{\mathrm{vir}}$ location across host masses implies the feature can benchmark the virial radii of clusters and groups.
- The null-hypothesis test puts the joint chance of the observed transition appearing randomly in four systems near $2\times10^{-6}$, supporting the reality of the feature.
Reading between the lines
- A testable extension not in the paper: stack many clusters and compare the photometric $\Re_{\star}$ with a tidal field mapped independently by weak lensing or satellite kinematics; agreement would validate the method while disagreement would localize the assumption.
- Applying the same tracer to globular cluster systems, where internal kinematics are measurable in nearby galaxies, could calibrate the photometric diagnostic against dynamical tidal fields.
- If pre-infall mean stellar densities differ systematically between environments, $\Re_{\star}$ would no longer isolate host properties; comparing clusters with similar virial mass but different merger histories would expose this dependence.
Editorial analysis
A structured set of objections, weighed in public.
Referee Report
Summary. The paper argues that satellite galaxies' mean stellar mass densities anti-correlate with cluster-centric distance because tidal stripping removes low-density outer material, leaving denser remnants near cluster centres. Using a semi-analytical toy model, IllustrisTNG and EAGLE simulations, and observed satellite populations in Fornax, Virgo, the Milky Way, and Andromeda, the authors propose a 'transition radius' Rstar ≈ 0.5 R_vir, inside which the moving-average stellar density profile rises toward the centre. They present this as a photometric diagnostic for the host halo's gravitational field strength, supported by null-hypothesis tests claiming a combined ~5sigma detection.
Significance. If the central claim is robust, the proposed relation would be a valuable, purely photometric tool for probing the tidal fields and dark-matter distributions of galaxy clusters, where spectroscopic kinematics for many dwarf satellites are expensive or impossible. The paper has real strengths: it combines three complementary approaches, uses public cosmological simulations at multiple resolutions and with two different subgrid models, explicitly checks projection effects, sample completeness, mass segregation, and gas content, and performs a null-hypothesis shuffle test for the observed samples. The TNG/EAGLE simulation results are self-consistent and the Fornax/Virgo observations are suggestive. However, the toy model's transition radius is essentially set by the assumed pre-infall satellite density scale, and the observed values of Rstar/Rvir in Table 1 do not cluster tightly at 0.5, so the headline universality and the diagnostic calibration are not yet established at the level the abstract claims.
major comments (4)
- [Sect. 3.1, Eq. (4)] The toy-model transition radius is set by the assumed initial density scale, not determined independently by the host potential. Equation (4) starts stripping where the satellite's mean density equals |tau|; with the initial total mean densities drawn from a log-normal centered at rho_tr,init = 2e5 M_sun kpc^-3, the location where the moving-average density profile rises is largely determined by that adopted centre and by the host profile. The text says 'tested different initial conditions (IC) as well' but reports no quantitative result for how Rstar shifts. This is load-bearing because the proposed photometric diagnostic requires Rstar to map to |tau| without knowing the pre-infall density distribution; the paper should quantify the shift in Rstar for a factor-of-two variation in the log-normal centre, or explicitly restrict the diagnostic to differential trends within a single population.
- [Table 1 and Sect. 5.1] The measurements reported do not support a universal value Rstar ≈ 0.5 R_vir as stated in the abstract. The observed values are Fornax [ii] = 0.36 R_vir, Virgo [ii] = 0.39 R_vir, MW [i] = 0.36 R_vir versus [ii] = 0.54 R_vir, and M31 [i]/[ii] = 0.49/0.46 R_vir, while the simulated values span roughly 0.40-0.58 R_vir depending on simulation and projection. The Fornax and Virgo offsets from 0.5 R_vir are much larger than the quoted bootstrap uncertainties, and the two metrics for the Milky Way differ by 40 kpc, suggesting systematics not captured by those uncertainties. The abstract and conclusions should state the measured range and the dominant systematic uncertainties rather than presenting a single 0.5 R_vir value.
- [Sects. 4.3 and 5.2] The observational comparison cannot currently distinguish a host-tidal-field calibration from environmental differences in pre-infall satellite structure. The observed samples provide no measurement of the pre-infall mean stellar mass density distribution for Virgo, Fornax, the MW, or M31, so the assumption that the toy-model initial log-normal is universal across these environments is untested. The null-hypothesis test demonstrates that the Fornax and Virgo moving-average minima are unlikely to be random (p = 4% and 0.1%), but it does not test whether the radius of the minimum is determined by the host tidal field rather than by the satellites' initial density structure. This caveat should be stated explicitly, or the authors should use the simulations to split satellite populations by infall density and show that Rstar/R_vir remains unchanged.
- [Sect. 5.2, Conclusions item IV] The composite significance statement should be qualified. The individual p_NH values are 4% (Fornax), 0.1% (Virgo), 17% (MW), and 26% (M31), so the MW and M31 samples are individually consistent with the null hypothesis at the usual significance levels. The combined probability 1.8e-6 is dominated by Virgo, and the paper does not justify treating the four environments as independent, equally powered tests of the same null hypothesis. I recommend reporting the four individual p-values and the combined statistic with its assumptions, and avoiding the unqualified phrase 'highly significant' for the full observed sample.
minor comments (6)
- [Introduction, first paragraph] There is a typo: 'ellitpical' should be 'elliptical'.
- [Eq. (17)] The moving-average definition sums over j = -q/2 to +q/2 but does not specify how bins near the radial boundaries are treated; please clarify the boundary convention.
- [Table 1] For reproducibility, please list the adopted virial radius for each system directly in the table (or in a machine-readable footnote) and give Rstar/R_vir with the same asymmetric uncertainties as the kpc values.
- [Sect. 5.1, Eq. (20)] The polynomial order 7 is described as 'optimized,' but no optimization criterion or sensitivity test is given; please state the criterion and show that the measured Rstar is stable for polynomial orders 5-9.
- [Captions of Figs. 4, A.1, A.2] The phrase 'All are moving averages are calculated' should read 'All moving averages are calculated.'
- [Global] A data/code availability statement is missing; the paper relies on public simulations and catalogs, but the delorean orbital code and the analysis scripts used to produce Rstar are not linked to a repository or version.
Circularity Check
No significant circularity: the toy-model transition radius depends on the adopted initial density scale, but this is an explicit modelling caveat; the central claim is independently corroborated by self-consistent TNG simulations and null-hypothesis tests.
full rationale
The paper's derivation chain starts from the standard Jacobi/tidal-truncation criterion (Eqs. 1-5) and builds a toy model whose initial mean density scale is chosen in Sect. 3.1 (log-normal centred at 2e5 Msun/kpc3). The toy model's upturn radius is indeed set by the crossing of |tau(r)| with that input scale, so it is not an independent calibration of Re_star. However, this is not a case of fitting the target quantity: the initial conditions are motivated by external simulations and observations and are explicitly listed as one of three interlocking factors (Summary point VI). The load-bearing evidence for Re_star ~ 0.5 Rvir comes from IllustrisTNG50/100/300 and EAGLE, where satellite densities and infall histories emerge self-consistently without an assumed initial density distribution, and from the observed Virgo/Fornax/Local Group samples with the null-hypothesis test giving a joint probability of about 2e-6 (Sect. 5.2). No parameter is fitted to Re_star; the two metrics (Eqs. 19-20) are defined a priori and applied consistently. The paper's own caveat that the satellites' initial mass densities matter means the photometric-diagnostic claim has a robustness limitation, but that limitation is not a circular reduction of the derivation to its inputs. The only related gap is the unquantified statement 'tested different initial conditions (IC) as well' in Sect. 3.1; this is a robustness issue, not a circular step. Self-citations (delorean code, M31 mass models) are instrumental only and are not load-bearing for the main result.
Assumptions & free parameters
free parameters (5)
- Initial mean total mass density scale (toy model) =
2×10^5 M⊙/kpc^3, log-normal σ=0.1 dex
- Satellite initial scale length =
10% of initial truncation radius
- Stellar mass-to-light ratio =
Υ_r = 2 M⊙/L⊙ (tested 1-4)
- Moving-average neighbour number q =
q = sqrt(n_sat) (observations), 2sqrt(n_sat) (toy model)
- Polynomial order for metric [ii] =
7
assumptions (5)
- domain assumption Jacobi radius criterion: ρ̄_tr ≥ |τ| for bound material
- domain assumption Spherically symmetric host potential and isotropic satellite orbits in the toy model
- domain assumption Host potential evolves slowly and satellite orbits are phase-mixed so that current cluster-centric distance correlates with pericentre (r ∝ r_peri)
- domain assumption Constant mass-to-light ratio for observed satellites
- standard math Deprojection of effective radii with r_e = 4/3 R_e
Cite this review
Pith. "Pith review of Diving into dangerous tides: The impact of galaxy cluster tidal environments on satellite galaxy mass densities." pith.science (2026). https://pith.science/paper/MC6QDV65
@misc{pith2026250521713,
  author       = {Pith},
  title        = {Pith review of: Diving into dangerous tides: The impact of galaxy cluster tidal environments on satellite galaxy mass densities},
  year         = {2026},
  howpublished = {\url{https://pith.science/paper/MC6QDV65}},
  note         = {Machine review of arXiv:2505.21713}
}
abstract
Satellite galaxies endure powerful environmental tidal forces that drive mass stripping of their outer regions. Consequently, satellites located in central regions of galaxy clusters or groups, where the tidal field is strongest, are expected to retain their central dense regions while losing their outskirts. This process produces a spatial segregation in the mean mass density with the cluster-centric distance (the $\bar{\rho}-r$ relation). To test this hypothesis, we combined semi-analytical satellite orbital models with cosmological galaxy simulations. We find that not only the mean total mass densities ($\bar{\rho}$), but also the mean stellar mass densities ($\bar{\rho}^{\star}$) of satellites exhibit this distance-dependent segregation ($\bar{\rho}^{\star}-r$). The correlation traces the host's tidal field out to a characteristic transition radius at $\Re_{\star}$ $\approx$ $0.5$ $R_{\rm vir}$, beyond which the satellite population's density profile can have a slight increase or remain flat, reflecting the weakened tidal influence in the outskirts of galaxy clusters and beyond. We compare these predictions with observational data from satellites in the Virgo and Fornax galaxy clusters, as well as the Andromeda and Milky Way systems. Consistent trends in the satellite mean stellar mass densities are observed across these environments. Furthermore, the transition radius serves as a photometric diagnostic tool: it identifies regions where the stellar components of satellites underwent significant tidal processing and probes the gravitational field strength of the host halo.
Figures


Figures from the paper (8 more)


Reference graph
Works this paper leans on
-
[1]
K., Prochaska, J
Armillotta, L., Fraternali, F., Werk, J. K., Prochaska, J. X., & Marinacci, F. 2017, MNRAS, 470, 114
2017
-
[2]
2022, MNRAS, 515, 2981
Asencio, E., Banik, I., Mieske, S., et al. 2022, MNRAS, 515, 2981
2022
-
[3]
Aung, H., Nagai, D., & Lau, E. T. 2021, MNRAS, 508, 2071
2021
-
[4]
& Merrifield, M
Binney, J. & Merrifield, M. 1998, Galactic astronomy / James Binney and Michael Merrifield. Princeton, NJ : Princeton University Press, 1998. (Princeton series in astrophysics) QB857 .B522 1998 ( \ 35.00)
1998
-
[5]
P., Jord \' a n, A., Mei, S., et al
Blakeslee, J. P., Jord \' a n, A., Mei, S., et al. 2009, ApJ, 694, 556
2009
-
[6]
2024, A & A, 692, A183
Bla \ n a, M., Burkert, A., Fellhauer, M., et al. 2024, A & A, 692, A183
2024
-
[7]
2020, MNRAS, 497, 3601
Bla \ n a, M., Burkert, A., Fellhauer, M., Schartmann, M., & Alig, C. 2020, MNRAS, 497, 3601
2020
-
[8]
2015, MNRAS, 446, 144
Bla \ n a, M., Fellhauer, M., Smith, R., et al. 2015, MNRAS, 446, 144
2015
Show all 134 references
-
[9]
2018, MNRAS, 481, 3210
Bla \ n a, M., Gerhard, O., Wegg, C., et al. 2018, MNRAS, 481, 3210
2018
-
[10]
2017, MNRAS, 466, stw3294
Bla \ n a, M., Wegg, C., Gerhard, O., et al. 2017, MNRAS, 466, stw3294
2017
-
[11]
& Gerhard, O
Bland-Hawthorn, J. & Gerhard, O. 2016, ARA & A, 54, 529
2016
-
[12]
2022, A & AR, 30, 3
Boselli, A., Fossati, M., & Sun, M. 2022, A & AR, 30, 3
2022
-
[13]
& Gavazzi, G
Boselli, A. & Gavazzi, G. 2006, PASP, 118, 517
2006
-
[14]
2000, ApJ, 534, L143
Burkert, A. 2000, ApJ, 534, L143
2000
-
[15]
A., Gieles, M., Sollima, A., et al
Carballo-Bello, J. A., Gieles, M., Sollima, A., et al. 2012, MNRAS, 419, 14
2012
-
[16]
2023, MNRAS, 522, 3058
Cardona-Barrero, S., Battaglia, G., Nipoti, C., & Di Cintio , A. 2023, MNRAS, 522, 3058
2023
-
[17]
& Hayes, M
Chamba, N. & Hayes, M. J. 2024, A & A, 689, A28
2024
-
[18]
H., Kenney, J
Chung, A., van Gorkom, J. H., Kenney, J. D. P., Crowl, H., & Vollmer, B. 2009, AJ, 138, 1741
2009
-
[19]
A., Stuart, J., Wyithe, B., Schaye, J., & Duffy, A
Correa, C. A., Stuart, J., Wyithe, B., Schaye, J., & Duffy, A. R. 2015, MNRAS, 452, 1217
2015
-
[20]
S., et al
Davis, M., Efstathiou, G., Frenk, C. S., et al. 1985, ApJ, 292, 371
1985
-
[21]
2003, MNRAS, 341, 326
Dekel, A., Devor, J., & Hetzroni, G. 2003, MNRAS, 341, 326
2003
-
[22]
L., Parker, L
Demers, M. L., Parker, L. C., & Roberts, I. D. 2019, MNRAS, 489, 2216
2019
-
[23]
2021, ApJ, 909, 112
Diemer, B. 2021, ApJ, 909, 112
2021
-
[24]
& Davis, M
Djorgovski, S. & Davis, M. 1987, ApJ, 313, 59
1987
-
[25]
2009, MNRAS, 399, 497
Dolag, K., Borgani, S., Murante, G., & Springel, V. 2009, MNRAS, 399, 497
2009
-
[26]
2018, MNRAS, 485, 4817
Donnari, M., Pillepich, A., Nelson, D., et al. 2018, MNRAS, 485, 4817
2018
-
[27]
1980, ApJ, 236, 351
Dressler, A. 1980, ApJ, 236, 351
1980
-
[28]
J., Gregg, M
Drinkwater, M. J., Gregg, M. D., & Colless, M. 2001, ApJ, 548, L139
2001
-
[29]
H., Taylor, M
Eigenthaler, P., Puzia, T. H., Taylor, M. A., et al. 2018, ApJ, 855, 142
2018
-
[30]
2016, ApJ, 826, 13
Emerick, A., Mac Low , M.-M., Grcevich, J., & Gatto, A. 2016, ApJ, 826, 13
2016
-
[31]
& Navarro, J
Errani, R. & Navarro, J. F. 2021, MNRAS, 505, 18
2021
-
[32]
F., Ibata, R., & Pe \ n arrubia, J
Errani, R., Navarro, J. F., Ibata, R., & Pe \ n arrubia, J. 2022, MNRAS, 511, 6001
2022
-
[33]
F., Pe \ n arrubia, J., Famaey, B., & Ibata, R
Errani, R., Navarro, J. F., Pe \ n arrubia, J., Famaey, B., & Ibata, R. 2023, MNRAS, 519, 384
2023
-
[34]
Faerman, Y., Sternberg, A., & McKee, C. F. 2013, ApJ, 777, 14
2013
-
[35]
M., Bettoni, D., et al
Fasano, G., Poggianti, B. M., Bettoni, D., et al. 2015, MNRAS, 449, 3927
2015
-
[36]
W., et al
Fellhauer, M., Belokurov, V., Evans, N. W., et al. 2006 a , ApJ, 651, 167
2006
-
[37]
W., Belokurov, V., et al
Fellhauer, M., Evans, N. W., Belokurov, V., et al. 2006 b , MNRAS, 375, 1171
2006
-
[38]
I., Evans, N
Fellhauer, M., Wilkinson, M. I., Evans, N. W., et al. 2008, MNRAS, 385, 1095
2008
-
[39]
C., et al
Ferrarese, L., C \^ o t \' e , P., Cuillandre, J. C., et al. 2012, ApJS, 200, 4
2012
-
[40]
S., & Lee, K
Garrison-Kimmel, S., Boylan-Kolchin, M., Bullock, J. S., & Lee, K. 2014, MNRAS, 438, 2578
2014
-
[41]
C., & Zhao, H
Gieles, M., Heggie, D. C., & Zhao, H. 2011, MNRAS, 413, 2509
2011
-
[42]
Gill, S. P. D., Knebe, A., & Gibson, B. K. 2005, MNRAS, 356, 1327
2005
-
[43]
Gnedin, O. Y. 2003, ApJ, 582, 141
2003
-
[44]
E., Gott, J
Gunn, J. E., Gott, J. Richard, I., Gunn, J. E., & Gott, J. Richard, I. 1972, ApJ, 176, 1
1972
-
[45]
E., Pearce, F
Haggar, R., Gray, M. E., Pearce, F. R., et al. 2020, MNRAS, 492, 6074
2020
-
[46]
A., et al
Hammer, F., Li, H., Mamon, G. A., et al. 2023, MNRAS, 519, 5059
2023
-
[47]
A., et al
Hammer, F., Wang, J., Mamon, G. A., et al. 2024, MNRAS, 527, 2718
2024
-
[48]
2020, ApJ, 904, 45
Hayashi, K., Chiba, M., & Ishiyama, T. 2020, ApJ, 904, 45
2020
-
[49]
2022, MNRAS, 000, 1
Herzog, G., Benitez-Llambay, A., & Fumagalli, M. 2022, MNRAS, 000, 1
2022
-
[50]
D., Pillepich, A., Nelson, D., et al
Joshi, G. D., Pillepich, A., Nelson, D., et al. 2020, MNRAS, 496, 2673
2020
-
[51]
Kaplinghat, M., Valli, M., & Yu, H. B. 2019, MNRAS, 490, 231
2019
-
[52]
M., White, S
Kauffmann, G., Heckman, T. M., White, S. D., et al. 2003 a , MNRAS, 341, 33
2003
-
[53]
M., White, S
Kauffmann, G., Heckman, T. M., White, S. D. M., et al. 2003 b , MNRAS, 341, 54
2003
-
[54]
C., Jerjen, H., et al
Kim, S., Rey, S. C., Jerjen, H., et al. 2015, ApJS, 215, 22
2015
-
[55]
M., et al
Kleiner, D., Serra, P., MacCagni, F. M., et al. 2023, A & A, 675, A108
2023
-
[56]
Kormendy, J. & Ho, L. C. 2013, ARA & A, 51, 511
2013
-
[57]
2022, MNRAS, 510, 581
Kuchner, U., Haggar, R., Arag \' o n-Salamanca, A., et al. 2022, MNRAS, 510, 581
2022
-
[58]
2017, A & A, 604, A54
Kuchner, U., Ziegler, B., Verdugo, M., Bamford, S., & H \" a u ler, B. 2017, A & A, 604, A54
2017
-
[59]
okas, E. L. 2023, A & A, 673, A131
2023
-
[60]
2021, A & A, 648, A31
Loni, A., Serra, P., Kleiner, D., et al. 2021, A & A, 648, A31
2021
-
[61]
2019, MNRAS, 488, 5370
Lotz, M., Remus, R.-S., Dolag, K., et al. 2019, MNRAS, 488, 5370
2019
-
[62]
2018, MNRAS, 480, 5113
Marinacci, F., Vogelsberger, M., Pakmor, R., et al. 2018, MNRAS, 480, 5113
2018
-
[63]
2007, American Journal of Physics, 75, 116
Masi, M. 2007, American Journal of Physics, 75, 116
2007
-
[64]
B., et al
Matharu, J., Muzzin, A., Brammer, G. B., et al. 2019, MNRAS, 484, 595
2019
-
[65]
C., Schaller, M., et al
McAlpine, S., Helly, J. C., Schaller, M., et al. 2016, Astronomy and Computing, 15, 72
2016
-
[66]
W., Higgs, C
McConnachie, A. W., Higgs, C. R., Thomas, G. F., et al. 2020, MNRAS, 501, 2363
2020
-
[67]
McConnachie, A. W. & Venn, K. A. 2020, AJ, 160, 124
2020
-
[68]
L., Balogh, M
McGee, S. L., Balogh, M. L., Bower, R. G., Font, A. S., & McCarthy, I. G. 2009, MNRAS, 400, 937
2009
-
[69]
McLaughlin, D. E. 1999, ApJ, 512, L9
1999
-
[70]
2007, ApJ, 655, 144
Mei, S., Blakeslee, J., Cote, P., et al. 2007, ApJ, 655, 144
2007
-
[71]
1983, ApJ, 264, 24
Merritt, D. 1983, ApJ, 264, 24
1983
-
[72]
1984, ApJ, 276, 26
Merritt, D. 1984, ApJ, 276, 26
1984
-
[73]
1985, ApJ, 289, 18
Merritt, D. 1985, ApJ, 289, 18
1985
-
[74]
C., & White, S
Mo, H., van den Bosch, F. C., & White, S. 2010, Galaxy Formation and Evolution, by Houjun Mo , Frank van den Bosch , Simon White, Cambridge, UK: Cambridge University Press, 2010
2010
-
[75]
D., Rodriguez, F., Artale, M
Montero-Dorta, A. D., Rodriguez, F., Artale, M. C., Smith, R., & Chaves-Montero, J. 2024, MNRAS, 527, 5868
2024
-
[76]
& Burkert, A
Mori, M. & Burkert, A. 2000, ApJ, 538, 559
2000
-
[77]
P., Naab, T., White, S
Moster, B. P., Naab, T., White, S. D. M., et al. 2013, MNRAS, 428, 3121
2013
-
[78]
P., Eigenthaler, P., Puzia, T
Mu \ n oz, R. P., Eigenthaler, P., Puzia, T. H., et al. 2015, ApJ, 813, L15
2015
-
[79]
P., Pillepich, A., Springel, V., et al
Naiman, J. P., Pillepich, A., Springel, V., et al. 2018, MNRAS, 477, 1206
2018
-
[80]
F., Frenk, C
Navarro, J. F., Frenk, C. S., & White, S. D. M. 1996, ApJ, 462, 563
1996
-
[81]
2019, MNRAS, 490, 3234
Nelson, D., Pillepich, A., Springel, V., et al. 2019, MNRAS, 490, 3234
2019
-
[82]
2018, MNRAS, 475, 624
Nelson, D., Pillepich, A., Springel, V., et al. 2018, MNRAS, 475, 624
2018
-
[83]
2018, MNRAS, 480, L106
Ogiya, G. 2018, MNRAS, 480, L106
2018
-
[84]
C., & Burkert, A
Ogiya, G., Van Den Bosch , F. C., & Burkert, A. 2022 a , MNRAS, 510, 2724
2022
-
[85]
C., Burkert, A., & Kang, X
Ogiya, G., van den Bosch, F. C., Burkert, A., & Kang, X. 2022 b , ApJL, 940, L46
2022
-
[86]
J., Vogelsberger, M., & Diemer, B
O'Neil, S., Barnes, D. J., Vogelsberger, M., & Diemer, B. 2021, MNRAS, 504, 4649
2021
-
[87]
A., et al
Ordenes-Brice \ n o, Y., Eigenthaler, P., Taylor, M. A., et al. 2018 a , ApJ, 859, 52
2018
-
[88]
H., Eigenthaler, P., et al
Ordenes-Brice \ n o, Y., Puzia, T. H., Eigenthaler, P., et al. 2018 b , ApJ, 860, 4
2018
-
[89]
B., Erkal, D., & Li, T
Pace, A. B., Erkal, D., & Li, T. S. 2022, ApJ, 940, 136
2022
-
[90]
A., Padilla, N
Pallero, D., G \' o mez, F. A., Padilla, N. D., et al. 2022, MNRAS, 511, 3210
2022
-
[91]
A., Padilla, N
Pallero, D., G \' o mez, F. A., Padilla, N. D., et al. 2019, MNRAS, 488, 847
2019
-
[92]
F., & McConnachie, A
Penarrubia, J., Navarro, J. F., & McConnachie, A. W. 2008, ApJ, 673, 226
2008
-
[93]
J., Kova c , K., et al
Peng, Y.-j., Lilly, S. J., Kova c , K., et al. 2010, ApJ, 721, 193
2010
-
[94]
2018, MNRAS, 475, 648
Pillepich, A., Nelson, D., Hernquist, L., et al. 2018, MNRAS, 475, 648
2018
-
[95]
2019, MNRAS, 490, 3196
Pillepich, A., Nelson, D., Springel, V., et al. 2019, MNRAS, 490, 3196
2019
-
[96]
E., Zheng, Y., Price-Whelan, A
Putman, M. E., Zheng, Y., Price-Whelan, A. M., et al. 2021, ApJ, 913, 53
2021
-
[97]
H., Paolillo, M., Goudfrooij, P., et al
Puzia, T. H., Paolillo, M., Goudfrooij, P., et al. 2014, ApJ, 786, 78
2014
-
[98]
I., Walker, M
Read, J. I., Walker, M. G., & Steger, P. 2019, MNRAS, 484, 1401
2019
-
[99]
I., Wilkinson, M
Read, J. I., Wilkinson, M. I., Evans, N. W., Gilmore, G., & Kleyna, J. T. 2006 a , MNRAS, 367, 387
2006
-
[100]
I., Wilkinson, M
Read, J. I., Wilkinson, M. I., Evans, N. W., et al. 2006 b , MNRAS, 366, 429
2006
-
[101]
2009, ApJ, 706, 67
Renaud, F., Boily, C., Naab, T., & Theis, C. 2009, ApJ, 706, 67
2009
-
[102]
2017, ApJ, 843, 128
Rhee, J., Smith, R., Choi, H., et al. 2017, ApJ, 843, 128
2017
-
[103]
D., Parker, L
Roberts, I. D., Parker, L. C., Brown, T., et al. 2019, ApJ, 873, 42
2019
-
[104]
Robles, V. H. & Bullock, J. S. 2021, MNRAS, 503, 5232
2021
-
[105]
D., et al
Rodr \' i guez, S., Garcia Lambas , D., Padilla, N. D., et al. 2022, MNRAS, 514, 6157
2022
-
[106]
P., Opitsch, M., Erwin, P., et al
Saglia, R. P., Opitsch, M., Erwin, P., et al. 2016, ApJ, 818, 69
2016
-
[107]
A., Bower, R
Schaye, J., Crain, R. A., Bower, R. G., et al. 2015, MNRAS, 446, 521
2015
-
[108]
2010, A & A, 513, A52
Schuberth, Y., Richtler, T., Hilker, M., et al. 2010, A & A, 513, A52
2010
-
[109]
M., Murray, N., et al
Shen, J., Eadie, G. M., Murray, N., et al. 2022, ApJ, 925, 1
2022
-
[110]
2022, AJ, 164, 95
Smith, R., Calder \' o n-Castillo, P., Shin, J., Raouf, M., & Ko, J. 2022, AJ, 164, 95
2022
-
[111]
2016, ApJ, 833, 109
Smith, R., Choi, H., Lee, J., et al. 2016, ApJ, 833, 109
2016
-
[112]
N., et al
Smith, R., Fellhauer, M., Candlish, G. N., et al. 2013, MNRAS, 433, 2529
2013
-
[113]
2020, A & A, 639, A14
Spavone, M., Iodice, E., Van De Ven , G., et al. 2020, A & A, 639, A14
2020
-
[114]
2018, MNRAS, 475, 676
Springel, V., Pakmor, R., Pillepich, A., et al. 2018, MNRAS, 475, 676
2018
-
[115]
Springel, V., Yoshida, N., & White, S. D. 2001, New Astronomy, 6, 79
2001
-
[116]
E., Aguirre-Santaella, A., & S \' a nchez-Conde, M
St \" u cker, J., Ogiya, G., Angulo, R. E., Aguirre-Santaella, A., & S \' a nchez-Conde, M. A. 2023, MNRAS, 521, 4432
2023
-
[117]
2012, A & A, 546, A4
Tamm, a., Tempel, E., Tenjes, P., Tihhonova, O., & Tuvikene, T. 2012, A & A, 546, A4
2012
-
[118]
Tempel, E., Tuvikene, T., Kipper, R., & Libeskind, N. I. 2017, A & A, 602, A100
2017
-
[119]
V., & Kuhlen, M
Teyssier, M., Johnston, K. V., & Kuhlen, M. 2012, MNRAS, 426, 1808
2012
-
[120]
2019, ApJ, 874, 161
Tonnesen, S. 2019, ApJ, 874, 161
2019
-
[121]
& Bryan, G
Tonnesen, S. & Bryan, G. L. 2021, ApJ, 911, 68
2021
-
[122]
& Toomre, J
Toomre, A. & Toomre, J. 1972, ApJ, 178, 623
1972
-
[123]
1993, ApJ, 408, 57
Valluri, M. 1993, ApJ, 408, 57
1993
-
[124]
van den Bosch, F. C. & Ogiya, G. 2018, MNRAS, 475, 4066
2018
-
[125]
C., Ogiya, G., Hahn, O., & Burkert, A
van den Bosch, F. C., Ogiya, G., Hahn, O., & Burkert, A. 2018, MNRAS, 474, 3043
2018
-
[126]
2019, A & A, 625, A143
Venhola, A., Peletier, R., Laurikainen, E., et al. 2019, A & A, 625, A143
2019
-
[127]
J., Harris, W
Webb, J. J., Harris, W. E., Sills, A., & Hurley, J. R. 2013, ApJ, 764, 124
2013
-
[128]
Wetzel, A. R. 2011, MNRAS, 412, 49
2011
-
[129]
R., Tinker, J
Wetzel, A. R., Tinker, J. L., Conroy, C., & van den Bosch, F. C. 2013, MNRAS, 432, 336
2013
-
[130]
White, S. D. M. & Rees, M. J. 1978, MNRAS, 183, 341
1978
-
[131]
D., Bullock, J
Wolf, J., Martinez, G. D., Bullock, J. S., et al. 2010, MNRAS, 406, 1220
2010
-
[132]
Yoon, H., Chung, A., Smith, R., & Jaff \' e , Y. L. 2017, ApJ, 838, 81
2017
-
[133]
, " * write output.state after.block = add.period write newline
ENTRY address archiveprefix author booktitle chapter edition editor howpublished institution eprint journal key month note number organization pages publisher school series title type volume year label extra.label sort.label short.list INTEGERS output.state before.all mid.sent...
-
[134]
write newline
" write newline "" before.all 'output.state := FUNCTION n.dashify 't := "" t empty not t #1 #1 substring "-" = t #1 #2 substring "--" = not "--" * t #2 global.max substring 't := t #1 #1 substring "-" = "-" * t #2 global.max substring 't := while if t #1 #1 substring * t #2 gl...
Reviewed August 7, 2026 · model on record in the stance chip above.
Discussion (0). Sign in to comment.