REVIEW 3 major objections 5 minor 30 references
Flame-wall interaction of thermodiffusively unstable hydrogen/air flames -- Part II: Parametric variations of equivalence ratio, temperature, and pressure
T0 review · 3 major / 5 minor · reviewed 2026-08-12 · deepseek-v4-flash
Pith's one-line read Thermodiffusive instabilities, not hydrodynamic ones, drive the enhanced wall heat flux and shorter quenching distance in hydrogen/air flames, and the enhancement scales linearly with the reactivity factor I0 across all tested operating…
desk verdict A solid, useful parametric extension of Part I; the qualitative conclusions hold, but the quantitative correlation is a same-data linear fit atop single-realization statistics and needs a convergence/out-of-sample check before it is used as a predictive model. read the letter →
The pith
A machine-rendered reading of the paper's core claim, the machinery that carries it, and where it could break.
The reading
What carries the argument
The load-bearing object is the reactivity factor $I_0 = (s_c/s_l)/(A/L_y)$, the ratio of the normalized consumption speed to the normalized flame-surface length. It isolates the local enhancement of flame reactivity caused by thermodiffusive instabilities, separating it from the purely geometric surface-area increase that hydrodynamic instabilities also produce. The argument's other pillar is the ratio $\mathrm{Ze}/\mathrm{Pe}_{cd}$ formed from the Zeldovich number (flame sensitivity to temperature) and the convection-diffusion Péclet number (balance of convective and diffusive transport), taken from one-dimensional freely propagating flames. The two linear fits—$I_0$ against $\mathrm{Ze}/\mathrm{Pe}_{cd}$, and $\Phi_{q,2D}/\Phi_{q,1D}$ against $I_0$—are chained through a composition of linear functions, yielding a single estimate of wall-heat-flux enhancement from one-dimensional flame quantities. The simulations use a periodic two-dimensional domain of $100\delta_T^0 \times 100\delta_T^0$ with detailed hydrogen chemistry, and one-dimensional head-on quenching under identical conditions supplies the normalization.
What would settle it
Run several independent two-dimensional head-on quenching simulations for one high-pressure case (for example $p=10$ bar, $\phi=0.5$, $T_u=298$ K) with different initial perturbation seeds and lateral domain sizes, and check whether the ensemble mean of $\Phi_{q,2D}/\Phi_{q,1D}$ still lies on the line $-1.16 + 2.07 I_0$; a deviation larger than the reported one-standard-deviation spread would undermine the proportionality claim.
Extended reading notes
Core claim
On the paper's own terms, the discovery is that when a hydrogen/air flame is intrinsically unstable and quenches head-on against a wall, the thermodiffusive part of the instability—not the hydrodynamic part—controls the thermal impact. For a given operating condition, the mean quenching wall heat flux of the two-dimensional unstable flame is enhanced relative to a one-dimensional stable flame by an amount that depends only on the reactivity factor $I_0$, which measures local enhancement of flame reactivity beyond what flame-surface wrinkling would produce. The data collapse onto the linear relation $\Phi_{q,2D}/\Phi_{q,1D} = -1.16 + 2.07 I_0$ over the whole parameter space, and $I_0$ itself is fit by $I_0 = 0.978 + 0.0115\,\mathrm{Ze}/\mathrm{Pe}_{cd}$ from one-dimensional freely propagating flame quantities. Combining the two gives a model $\Phi_{q,2D}/\Phi_{q,1D} = 0.864 + 0.0238\,\mathrm{Ze}/\mathrm{Pe}_{cd}$, meaning the peak wall heat load of an unstable flame can be estimated from one-dimensional flame data alone. The paper concludes that hydrodynamic instabilities leave the quenching characteristics essentially unchanged, while thermodiffusive instabilities can raise the mean wall heat flux by up to a factor of about three in the high-pressure lean cases.
Load-bearing premise
The quantitative conclusions rest on a single two-dimensional realization per operating condition; if the periodic domain under-samples the cellular structures of the instabilities, the reported mean ratios and linear fits could shift.
Editorial extensions
If this is right
- For lean hydrogen/air flames at low unburnt temperature and high pressure, one-dimensional head-on quenching simulations underestimate the mean wall heat flux; in the 10 bar, $\phi=0.5$, 298 K case the enhancement reaches about a factor of three.
- Hydrodynamic instabilities can be neglected when predicting mean quenching heat flux and quenching distance; the governing quantity is the thermodiffusive reactivity factor $I_0$.
- The relative wall-heat-flux increase follows $\Phi_{q,2D}/\Phi_{q,1D} = -1.16 + 2.07 I_0$ across all operating conditions examined.
- Because $I_0$ is itself modeled from one-dimensional flame quantities through $\mathrm{Ze}/\mathrm{Pe}_{cd}$, the combined model estimates combustor wall heat load without running a two-dimensional unstable-flame simulation.
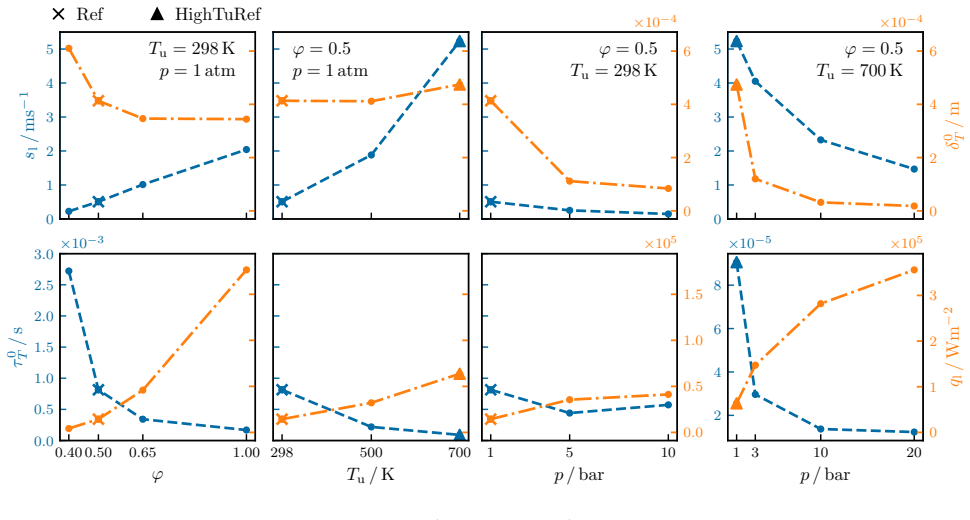
- Lower equivalence ratio, lower unburnt temperature, and higher pressure each intensify thermodiffusive instabilities and therefore increase the heat-flux enhancement relative to the one-dimensional baseline.
Reading between the lines
- A natural testable extension is to repeat the same quenching statistics in three dimensions; if 3D cellular dynamics redistribute wall heat flux differently, the 2D-derived slope and offset would need recalibration.
- The same $\mathrm{Ze}/\mathrm{Pe}_{cd}$ pathway may transfer to other low-Lewis-number fuels or hydrogen blends, but the fitted constants should be re-evaluated per fuel since they are empirical.
- The proportionality could be tested locally, not just on the mean, by conditioning local quenching wall heat flux on local flame curvature or local equivalence ratio; the paper presents PDF evidence but does not build a local model.
- The proposed model offers a cheap design-rule route: a one-dimensional flame calculation plus the fits gives an early estimate of whether a given operating point carries a thermal-load penalty before expensive multi-dimensional simulations are run.
Editorial analysis
A structured set of objections, weighed in public.
Referee Report
Summary. This paper extends Part I's single-condition study of flame-wall interaction of intrinsically unstable hydrogen/air flames to a parametric space of equivalence ratio (0.4–1.0), unburnt temperature (298–700 K), and pressure (1.01325–20 bar). One-dimensional head-on quenching (HOQ) simulations provide stable-flame baselines, and two-dimensional HOQ simulations capture the effects of thermodiffusive and hydrodynamic instabilities. The central claims are that thermodiffusive instabilities significantly increase the mean wall heat flux and reduce the mean quenching distance relative to one-dimensional stable flames, that hydrodynamic instabilities have negligible influence on quenching quantities, and that the relative increase in wall heat flux correlates linearly with the reactivity factor I0. A joint model (Eqs. 9–11) is proposed to estimate the heat-flux increase from one-dimensional flame quantities, namely the Zeldovich number and the convection-diffusion Péclet number.
Significance. If the quantitative model holds beyond the fitted dataset, it would be a practically valuable tool for estimating wall thermal loads in hydrogen combustion systems from inexpensive one-dimensional simulations. The paper contributes a broad, detailed DNS dataset that is otherwise scarce in the literature, and the qualitative picture—thermodiffusive instability intensity controls the heat-flux enhancement while hydrodynamic instability does not—is convincingly supported by the PDFs, spatial profiles, and the contrast between the Tu700 and p10 cases. The explicit use of one-dimensional reference flames for normalization is a strength. However, the quantitative model currently rests on in-sample fits with no uncertainty quantification or out-of-sample validation, so the predictive claim is not yet established to the standard required for a modeling paper.
major comments (3)
- [§4.2, Eqs. (9)–(11)] The model coefficients a, b, c, d (and hence e, f) are fitted to the same dataset used to demonstrate agreement. The I0 values come from the freely propagating simulations and the heat-flux ratios come from the HOQ simulations, but both are generated at the same operating conditions and no independent validation is performed. Fig. 13 shows in-sample comparisons only, and no confidence intervals or goodness-of-fit metrics (e.g., R² or RMS error) are reported. This is load-bearing because the abstract and Section 4.2 claim the model can 'estimate' the heat-flux increase. Please add an out-of-sample test (e.g., leave-one-condition-out cross-validation on the four parametric series) or otherwise demonstrate that the linear relationships are not artifacts of the particular set of operating conditions.
- [§2.1.2, Fig. 11] The mean and standard deviation of Φq,2D/Φq,1D are computed from a single 2D realization per operating condition on a periodic domain of Ly = Lx = 100δ_T. The ±1σ band in Fig. 11 is the spatial scatter along the wall, not an uncertainty of the mean; it does not quantify whether the periodic box contains enough instability cells for the spatial average to be statistically representative. The authors cite the domain-size study in Part I, but that was performed at a single operating condition, and the present paper does not provide a convergence check for the conditions where cell sizes and intensities change strongly (e.g., p10, phi0.4). If the spatial average is under-sampled, the data points in Fig. 12a shift, the fitted coefficients in Eqs. (9)–(11) change, and the claimed universal linear correlation is not established. Please include at least a representative convergence study (multiple domain sizes or realizations) for two or three conditions spanning the instability-intensity range, and report the resulting sensitivity of the fit coefficients.
- [§4.2, Fig. 12a] The claim that 'a linear relationship also holds across all operating conditions' is based on a visual fit with no reported uncertainty. The data set contains only ten operating conditions spanning three distinct parametric series, and the text does not report residuals or per-series slopes. Given that the two-step model in Eq. (11) is derived by composing two linear fits, any deviation from linearity in Fig. 12a or 12b propagates directly into the final model. Please quantify the fit quality (e.g., R², residual plots) and discuss whether the linear form is adequate across the full range of Ze/Pecld, rather than merely being the simplest two-parameter choice.
minor comments (5)
- [Abstract / Section 1] The abstract says 'a novel model fit is proposed' and the novelty statement repeats this; given that the fit is a linear correlation with no independent validation, the wording 'model fit' is appropriate but 'estimate' should be tempered to 'correlate' or 'suggest a predictive relationship' until out-of-sample performance is demonstrated.
- [§3.1] In the bullet on the pressure variation at Tu = 700 K, the text says 'the trends for the laminar flame speed and thermal flame thickness are similar to those at Tu = 700 K', which appears to be a typo; it should likely read 'similar to those at Tu = 298 K'.
- [§4.2 (Figure 9 caption)] The acronym 'HQO' appears in the caption and in the text where 'HOQ' is intended; please make the terminology consistent throughout.
- [§2.2, Table 1] The table lists 'Pecld' with an accented 'e' in the header, but the text uses 'Pécd' and 'Peclet' in several places; please standardize the notation and define all symbols in the table caption.
- [§4.2] The paragraph introducing Fig. 12 states that the relationship between the relative heat flux and I0 was shown in Part I 'through varying the numerical domain sizes', but Part I is cited as 'in review'; please ensure the citation includes the arXiv identifier and that the claim is verifiable from the cited document.
Circularity Check
In-sample fits are called predictions: the joint model (Eq. 11) is validated on the same data used to fit Eqs. 9 and 10, so the agreement is by construction.
-
fitted input called prediction
[Section 4.2, Eqs. (9)-(11) and Fig. 13]
"The linear fit in Fig. 12 a) between the relative increase in the mean quenching wall heat flux Φq,2D/Φq,1D and the reactivity factor I0 is given as: Φq,2D/Φq,1D = a + b · I0 , (9) with the offset a = −1.16 and the slope b = 2.07. ... Figure 13 b) shows a comparison of the numerically measured values of the relative increase in the mean wall heat flux Φq,2D/Φq,1D and the values from the joint model approximation (Eq. 11). For this joint model as well, a strong agreement is observed between the numerically measured values and those predicted by the model equation."
Equation (9) is a linear least-squares fit of the relative wall heat flux to I0 using the same operating-condition points shown in Fig. 12(a); Eq. (10) is a linear fit of I0 to Ze/Pecd for the same points; Eq. (11) is obtained by substituting Eq. (10) into Eq. (9), so e = a + b·c and f = b·d. Fig. 13(b) then compares Eq. (11) with the very same Φq,2D/Φq,1D measurements that determined a, b, c, and d. The 'strong agreement' between the curve and the points is therefore guaranteed by the fitting procedure; it is an in-sample goodness-of-fit, not an independent prediction. Calling these fitted values 'predicted by the model equation' is the statistical forcing described in pattern 2.
full rationale
The main physical findings of the paper—that thermodiffusive instabilities increase the mean wall heat flux and reduce the mean quenching distance relative to one-dimensional HOQ, and that hydrodynamic instabilities have little effect—are direct DNS comparisons at matched operating conditions. These comparisons are self-contained and do not reduce to their inputs. The use of Part I [1] is a motivation and setup reference, but the parametric data in Figs. 8-12 independently support the trend, so I do not treat that self-citation as load-bearing. The circular element is confined to the proposed model: Eq. 9 is a fit of Φq,2D/Φq,1D to I0 over the entire dataset, Eq. 10 is a fit of I0 to Ze/Pecd over the same conditions, and Eq. 11 is the algebraic composition of these two fits. Fig. 13b then plots Eq. 11 against the same measured points used to obtain the coefficients and calls the agreement 'predicted'. Because the coefficients are determined by those points, the agreement is forced by construction. The absence of ensemble statistics or held-out operating conditions further limits the quantitative model, but that is a statistical-correctness issue rather than an additional circularity.
Assumptions & free parameters
free parameters (4)
- a in Eq. 9 =
-1.16
- b in Eq. 9 =
2.07
- c in Eq. 10 =
0.978
- d in Eq. 10 =
0.0115
assumptions (6)
- domain assumption The wall is isothermal at the unburnt gas temperature with zero species flux and no surface chemistry.
- domain assumption A periodic domain of height Ly = 100 delta_T captures all instability length scales and gives representative statistics.
- domain assumption Grid resolution of 20 points in the flame front is sufficient at all pressures, including 20 bar.
- domain assumption The initial sinusoidal perturbation amplitude and wavelength do not affect the statistically stationary nonlinear regime.
- domain assumption The Li et al. 9-species, 19-reaction mechanism describes the relevant hydrogen/air kinetics.
- domain assumption The reactivity factor I0 and its linear scaling with Ze/Pe_cd follow Rieth et al. and prior parameter studies.
Cite this review
Pith. "Pith review of Flame-wall interaction of thermodiffusively unstable hydrogen/air flames -- Part II: Parametric variations of equivalence ratio, temperature, and pressure." pith.science (2026). https://pith.science/paper/MEIJMVCK
@misc{pith2026241118106,
  author       = {Pith},
  title        = {Pith review of: Flame-wall interaction of thermodiffusively unstable hydrogen/air flames -- Part II: Parametric variations of equivalence ratio, temperature, and pressure},
  year         = {2026},
  howpublished = {\url{https://pith.science/paper/MEIJMVCK}},
  note         = {Machine review of arXiv:2411.18106}
}
read the original abstract
Fuel-lean hydrogen combustion systems hold significant potential for low pollutant emissions, but are also susceptible to intrinsic combustion instabilities. While most research on these instabilities has focused on flames without wall confinement, practical combustors are typically enclosed by walls that strongly influence the combustion dynamics. In part I of this work, the flame-wall interaction of intrinsically unstable hydrogen/air flames has been studied for a single operating condition through detailed numerical simulations in a two-dimensional head-on quenching configuration. This study extends the previous investigation to a wide range of gas turbine and engine-relevant operating conditions, including variations in equivalence ratio (0.4 - 1.0), unburnt gas temperature (298 K - 700 K), and pressure (1.01325 bar - 20 bar). These parametric variations allow for a detailed analysis and establish a baseline for modeling the effects of varying instability intensities on the quenching process, as the relative influence of thermodiffusive and hydrodynamic instabilities depends on the operating conditions. While the quenching characteristics remain largely unaffected by hydrodynamic instabilities, the presence of thermodiffusive instabilities significantly increases the mean wall-heat flux and reduces the mean quenching distance. Furthermore, the impact of thermodiffusive instabilities on the quenching process intensifies as their intensity increases, driven by an increase in pressures and a decrease in equivalence ratio and unburnt gas temperature.
Figures


Figures from the paper (11 more)


Reference graph
Works this paper leans on
-
[1]
M. Schneider, H. Nicolai, V. Schuh, M. Steinhausen, and C. Hasse. Flame-wall interaction of thermodiffusively unstable hydrogen/air flames – Part I: Characterization of governing physical phenomena (in review). Combust. Flame , 2024. URL https://doi.org/10.48550/ arXiv.2411.17590
work page Pith review arXiv doi:10.48550/arxiv.2411.17590 2024
-
[2]
S. Verhelst and T. Wallner. Hydrogen-fueled internal combustion engines. Prog. Energy Combust. Sci. , 35:490–527, December 2009. ISSN 0360-1285
work page 2009
-
[3]
A. Dreizler and B. B¨ ohm. Advanced laser diagnostics for an improved understanding of premixed flame-wall interactions. Proc. Combust. Inst. , 35:37–64, 2015. ISSN 1540-7489
work page 2015
-
[4]
J. Lai, M. Klein, and N. Chakraborty. Direct numerical simulation of head-on quenching of statistically planar turbulent premixed methane-air flames using a detailed chemical mecha- nism. Flow. Turbul. Combust. , 101:1073–1091, April 2018. ISSN 1573-1987
work page 2018
-
[5]
M. Steinhausen, T. Zirwes, F. Ferraro, A. Scholtissek, H. Bockhorn, and C. Hasse. Flame- vortex interaction during turbulent side-wall quenching and its implications for flamelet man- ifolds. Proc. Combust. Inst. , 39:2149–2158, 2023. ISSN 1540-7489
work page 2023
- [6]
- [7]
-
[8]
P. Johe, F. Zentgraf, M. Greifenstein, M. Steinhausen, C. Hasse, and A. Dreizler. Characteri- zation of flow field and combustion dynamics in a novel pressurized side-wall quenching burner using high-speed PIV/OH-PLIF measurements. Int. J. Heat Fluid Fl. , 94:108921, April 2022. ISSN 0142-727X
work page 2022
Show all 30 references
-
[9]
Dabireau, B
F. Dabireau, B. Cuenot, O. Vermorel, and T. Poinsot. Interaction of flames of H 2 + O2 with inert walls. Combust. Flame , 135:123–133, October 2003. ISSN 0010-2180
2003
-
[10]
Gruber, R
A. Gruber, R. Sankaran, E. R. Hawkes, and J. H. Chen. Turbulent flame–wall interaction: a direct numerical simulation study. J. Fluid Mech. , 658:5–32, August 2010. ISSN 1469-7645
2010
-
[11]
De Nardi, Q
L. De Nardi, Q. Douasbin, O. Vermorel, and T. Poinsot. Infinitely fast heterogeneous catalysis model for premixed hydrogen flame-wall interaction. Combust. Flame , 261:113328, March
-
[12]
Berger, A
L. Berger, A. Attili, and H. Pitsch. Intrinsic instabilities in premixed hydrogen flames: Para- metric variation of pressure, equivalence ratio, and temperature. Part 1 - dispersion relations in the linear regime. Combust. Flame , 240:111935, June 2022. ISSN 0010-2180
2022
-
[13]
Berger, A
L. Berger, A. Attili, and H. Pitsch. Intrinsic instabilities in premixed hydrogen flames: para- metric variation of pressure, equivalence ratio, and temperature. Part 2 – non-linear regime and flame speed enhancement. Combust. Flame , 240:111936, June 2022. ISSN 0010-2180
2022
-
[14]
Altantzis, C
C. Altantzis, C. E. Frouzakis, A. G. Tomboulides, and K. Boulouchos. Direct numerical simulation of circular expanding premixed flames in a lean quiescent hydrogen-air mixture: Phenomenology and detailed flame front analysis. Combust. Flame , 162:331–344, February
-
[15]
C. E. Frouzakis, N. Fogla, A. G. Tomboulides, C. Altantzis, and M. Matalon. Numerical study of unstable hydrogen/air flames: Shape and propagation speed. Proc. Combust. Inst. , 35:1087–1095, 2015. ISSN 1540-7489
2015
-
[16]
Berger, K
L. Berger, K. Kleinheinz, A. Attili, and H. Pitsch. Characteristic patterns of thermodiffusively unstable premixed lean hydrogen flames. Proc. Combust. Inst. , 37:1879–1886, 2019. ISSN 1540-7489
2019
-
[17]
Creta, P
F. Creta, P. E. Lapenna, R. Lamioni, N. Fogla, and M. Matalon. Propagation of premixed flames in the presence of darrieus–landau and thermal diffusive instabilities. Combust. Flame, 216:256–270, June 2020. ISSN 0010-2180
2020
-
[18]
Attili, R
A. Attili, R. Lamioni, L. Berger, K. Kleinheinz, P. E. Lapenna, H. Pitsch, and F. Creta. The effect of pressure on the hydrodynamic stability limit of premixed flames. Proc. Combust. Inst., 38:1973–1981, 2021. ISSN 1540-7489. 23
1973
-
[19]
Howarth and A
T. Howarth and A. Aspden. An empirical characteristic scaling model for freely-propagating lean premixed hydrogen flames. Combust. Flame , 237:111805, March 2022. ISSN 0010-2180
2022
-
[20]
Howarth, E
T. Howarth, E. Hunt, and A. Aspden. Thermodiffusively-unstable lean premixed hydrogen flames: Phenomenology, empirical modelling, and thermal leading points. Combust. Flame , 253:112811, July 2023. ISSN 0010-2180
2023
-
[21]
Rieth, A
M. Rieth, A. Gruber, and J. H. Chen. The effect of pressure on lean premixed hydrogen-air flames. Combust. Flame , 250:112514, April 2023. ISSN 0010-2180
2023
-
[22]
D. G. Goodwin, H. K. Moffat, I. Schoegl, R. L. Speth, and B. W. Weber. Cantera: An object- oriented software toolkit for chemical kinetics, thermodynamics, and transport processes. https://www.cantera.org, 2023. Version 3.0.0
2023
-
[23]
J. Li, Z. Zhao, A. Kazakov, and F. L. Dryer. An updated comprehensive kinetic model of hydrogen combustion. Int. J. Chem. Kinet. , 36:566–575, August 2004. ISSN 1097-4601
2004
-
[24]
Chiesa, G
P. Chiesa, G. Lozza, and L. Mazzocchi. Using hydrogen as gas turbine fuel. J. Eng. Gas Turbine. Power, 127:73–80, January 2005. ISSN 1528-8919
2005
-
[25]
Peters and F
N. Peters and F. Williams. The asymptotic structure of stoichiometric methane/air flames. Combust. Flame , 68:185–207, May 1987. ISSN 0010-2180
1987
-
[26]
Matalon, C
M. Matalon, C. Cui, and J. K. Bechtold. Hydrodynamic theory of premixed flames: effects of stoichiometry, variable transport coefficients and arbitrary reaction orders. J. Fluid Mech. , 487:179–210, June 2003. ISSN 1469-7645
2003
-
[27]
C. Sun, C. Sung, L. He, and C. Law. Dynamics of weakly stretched flames: quantitative description and extraction of global flame parameters. Combust. Flame , 118:108–128, July
-
[28]
M. Matalon. Intrinsic flame instabilities in premixed and nonpremixed combustion. Annu. Rev. Fluid. Mech , 39:163–191, January 2007. ISSN 1545-4479
2007
-
[29]
H. G. Weller, G. Tabor, H. Jasak, and C. Fureby. A tensorial approach to computational continuum mechanics using object-oriented techniques.Comput. Phys., 12:620–631, November
-
[30]
Berger, M
L. Berger, M. Grinberg, B. J¨ urgens, P. E. Lapenna, F. Creta, A. Attili, and H. Pitsch. Flame fingers and interactions of hydrodynamic and thermodiffusive instabilities in laminar lean hydrogen flames. Proc. Combust. Inst. , 39:1525–1534, 2023. ISSN 1540-7489. 24
2023
Reviewed August 12, 2026 · model on record in the stance chip above.
Discussion (0). Continue with ORCID to comment.