REVIEW 4 major objections 5 minor 34 references
Impact of Time-Dependent Wettability Alteration on the Dynamics of Capillary Pressure
T0 review · 4 major / 5 minor · reviewed 2026-08-14 · deepseek-v4-flash
Pith's one-line read A single rate parameter, derived from pore-scale contact-angle kinetics, describes how capillary pressure migrates from the initial to the final wetting state in a porous medium.
desk verdict Useful single-parameter interpolation model for dynamic capillarity, but the pore-to-macro scalings are fitted, not derived — worth refereeing with honest revision. read the letter →
The pith
A machine-rendered reading of the paper's core claim, the machinery that carries it, and where it could break.
The reading
What carries the argument
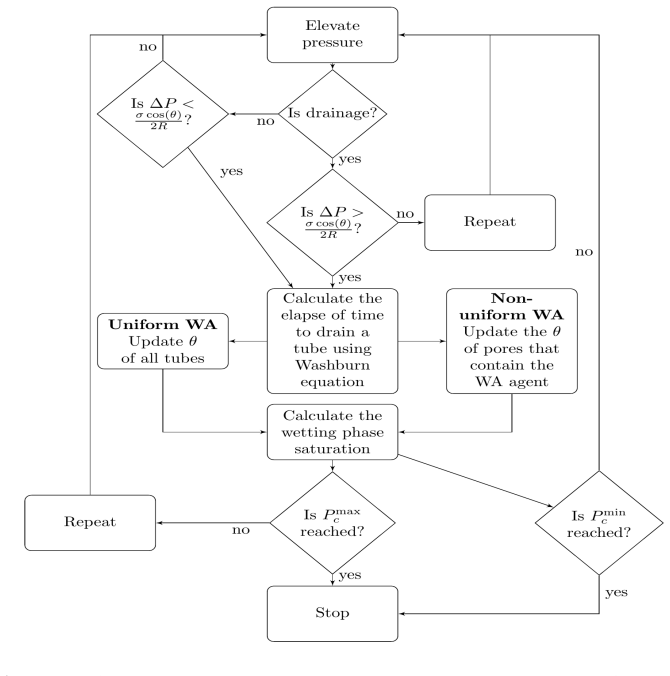
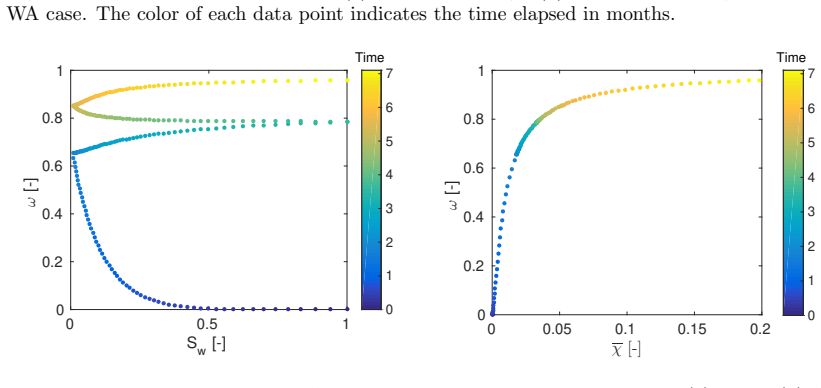
The load-bearing identity is the interpolation formula $P_c=(1-\omega) P_c^{st,i} + \omega P_c^{st,f}$, in which the dynamic coefficient $\omega$ carries all time dependence. The paper evaluates $\omega$ by simulating displacement in a bundle of non-interacting capillary tubes (a simplified pore-scale model of parallel cylindrical pores with a Weibull radius distribution), where each tube's contact angle obeys $\theta_m = \theta_{m,i} + \frac{\chi}{C+\chi}\Delta\Theta$, a Langmuir-type law in the local exposure time $\chi = (1/T)\int S_{nw}\,dt$. The bundle-of-tubes simulation generates $P_c$-$S$ data; fitting $\omega$ to those data produces the explicit forms $\omega=\chi/(2C+\chi)$ (uniform alteration) and $\omega=S_w\chi/(\beta_2+S_w\chi)$ (non-uniform), and the scalings $\beta_1=2C$, $\beta_2=b_1 C^{b_2}$ connect the pore-scale rate constant to the macroscale coefficient.
What would settle it
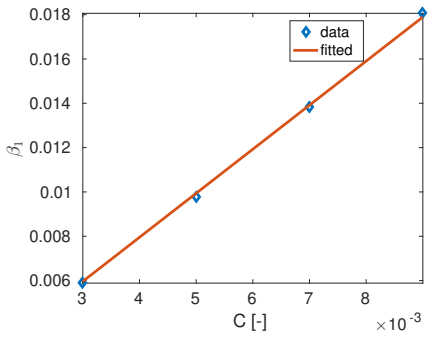
Run a multi-cycle drainage-imbibition experiment on a mineral substrate with a wettability-altering fluid while independently measuring contact angle and capillary pressure over time. Compute the exposure time $\chi$ from the recorded saturation history and check whether the normalized deviation $(P_c - P_c^{st,i})/(P_c^{st,f}-P_c^{st,i})$ collapses onto $\chi/(2C+\chi)$ for uniform alteration and whether the fitted $\beta_1$ equals $2C$ for several values of $C$. A systematic collapse failure or a non-constant ratio $\beta_1/C$ would contradict the central claim.
Extended reading notes
Core claim
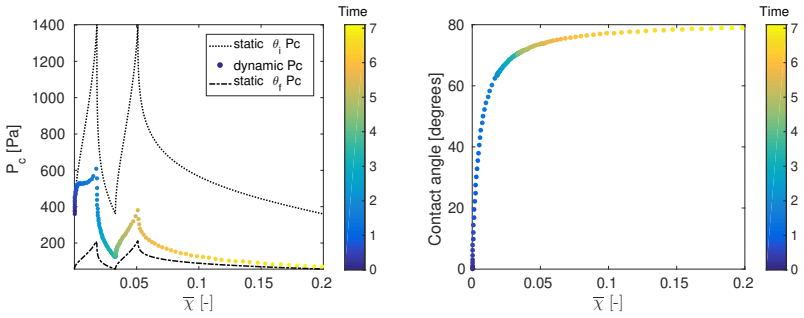
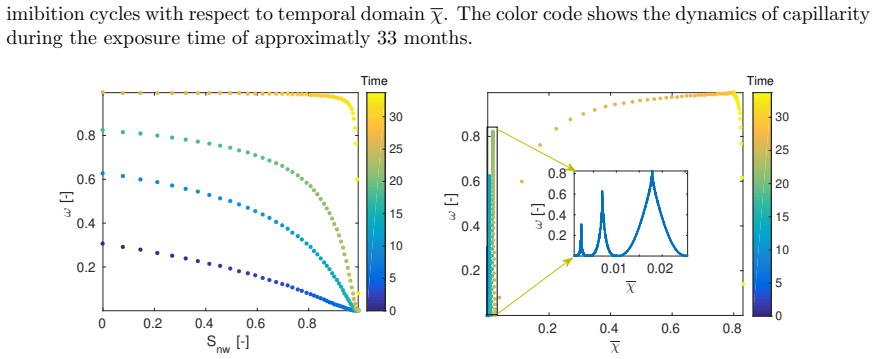
The central claim is that the measured capillary pressure $P_c$ of a system undergoing wettability alteration is never an independent function of saturation but is always the static initial curve shifted by a fraction $\omega$ of the gap to the static final curve: $P_c = (1-\omega) P_c^{st,i} + \omega P_c^{st,f}$. The paper derives $\omega$ from pore-scale bundle-of-tubes simulations: when alteration is uniform, $\omega$ depends only on the non-dimensional exposure time $\chi$, taking $\omega = \chi/(2C+\chi)$; when alteration is non-uniform and local, $\omega$ also depends on saturation, $\omega = S_w \chi/(\beta_2 + S_w \chi)$ with $\beta_2 = b_1 C^{b_2}$. The macroscale parameter is therefore a direct function of the pore-scale rate constant $C$, so the dynamic capillary pressure can be predicted a priori once the static end states and the contact-angle kinetics are known. The simulations also show that wettability alteration alone can produce apparent hysteresis in a geometry that otherwise has none.
Load-bearing premise
The model stands on the assumption that a pore's contact angle changes along the smooth Langmuir-type path $\theta = \theta_i + (\chi/(C+\chi))\Delta\Theta$ driven by time-integrated non-wetting saturation; if laboratory measurements show a different kinetic law, the specific functional forms of $\omega$ and the $C$-scalings derived here would not apply.
Editorial extensions
If this is right
- Reservoir simulators can replace cycle-dependent or hysteresis-tabulated capillary pressure curves for wettability-altering fluids with the static end curves plus a single dynamic parameter that depends on exposure time.
- For CO$_2$ storage, a months-long decrease in capillary pressure—and the associated risk of reduced caprock sealing capacity—becomes predictable from batch contact-angle measurements rather than requiring years of core-flood experiments.
- Laboratory protocols for reactive fluid pairs should report saturation history and exposure time, because the same saturation can correspond to different capillary pressures depending on how long the rock has been exposed.
- Distinguishing uniform from non-uniform alteration matters: dissolution of a wettability-altering agent into the wetting phase and direct contact with the non-wetting phase lead to different functional forms of the dynamic coefficient.
- Calibration of the dynamic coefficient against a single saturation-time path is sufficient to predict capillary pressure along arbitrary paths in the saturation-exposure-time domain, as demonstrated by the simulated surface comparisons.
Reading between the lines
- A natural extension the authors leave implicit: the same interpolation logic should apply to relative permeability, since the pore-scale contact-angle model changes the mobility of phases; a bundle-of-tubes or pore-network study could test whether a single dynamic coefficient again collapses the curves.
- If real contact-angle kinetics deviate from the Langmuir law, the interpolation identity may still hold but the coefficient $\omega$ would take a different form; the interpolation structure is more robust than the specific fitted scalings.
- The appearance of apparent hysteresis in a non-hysteretic bundle of tubes suggests that in real porous media, part of the hysteresis observed with reactive fluids may be caused by time-dependent wettability rather than pore geometry or trapping—a distinction experiments could quantify by comparing inert and reactive cycles.
- Because standard multi-step outflow experiments assume equilibrium, published capillary pressure data for reactive fluid pairs may contain hidden path dependence; re-analyzing historical data with saturation-history integration could reveal whether reported scatter collapses onto the proposed $\omega$ surfaces.
Signed reviews
Editorial analysis
A structured set of objections, weighed in public.
Referee Report
Summary. The manuscript develops a dynamic capillary-pressure model for porous media subjected to time-dependent wettability alteration. The model interpolates between initial and final static Brooks-Corey curves through a dynamic coefficient ω: Pc = (1−ω) Pc^st,i + ω Pc^st,f. Using a bundle-of-tubes (BoT) pore-scale model with a Langmuir-type contact-angle law θ_m = θ_i + [χ/(C+χ)] ΔΘ, where χ is the integrated non-wetting saturation, the authors simulate drainage-imbibition cycles for uniform and non-uniform alteration, correlate ω to χ and saturation, and propose the pore-to-macroscale scaling laws β1 = 2C and β2 = b1 C^b2. They conclude that a single-parameter interpolation model captures WA-induced capillary-pressure dynamics and that the macroscale dynamics can be quantified 'a priori' from the pore-scale parameter C.
Significance. The topic is practically important for CO2 storage and enhanced oil recovery, where wettability alteration occurs on experimental and reservoir timescales. The paper's simulation framework is transparent, the BoT algorithm is clearly specified, and the authors report excellent fits to their simulated curves (R² = 0.9921 for the uniform case). The paper is also honest in stating that the pore-scale kinetic model is 'a convenient mathematical form' and that 'detailed laboratory work would needed to further justify the use of this model.' If the proposed pore-to-macroscale mappings were validated against independent simulations or experiments, the resulting single-parameter closure would be a useful ingredient for reservoir-scale simulators. The main novelty is the systematic attempt to connect a pore-scale contact-angle rate constant to a macroscale dynamic coefficient.
major comments (4)
- [§2.2, Eqs. (9)–(11)] The entire upscaling chain is conditional on the assumed Langmuir-type kinetics θ_m = θ_i + [χ/(C+χ)] ΔΘ. The text itself concedes that this model 'is not intended to capture the full complexity at the pore-scale' and that 'detailed laboratory work would needed to further justify the use of this model.' Consequently the functional forms of ω in Eqs. (14) and (16) are not general results; they are predictions only for this assumed kinetics. The Discussion should explicitly state this conditionality wherever the term 'a priori' is used.
- [§3.3.1, Eq. (15) and Fig. 10] The proportionality β1 = 2C is an empirical fit over C ∈ [3,8] × 10^-3, not a derivation. Moreover, an exact consequence of the pore-scale Young–Laplace law (Eq. 7) in the uniform case is Pc(Sw,θ) = cos θ Pc^st,i(Sw) (for θ_i = 0), which gives ω = (cos θ − 1)/(cos θ_f − 1); this is not identically equal to χ/(2C + χ) under Eq. (10). Thus Eq. (15) is an approximate closure calibrated on the same BoT data, and the Discussion's statement that the macroscale dynamics can be quantified 'a priori' overstates what has been demonstrated.
- [§3.4.1, Eqs. (16)–(18) and Fig. 19] For the non-uniform case, both α(χ) = β2/χ and the power-law β2 = b1 C^b2 are chosen from the shape of the data, and the latter is fitted to only four values of C over approximately one order of magnitude (Fig. 19) for a single pore-size distribution and fluid pair. The paper provides no out-of-sample test of these scalings for other distributions or fluid properties; therefore the claim that β1 and β2 can be predicted 'directly from the pore scale phenomenon' is not yet supported. Please reframe these as empirical correlations and report their uncertainty and range of validity.
- [§3.3.2 and §3.4.2, Figs. 11 and 18] The path-robustness tests in Figs. 11 and 18 do not validate the scaling laws across C; they show that a coefficient calibrated from one saturation path works for other paths with the same C. While this is a useful property, it is not evidence for 'a priori' prediction of the macroscale coefficient from C, which is the paper's strongest claim.
minor comments (5)
- [§2.2, text below Eq. (9)] The sentence 'Detailed laboratory work would needed to further justify the use of this model' should read 'would be needed.'
- [Fig. 12 caption] The word 'approximatly' should be 'approximately.'
- [§3.4.1, Eq. (16)] The function is written as ω(Snw,χ) but is defined in terms of Sw = 1 − Snw; please use the same saturation variable throughout the equation and surrounding text.
- [Discussion, first paragraph] The phrase 'single value parameter' is ambiguous; 'single-valued, single-parameter model' would be clearer.
- [Figs. 11 and 18] The color bars showing the difference between the model and the simulated data lack labels and units; adding them would make the magnitude of the mismatch easier to assess.
Circularity Check
The 'a priori' macroscale predictions are fitted re-expressions of the assumed Langmuir contact-angle law; the dynamic coefficient is calibrated to the same BoT simulations and then declared predictable from C.
-
fitted input called prediction
[Section 3.3.1, Eqs. (14)-(15), Fig. 10]
"Given this insight, we propose an adsorption-type model to fit the interpolation coefficient ω to the average exposure time: ω = χ/(β1+χ), where β1 is a fitting parameter obtained from the best fit to simulated data in Figure 8b. ... Figure 10 shows that the interpolation model parameter is directly proportional to the pore-scale model parameter, with a proportionality constant of 2. Thus, the relationship β1 = 2C can be used to predict the macroscale parameter directly from knowledge of the pore-scale process."
β1 is fitted to BoT simulations whose only time-dependent input is the assumed Langmuir contact-angle law θ = θ_i + [χ/(C+χ)] ΔΘ (Eq. 10). The same χ-dependence is then imposed on the dynamic coefficient ω (Eq. 14), and β1 is mapped to C by a second fit over simulations (Fig. 10). Consequently Eq. 15, Pc = χ/(2C+χ)(Pc^st,f − Pc^st,i) + Pc^st,i, is not an independently predicted macroscale law; it is the input pore-scale kinetics re-expressed with a fitted proportionality constant. The validation in Figs. 9 and 11 compares the model with the same simulated data from which β1 was fitted, so the 'a priori' prediction claim is not supported by an out-of-sample test.
-
fitted input called prediction
[Section 3.4.1, Eqs. (16)-(18), Fig. 19]
"α(χ)=β2/χ, where β2 is non-dimensional fitting parameter. ... A power law model, β2 = b1C^b2 is observed between these parameters and the model parameters are estimated to be b1 = 3.3 × 10^6 and b2 = 1.8. The model for β2 can be substituted into model (18) to characterize the dynamics of the capillary pressure directly from the pore scale phenomenon."
The non-uniform dynamic coefficient is built from fitting α to each cycle's ω−Snw data, then setting α = β2/χ, which turns Eq. 16 into ω = χSw/(β2+χSw), an adsorption form in the product χSw. β2 is then fit over simulations with varying C via a power law in C, and the resulting Eq. 18 is compared with the same simulation data used for calibration (Fig. 17). Thus the claimed relationship 'directly from the pore scale phenomenon' is a curve fit over four C values to an unvalidated kinetic ansatz, not an independent prediction.
full rationale
The paper is transparent that the pore-scale contact-angle model is a convenient mathematical ansatz rather than a validated mechanistic law: it states the model 'is not intended to capture the full complexity at the pore-scale' and that 'Detailed laboratory work would needed to further justify the use of this model.' That limitation is acknowledged, so the circularity is not hidden. The central overreach is in the upscaling claim. The dynamic coefficient ω is not derived from the pore-scale physics; it is proposed to have the same sorption form as the assumed θ(χ) law, and the scaling constants β1 = 2C and β2 = b1C^b2 are obtained by fitting to the same BoT simulations that take C as an input. These fitted scalings are then described as 'a priori' predictions of macroscale dynamics from knowledge of the pore-scale process. Moreover, the model validation is in-sample: Figs. 9, 11, 17, and 18 compare the calibrated model to the simulation data that generated the fitting parameters, rather than to independent experimental or out-of-sample simulation data. No load-bearing self-citation chain is present; the prior interpolation and Langmuir references are external and not used to justify the present model's predictions. Because the functional forms are not exact identities—for example, uniform ω would be (cosθ−1)/(cosθ_f−1) rather than exactly χ/(2C+χ)—there is genuine approximation content, so the work is not wholly definitional. However, the central 'single-parameter a priori prediction' claim reduces to a calibration of the assumed kinetic law, which is a partial circularity: one or more predictions reduce to fitted inputs.
Assumptions & free parameters
free parameters (7)
- C (pore-scale wettability alteration rate) =
0.005 (uniform), 1e-5 (non-uniform); varied in 0.003-0.008 and 1e-5 to 7e-5
- θ_f (final contact angle) =
80 degrees
- β1 (uniform dynamic coefficient parameter) =
0.01 for C=0.005; then β1 = 2C
- β2 (non-uniform dynamic coefficient parameter) =
0.004 for C=1e-5
- b1, b2 (scaling law for β2(C)) =
b1=3.3e6, b2=1.8
- Brooks-Corey parameters cw, aw =
cw: 360 Pa (initial), 56 Pa (final); aw: 0.2778 (both)
- Weibull pore-size distribution parameters =
Rmin=10 µm, Rmax=40 µm, rav=23 µm, η=1.5
assumptions (6)
- standard math Washburn equation for interface velocity in a capillary tube (Eq. 8)
- domain assumption Bundle-of-tubes representation of pore space, without pore interactions, converging-diverging geometry, or residual trapping
- ad hoc to paper Langmuir-type contact angle evolution θ_m = θ_i + [χ/(C+χ)] ΔΘ with exposure time χ defined by Eq. (11)
- ad hoc to paper Dynamic capillary pressure interpolates linearly between initial and final static Brooks-Corey curves (Eq. 4)
- ad hoc to paper The dynamic coefficient ω is a unique function of χ in the uniform case and of χ and Sw in the non-uniform case
- domain assumption Exposure time is proportional to the time-integrated non-wetting saturation
Cite this review
Pith. "Pith review of Impact of Time-Dependent Wettability Alteration on the Dynamics of Capillary Pressure." pith.science (2026). https://pith.science/paper/MJYVJFW3
@misc{pith2026190806863,
  author       = {Pith},
  title        = {Pith review of: Impact of Time-Dependent Wettability Alteration on the Dynamics of Capillary Pressure},
  year         = {2026},
  howpublished = {\url{https://pith.science/paper/MJYVJFW3}},
  note         = {Machine review of arXiv:1908.06863}
}
abstract
Wettability is a pore-scale property that has an important impact on capillarity, residual trapping, and hysteresis in porous media systems. In many applications, the wettability of the rock surface is assumed to be constant in time and uniform in space. However, many fluids are capable of altering the wettability of rock surfaces permanently and dynamically in time. Experiments have shown wettability alteration can significantly decrease capillarity in CO$_2$ storage applications. For these systems, the standard capillary-pressure model that assumes static wettability is insufficient to describe the physics. In this paper, we develop a new dynamic capillary-pressure model that takes into account changes in wettability at the pore-level by adding a dynamic term to the standard capillary pressure function. We simulate the dynamic system using a bundle-of-tubes (BoT) approach, where a mechanistic model for time-dependent contact angle change is introduced at the pore scale. The resulting capillary pressure curves are then used to quantify the dynamic component of the capillary pressure function. This study shows the importance of time-dependent wettability for determining capillary pressure over timescales of months to years. The impact of wettability has implications for experimental methodology as well as macroscale simulation of wettability-altering fluids.
Figures


Figures from the paper (16 more)







Reference graph
Works this paper leans on
-
[1]
Bonn, D. & Eggers, J. & Hindekeu, J. & Meunier, J. & Rolley, E. 2009 Wetting and spreading. Rev. Mod. Phys. 81, 739-805. 21
work page 2009
-
[2]
& Rahman, T., & Sarmadivaleh, M
Iglauer, S. & Rahman, T., & Sarmadivaleh, M. & Al-Hinai, A. & Fernø, M. A. & Lebedev, M. 2016 Influence of wettability on residual gas trapping and enhanced oil recovery in three-phase flow: A pore-scale analysis by use of microcomputed tomography. SPE J. 21, 1916–1929
work page 2016
-
[3]
auYu, L. & Kleppe, H. & Kaarstad, T. & Skjæveland, S. M. 2008 Modelling of wetta- bility alteration processes in carbonate oil reservoirs. Netw. Heterog. Media 3, 149–183
work page 2008
-
[4]
Iglauer, S. & Pentland, C. H. & Busch, A. 2014 CO 2 wettability of seal and reservoir rocks and the implications for carbon geo-sequestration. Water Resour. Res. 51, 729–774
work page 2014
-
[5]
Blunt, M. J. 2001 Flow in porous media– pore-network models and multiphase flow. Curr. Opin. Colloid Interface Sci. 6, 197–207
work page 2001
-
[6]
Ahmed, A. & Patzek, T. W. 2003 Impact of Wettability Alteration on Two-Phase Flow Characteristics of Sandstones: A Quasi-Static Description. Water Resour. Res. 39, 1-12
work page 2003
-
[7]
Blunt, M. J. 1997 Pore Level Modeling of the Effects of Wettability. SPE J. 2, 494–510
work page 1997
-
[8]
Morrow, N. R. & Lim, H. T. & Ward, J. S. 1986 Effect of crude-oil-induced wettability changes on oil recovery . SPE J., 89-103
work page 1986
Show all 34 references
-
[9]
Buckley, J. S. & Liu, Y. & Monsterleet, S. 1988 Mechanisms of wetting alteration by crude oils. SPE J. 3, 54-61
1988
-
[10]
Jadhunandan, P. P. & Morrow, N. R. 1995 Effect of Wettability on Waterflood Recovery for Crude-Oil/Brine/Rock Systems. SPE Reservoir Engineering 10, 40–46
1995
-
[11]
Haagh, M. E. J. & Siretanu, I. & Duits, M. H. G. & Mugele, F. 2017 Salinity- Dependent Contact Angle Alteration in Oil/Brine/Silicate Systems: the Critical Role of Divalent Cations. Langmuir 33, 3349–3357
2017
-
[12]
& Mohanty, K
Singh, R. & Mohanty, K. 2016 Foams with wettability-altering capabilities for oil-wet car- bonates: A synergistic approach. SPE J. 21, 1126-1139
2016
-
[13]
& Wan, J
Kim, Y. & Wan, J. & Kneafsey, T. J. & Tokunaga, T. K. 2012 Dewetting of silica sur- faces upon reactions with supercritical CO2 and Brine: Pore-scale studies in micromodels.Environ. Sci. Technol.46, 4228–4235
2012
-
[14]
Tokunaga, T. K. & Wan, J. 2013 Capillary pressure and mineral wettability influences on reservoir CO2 capacity. Rev. Mineral. Geochem. 77, 481-503
2013
-
[15]
& Broseta, D
Chiquet, P. & Broseta, D. & Thibeau, S.2007a Wettability alteration of caprock minerals by carbon dioxide. Geofluids, 112–122
-
[16]
& Robin, M
Chalbaud, C. & Robin, M. & Lombard, J. & Martin, F. & Egermann, P. & Bertin, H. 2009 Interfacial tension measurements and wettability evaluation for geological CO 2 storage. Adv Water Resour 32, 98–109
2009
-
[17]
Plug, W. J. & Bruining, J. 2007 Capillary pressure for the sand-CO 2-water system under various pressure conditions. Application to CO 2 sequestration. Adv Water Resour 30 2339–2353. 22
2007
-
[18]
& Tokunaga, T
Wang, S. & Tokunaga, T. K. 2015 Capillary pressure–saturation relations for supercritical CO2 and brine in limestone/dolomite sands: Implications for geologic carbon sequestration in carbonate reservoirs. Environ. Sci. Technol. 49, 7208–7217
2015
-
[19]
& Tokunaga, T
Wang, S. & Tokunaga, T. K. & Wan, J. & Dong, W. & Kim, Y. 2016 Capillary pressure-saturation relations in quartz and carbonate sands: Limitations for correlating capillary and wettability influences on air, oil, and supercritical CO 2 trapping. Water Resour. Res., 6671– 6690
2016
-
[20]
Tokunaga, T. K. & Wan, J. & Jung, J. & Kim, T. W. & Kim, Y. & Dong, W. 2013 Capillary pressure and saturation relations for supercritical CO2 and brine in sand: High-pressure Pc(Sw) controller/meter measurements and capillary scaling predictions. Water Resour. Res., 49, 4566–4579
2013
-
[21]
& Celia, M
Hassanizadeh, S. & Celia, M. & Dahle, H.2002 Dynamic effects in the capillary pressure– saturation relationship and its impacts on unsaturated flow. Vadose Zone J 1, 38–57
2002
-
[22]
Dahle, H. K. & Celia, M. A. & Hasanizadeh, S. M. 2005 Bundle-of-Tubes Model for Calculating Dynamic Effects in the Capillary-Pressure Saturation Relationship. Transport porous med 58, 5–22
2005
-
[23]
Krumpfer, J. W. & McCarthy, T. J. 2010 Contact angle hysteresis: a different view and a trivial recipe for low hysteresis hydrophobic surfaces. Faraday Discuss. 146, 103–111
2010
-
[24]
Eral, H. B. & ’t Mannetje, D. J. C. M. & Oh, J. M. 2013 Contact angle hysteresis: a review of fundamentals and applications. Colloid Polym Sci 291, 247–260
2013
-
[25]
& Najafabadi, N
Delshad, M. & Najafabadi, N. F. & Anderson, G. A. & Pope, G. A. & Sepehrnoori, K. 2009 Modeling Wettability Alteration by Surfactants in Naturally Fractured Reservoirs. SPE J. 12, 361-370
2009
-
[26]
Lashgari, H. R. & Xu, Y. & Sepehrnoori, K. 2016 Modelling dynamic wettability alter- ation effect based on contact angle. SPE, 1–17
2016
-
[27]
Andersen, P. Ø. & Evje, S. & Kleppe, H. & Skjæveland, S. M. 2015 A Model for Wettability Alteration in Fractured Reservoirs. SPE J. 20, 1261–1275
2015
-
[28]
& Sun, X
Adibhatia, B. & Sun, X. & Mohanty, K. 2005 Numerical Studies of Oil Production from Initially Oil-Wet Fracture Blocks by Surfactant Brine Imbibition. SPE, 1-15
2005
-
[29]
Al-Mutairi, S. M. & Abu-Khamsin, S. A. & Hossain, M. E. 2012 A Novel Approach to Handle Continuous Wettability Alteration during Immiscible CO 2 Flooding Process. SPE, 1-12
2012
-
[30]
Bartley, J. T. & Ruth, D. W. 1999 Relative Permeability Analysis of Tube Bundle Mod- els.Transport porous med 36, 161–187
1999
-
[31]
Helland, J. O. & Skjæveland, S. M. 2006 Physically based capillary pressure correlation for mixed-wet reservoirs from a bundle-of-tubes model. SPE, 11, 171–180
2006
-
[32]
& Dullien, F
Dong, M. & Dullien, F. A. L. & Dai, L. & Li, D. 2005 Immiscible Displacement in the Interacting Capillary Bundle Model Part I. Development of Interacting Capillary Bundle Model. Trends Anal. Chem. 59, 1–18. 23
2005
-
[33]
Skjæveland, S. M. & Siqveland, L. M. & Kjosavik, A. & Thomas, W. L. H. & Virnovsky, G. A. 2000 Capillary pressure correlation for mixed-wet Reservoirs. SPE, 60–67
2000
-
[34]
Xu, W. S. & Luo, P. Y. & Sun, L. & Lin, N. 2016 A Prediction model of the capillary pressure J–function. Plos One 11, 1–9. 24
2016
Reviewed August 14, 2026 · model on record in the stance chip above.
Discussion (0). Continue with ORCID to comment.