REVIEW 2 major objections 6 minor 33 references
Quantifying the AGN-driven outflows in ULIRGs (QUADROS) IV: HST/STIS spectroscopy of the sub-kpc warm outflow in F14394+5332
T0 review · 2 major / 6 minor · reviewed 2026-08-14 · deepseek-v4-flash
Pith's one-line read HST/STIS spectroscopy resolves the sub-kpc warm outflow in the ULIRG F14394+5332E, revealing a compact, turbulent flow accelerated by the AGN wind.
desk verdict First resolved sub-kpc warm outflow in a ULIRG, but the assumed AGN position is the one real soft spot — a 0.2 arcsec shift could push the headline radius over 1 kpc; still a strong, careful paper. read the letter →
The pith
A machine-rendered reading of the paper's core claim, the machinery that carries it, and where it could break.
The reading
What carries the argument
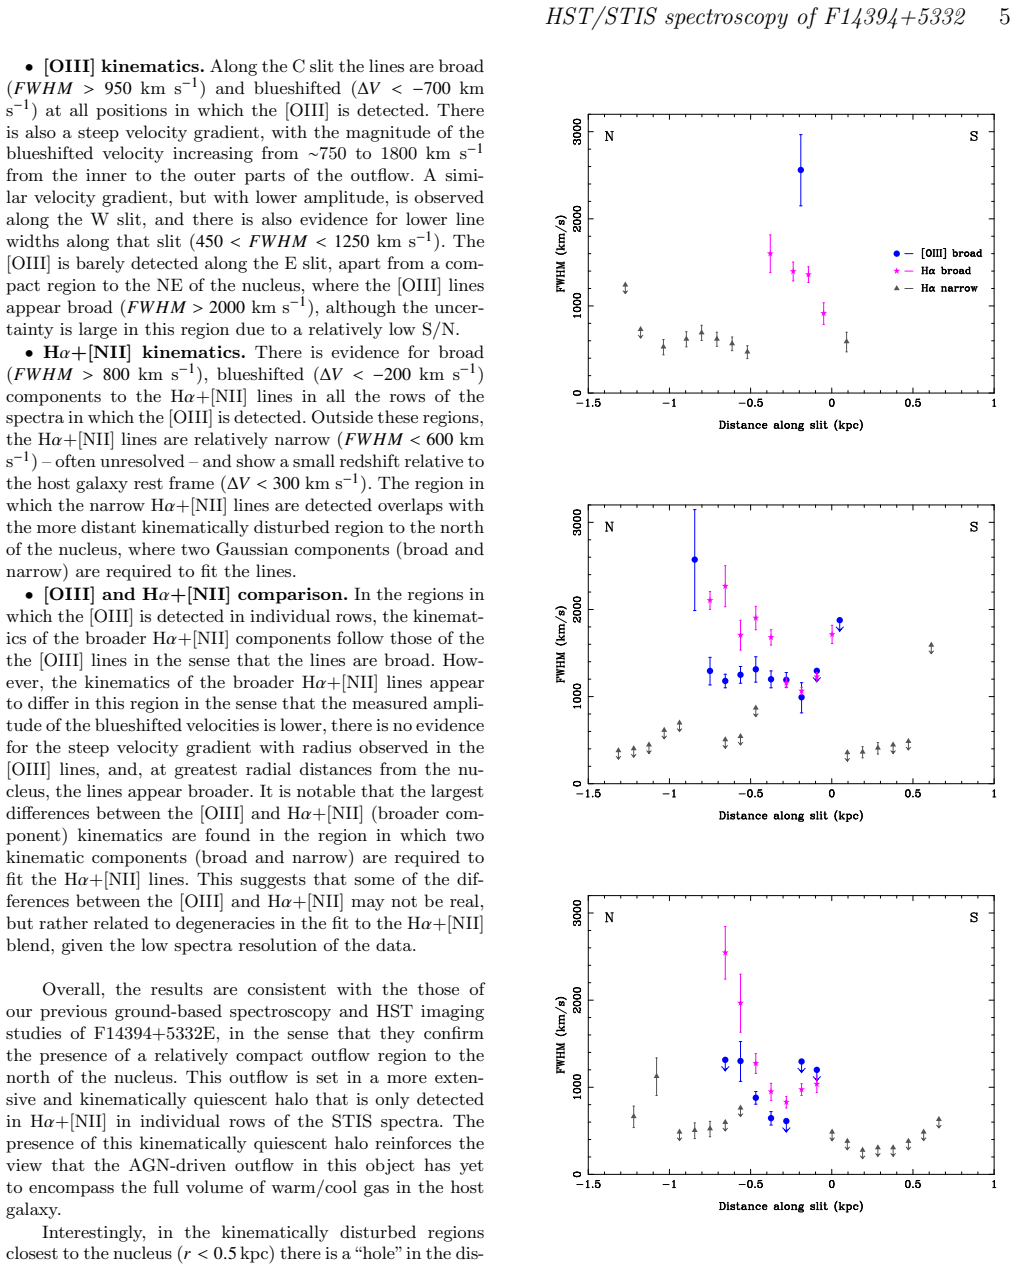
The key object is the spatially resolved emission-line map built from three parallel STIS slits, which lets the authors measure [OIII] and H-alpha+[NII] velocity shifts, line widths, and ionization ratios as functions of projected radius. The load-bearing diagnostic is the steep outward increase in blueshift along with the uniformly large line widths, which distinguishes between true radial acceleration, projection geometry, and local turbulent acceleration. The paper also uses BPT line-ratio diagrams to separate the high-ionization outflow from the lower-ionization quiescent halo, and a mass-conservation equation for the resolved outflow to convert H-alpha luminosities, assumed density, and velocity into local mass outflow rates and kinetic powers.
What would settle it
High-resolution mid-infrared imaging that pins down the true AGN position would test the central claim: if the nucleus is significantly offset from the assumed cross, the measured radial extents and the velocity gradient change. Alternatively, a molecular-gas map or X-ray observation could test the wind-shock interpretation, since the paper predicts any molecular outflow has an extent similar to or smaller than the warm outflow and predicts X-ray emission from hot post-shock gas.
Extended reading notes
Core claim
The central claim is that the warm, AGN-driven outflow in F14394+5332E is compact and turbulent rather than galaxy-scale. At the assumed nucleus, the [OIII] emission is broad and strongly blueshifted throughout a region extending roughly 0.9 kpc to the north, with the projected blueshift increasing steeply outward from about 500 to 1800 km/s while the line width stays high (600–1500 km/s); a fainter H-alpha-emitting halo reaches about 1.4 kpc and is kinematically quiescent with lower ionization. The paper interprets the kinematics as local acceleration of dense clouds by the forward shock of a hot, low-density AGN wind, with the large widths signalling hydrodynamic destruction. A corollary is that the sharp edge of the disturbed region marks the current extent of the shock, so the outflow has not yet engulfed the host galaxy's warm and cool gas.
Load-bearing premise
The paper assumes the AGN lies at a specific point marked on its image, and all radial distances, the outward velocity gradient, and the inferred outflow geometry would shift if the true nucleus were anywhere else.
Editorial extensions
If this is right
- Warm AGN-driven outflows in ULIRGs can be compact (sub-kpc) even in rapidly evolving merger remnants, so they do not necessarily fill the host galaxy's warm and cool gas.
- Mass outflow rates from resolved regions fall around 0.3–0.7 solar masses per year, with upper-limit estimates around 1–3 solar masses per year, only a factor of 2–3 different from spatially integrated values.
- Kinetic coupling efficiencies lie between about 0.0025% and 0.5% of the AGN bolometric luminosity, leaving little room for the warm phase to be the dominant feedback channel.
- The large line widths throughout the outflow favour local acceleration and destruction of clouds by the hot wind over a simple radially accelerating outflow.
- If the outer blueshifts reflect projection geometry, the 1800 km/s velocity measured at the outflow edge is the closest available estimate of the true deprojected outflow speed.
Reading between the lines
- If the projection interpretation is right, studies that use lower mean velocities from unresolved spectra will systematically underestimate the warm outflow's kinetic power, while the compact size limits how much of the galaxy the outflow directly affects.
- The same slit-mapping method applied to more ULIRGs could turn compactness from a single-object finding into a census, and the predicted similarity between warm and molecular outflow extents is directly testable with CO mapping.
- The apparent 'hole' in narrow H-alpha emission near the nucleus suggests a region where all warm gas has been accelerated; comparing such holes across merger stages may trace how the outflow progressively sweeps up the ISM.
Signed reviews
Editorial analysis
A structured set of objections, weighed in public.
Referee Report
Summary. The paper presents HST/STIS long-slit spectroscopy of the ULIRG F14394+5332E, resolving the warm AGN-driven outflow at sub-kpc scales for the first time in a ULIRG. The observations show a compact, high-ionization [OIII] outflow region (r_max ~ 0.9 kpc) embedded in a more extended Halpha-emitting halo (r_max ~ 1.4 kpc) that is kinematically quiescent. The [OIII] lines are broad and blueshifted, with a steep velocity gradient in which the blueshift increases from ~750 to ~1800 km/s along the central slit. The paper interprets the kinematics as evidence for local acceleration and hydrodynamic destruction of clouds in a hot AGN wind, and uses the resolved measurements to estimate mass outflow rates and kinetic powers, finding values within a factor ~2-3 of earlier spatially integrated estimates.
Significance. The result is significant because it provides the first spatially resolved warm outflow in a ULIRG, directly constraining the radial extent, geometry, and velocity structure that earlier ground-based studies could only model. The new STIS data are independent of the model assumptions, and the analysis is careful: standard CALSTIS reduction, explicit treatment of doublets, an instrumental-width correction estimated from narrow-line regions, and candid discussion of Halpha+[NII] fitting degeneracies. The paper also makes falsifiable predictions for future molecular and X-ray observations. If the nuclear-position issue raised below is addressed, the conclusions about compact outflows and modest energetics would support the emerging picture that warm AGN outflows in local ULIRGs are compact and energetically modest.
major comments (2)
- [2 (Observations and Reductions), final paragraph] The zero point for all radial distances and for the velocity gradient is the assumed AGN position at the cross in Figure 1. The text acknowledges that this position is uncertain, but the uncertainty is never quantified. A shift of 0.1-0.2 arcsec (0.19-0.37 kpc) along the slit, which is comparable to the 0.1 arcsec slit separation and several 0.05078 arcsec pixels, changes the [OIII] detection limit from 0.88 kpc to 1.06-1.24 kpc if the true nucleus lies further south, directly affecting the abstract's 'sub-kpc' characterization; it also changes the slope and amplitude of the velocity gradient shown in Figure 3 and the geometric interpretation in Section 4.1. Please add a quantitative sensitivity analysis (for example, shift the zero point by +/-0.1 and +/-0.2 arcsec and recompute the r_max values and gradient fits), and either propagate the resulting systematic uncertainties into the headline claims or temper the 'sub-kpc' and specific radius statements accordingly.
- [4.2, Figures 7 and 8] The open-symbol estimates in Figures 7 and 8 are described as upper limits, but they assume v_out = 1800 km/s and FWHM = 1200 km/s for all spatial regions, even though the measured [OIII] FWHM exceeds 2000 km/s in the compact NE region of the E slit (Section 3.1) and the true velocity could exceed the maximum projected value if projection effects are important. These estimates should be described as 'maximal estimates under a stated set of assumptions' rather than strict upper limits, or the assumptions should be tightened so that the label 'upper limit' is valid. This affects the strength of the conclusion that the kinetic powers remain modest (<0.5% L_bol).
minor comments (6)
- [Abstract and Section 3.1] The abstract states '600 < FWHM < 1500 km/s' throughout the outflow region, but the E-slit [OIII] measurement in Section 3.1 is FWHM > 2000 km/s (with large uncertainty). Please qualify the abstract or explicitly exclude that low-S/N region from the quoted range.
- [Section 2] The sentence describing the spatial registration ('fitting Gaussians to the peak emission in spatial continuum slices') is unclear; please specify how the continuum centroid was measured as a function of wavelength and how the offsets to the assumed nucleus position were determined.
- [Section 3.2] The name 'Baldwin, Philips & Terlevich' should be 'Baldwin, Phillips & Terlevich'.
- [References] The in-text citation 'Mellema et al. 2003' is listed as 'Mellema, Kurk & Rottgering 2002' in the reference list, and 'Revalaski et al. 2018' should be 'Revalski et al. 2018'. Please verify these citations.
- [Figures 3 and 4] No error bars are visible on the plotted kinematic measurements; if uncertainties are not shown, please state this in the captions and give representative uncertainties in the text.
- [Section 4.2] The sentence 'and the Delta-V = -990 km/s assumed by Spence et al.' appears to be missing a comparison word; presumably the broad Halpha velocity shifts are lower in amplitude than -990 km/s.
Circularity Check
No significant circularity: the STIS kinematics are new direct observations, and the adopted density and extinction inputs are independent prior measurements, not re-statements of the paper's conclusions.
full rationale
The derivation chain is self-contained with respect to the paper's new claims. The central result—the spatial extent, line widths, and velocity gradient of the warm outflow—comes directly from the STIS spectra, with velocities referred to a host-galaxy redshift determined from stellar absorption features in Spence et al. (2018) and an instrumental width measured from the data itself. The mass-outflow and kinetic-power estimates use standard formulae (Eqs. 1 and 2) with electron density ne = 3500 cm^-3 and extinction E(B-V) = 0.63 adopted from Spence et al. (2018); these are independent estimates based on trans-auroral ratios, not quantities re-derived from the STIS data, and the paper does not present them as predictions of a model. The upper-limit estimates deliberately set vout = 1800 km/s to the maximum measured [OIII] shift and FWHM = 1200 km/s; this is a transparent data-driven bounding choice, not a fitted parameter disguised as a prediction. The acknowledged uncertainty in the assumed AGN position—'lacking the high resolution mid-IR imaging that might locate the nucleus more accurately... we will assume that the nucleus is located at the position of the cross in Figure 1'—is an observational limitation that affects the calibration of the radial axis, but no conclusion is defined in terms of that assumption in a way that makes an output equal to an input. The prior QUADROS papers are cited for context and for input quantities, but the sub-kpc resolved kinematics are new and stand or fall on the STIS data alone. Therefore no circular step is present.
Assumptions & free parameters
free parameters (2)
- Electron density ne =
3500 cm^-3
- Reddening E(B-V) =
0.63 mag
assumptions (3)
- domain assumption The AGN nucleus is located at the position of the cross in Figure 1, within the dust lane.
- domain assumption The warm gas fills the slit, and following paper I assumption (i), the line widths are interpreted as local velocity dispersion rather than projection effects.
- standard math Case B recombination with T = 10^4 K, Halpha/Hbeta = 2.85, and alpha_Hbeta^eff = 3.03e-14 cm^3 s^-1.
Cite this review
Pith. "Pith review of Quantifying the AGN-driven outflows in ULIRGs (QUADROS) IV: HST/STIS spectroscopy of the sub-kpc warm outflow in F14394+5332." pith.science (2026). https://pith.science/paper/MVYM7GTO
@misc{pith2026190803104,
  author       = {Pith},
  title        = {Pith review of: Quantifying the AGN-driven outflows in ULIRGs (QUADROS) IV: HST/STIS spectroscopy of the sub-kpc warm outflow in F14394+5332},
  year         = {2026},
  howpublished = {\url{https://pith.science/paper/MVYM7GTO}},
  note         = {Machine review of arXiv:1908.03104}
}
read the original abstract
Considerable uncertainties remain about the nature of warm, AGN-driven outflows and their impact on the evolution of galaxies. This is because the outflows are often unresolved in ground-based observations. As part of a project to study the AGN outflows in some of the most rapidly evolving galaxies in the local Universe, here we present HST/STIS observations of F14394+5332E that resolve the sub-kpc warm outflow for the first time in a ULIRG. The observations reveal a compact, high-ionization outflow region (r_max~0.9 kpc) set in a more extensive (r_max~1.4 kpc) halo that is kinematically quiescent and has a lower ionization state. A large line width (600 < FWHM < 1500 km/s) is measured throughout the outflow region, and the outflowing gas shows a steep velocity gradient with radius, with the magnitude of the blueshifted velocities increasing from ~500 to 1800 km/s from the inner to the outer part of the outflow. We interpret the observations in terms of the local acceleration, and hydrodynamic destruction, of dense clouds as they are swept up in a hot, low density wind driven by the AGN. We discuss the implications for measuring the mass outflow rates and kinetic powers for the AGN-driven outflows in such objects.
Figures


Figures from the paper (5 more)


Reference graph
Works this paper leans on
-
[1]
Arribas, S., Colina, L., Bellocchi, E., Maiolini, R., Villar-Mart\'in, M., 2014, A&A, 568, 14
work page 2014
-
[2]
Baldwin, J.A., Phillips, M.M., Terlevich, R., 1981, PASP, 93, 5
work page 1981
-
[3]
Bellocchi, E., Arribas, S., Colina, L., Miralles-Caballero, D., 2013, A&A, 557, 59
work page 2013
-
[4]
Cicone, C., et al., 2014, A&A, 562, 21
work page 2014
-
[5]
Ma, C-P., 2012, MNRAS, 420, 2221
DeBuhr, J., Quartaert, E. Ma, C-P., 2012, MNRAS, 420, 2221
work page 2012
-
[6]
di Matteo, T., Springel, V., Hernquist, L., 2005, Nature, 433, 604
work page 2005
-
[7]
Fabian, A., 1999, MNRAS, 308, L39
work page 1999
- [8]
Show all 33 references
-
[9]
et al., 2018, ApJ, 856, 102
Fischer, T.C. et al., 2018, ApJ, 856, 102
2018
-
[10]
Gonzalez-Alfonso, E., et al., 2017, ApJ, 836, 11
2017
-
[11]
M., Costa, T., Tadhunter, C.N., Flutsch, A., Kakkad, D., Perna, M., Vietri, G., 2018, NatAs, 2, 198
Harrison, C. M., Costa, T., Tadhunter, C.N., Flutsch, A., Kakkad, D., Perna, M., Vietri, G., 2018, NatAs, 2, 198
2018
-
[12]
Johansson, P.H., Naab, T., Burkert, A., 2009, ApJ, 690, 802
2009
-
[13]
J., Groves, B., Kauffmann, G., Heckman, T., 2006, MNRAS, 372, 961
Kewley, L. J., Groves, B., Kauffmann, G., Heckman, T., 2006, MNRAS, 372, 961
2006
-
[14]
C., Veilleux, S., Sanders D
Kim D. C., Veilleux, S., Sanders D. B., 2002, ApJSS,143, 277
2002
-
[15]
Klein, R.I., McKee, C.F., Colella, P., 1994, ApJ, 420, 213
1994
-
[16]
King, A.R., Pounds, K.A., 2015, ARA&A, 53,115
2015
-
[17]
J., Taniguchi Y., Zheng W., Tsvetanov Z., Carranza G., Dottori H., 2003, MNRAS, 340, 289
Lipari S., Terlevich R., Diaz R. J., Taniguchi Y., Zheng W., Tsvetanov Z., Carranza G., Dottori H., 2003, MNRAS, 340, 289
2003
-
[18]
2002, A&A 395, L13
Mellema G., Kurk J.D., Rottgering H.J.A. 2002, A&A 395, L13
2002
-
[19]
Morganti, R., Oosterloo, T., Oonk, J.B.R., Frieswijk, W., Tadhunter, C., 2015, A&A, 580, 1
2015
-
[20]
Osterbrock, D.E., Ferland, G.J., 2006, Astrophysics of Gaseous Nebulae and Active Galactic Nuclei, 2nd edn, University Science Books, Sausalito, CA
2006
-
[21]
et al., 2018, ApJ, 867, 88
Revalski, M. et al., 2018, ApJ, 867, 88
2018
-
[22]
Richings, A.J., Faucher-Gigu\'ere, C-A., 2018, MNRAS, 478, 3100
2018
-
[23]
N., Rose, M., Holt, J., 2013, MNRAS, 432, 138
Rodr\' i guez Zaur\' i n, J., Tadhunter, C. N., Rose, M., Holt, J., 2013, MNRAS, 432, 138
2013
-
[24]
Rose, M., Tadhunter, C., Ramos Almeida, C., Rodr\'iguez Zaur\'in, J., Santoro, F., Spence, R., 2018, MNRAS, 474, 128 (Paper II)
2018
-
[25]
Rupke, D. S. N., Veilleux, S., 2013, ApJ, 768, 75
2013
-
[26]
B., Mirabel, I
Sanders, D. B., Mirabel, I. F., 1996, ARA&A, 34, 749
1996
-
[27]
Santoro, F., Oonk, J.B.R., Morganti, R., Oosterloo, T.A., Tadhunter, C., 2016, A&A, 590, 37
2016
-
[28]
Santoro, F., Rose, M., Morganti, R., Tadhunter, C., Oosterloo, T.A., Holt, J., 2018, A&A, 617, 139
2018
-
[29]
Spence, R., Tadhunter, C.N., Rose, M., Rodr\'iguez Zaur\'in, J., 2018, MNRAS, 478, 2438 (Paper III)
2018
-
[30]
Tadhunter, C.N., Morganti, R., Rose, M., Oonk, J.B.R., Oosterloo, T., 2014, Nature, 511, 440
2014
-
[31]
Tadhunter, C., Rodríguez Zaurín, J., Rose, M.; Spence, R.A.W., Batcheldor, D., Berg, M.A., Ramos Almeida, C., Spoon, H.W.W., Sparks, W., Chiaberge, M., 2018, MNRAS, 478, 1558 (Paper II)
2018
-
[32]
Veilleux, S., Cecil, G., Bland-Hawthorn, J., ARA&A, 43, 769
-
[33]
Veilleux, S., Bolatto, A., Tombesi, F., Mel\'endez, M., Sturn, E., Gonz\'ales-Alfonso, E., Fischer, J., Rupie, D.S.N., 2017, ApJ, 843, 18
2017
Reviewed August 14, 2026 · model on record in the stance chip above.
Discussion (0). Continue with ORCID to comment.