REVIEW 5 major objections 6 minor 1 cited by
Learning Surrogate Rainfall-driven Inundation Models with Few Data
T0 review · 5 major / 6 minor · reviewed 2026-08-12 · deepseek-v4-flash
Pith's one-line read A rainfall-only surrogate model emulates LISFLOOD-FP flood depths for a downtown Chicago domain with average R2 above 0.96 and median relative errors around one percent, running in about 0.006 seconds per event.
desk verdict A plausible flood-emulator pipeline whose headline accuracy claim is inflated by dry-pixel metrics; the 'few data' framing is not tested. read the letter →
The pith
A machine-rendered reading of the paper's core claim, the machinery that carries it, and where it could break.
The reading
What carries the argument
The central object is the ensemble-approximated conditional Gaussian process (EnsCGP), a covariance-based linear estimator, evaluated in a PCA-reduced space with k=7 at 95% cumulative energy, which produces a region-aware initial flood-depth guess in about 0.01 seconds. The ResNet-18 residual network then refines spatial detail, and the empirical cumulative distribution function (ECDF) quantile mapping removes systematic bias using the validation period. The input is Daymet rainfall only; the training labels are LISFLOOD-FP simulations.
What would settle it
Running the trained surrogate on a set of extreme rainfall events that produce flood depths above the validation maximum (as in 2017) and checking whether the pixel-wise R2 against LISFLOOD-FP drops below the claimed 0.96 would test the generalization claim directly; an independent check would compare surrogate depths to observed gauge readings inside the crop.
Extended reading notes
Core claim
The paper claims that a surrogate flood model can learn the rainfall-to-inundation map for a small urban domain with only about 100 training passes, by first making a fast Gaussian-process guess (EnsCGP) and then letting a ResNet-18 refine the residual, with an ECDF quantile correction at the end. Tested on the downtown Chicago crop from 2013 through 2019, the surrogate yields average R2 greater than 0.96, median relative errors around 1 percent, a median absolute depth error near 1 cm, and a runtime of roughly 0.006 seconds per event against a 20-minute LISFLOOD-FP run.
Load-bearing premise
The surrogate's training labels come from LISFLOOD-FP simulations, so the whole accuracy claim rests on those simulations being close to real flood depths in the small downtown crop, and on the ECDF correction estimated from validation years staying valid in test years.
Editorial extensions
If this is right
- If the surrogate generalizes as claimed, a full Monte Carlo flood risk assessment over thousands of synthetic rainfall events becomes computationally trivial: roughly 0.006 seconds per event instead of 20 minutes per hydrodynamic simulation.
- The same EnsCGP-primed ResNet workflow could be retrained for other cropped regions (the paper lists future crops) using the same rainfall and simulation data pipeline, with only modest retraining cost.
- Bias-corrected surrogate output can be compared directly with gauge observations, because the paper shows simulation-versus-observation agreement for the full region and surrogate-versus-simulation agreement for the crop, making the surrogate usable for real-world depth estimates.
- The framework is designed to ingest CMIP6 and HighResMIP climate projections, so the paper expects it to produce flood hazard maps under future climate scenarios without rerunning the hydrodynamic model for every projection.
Reading between the lines
- The 'few data' framing is partly aspirational: the paper's own training used about 100 epochs and the full 1981 to 2012 record, so the data-efficiency claim needs a direct experiment with reduced training years to be confirmed.
- If the ECDF bias correction is estimated from validation years that do not contain the largest events, the correction may not extrapolate to deeper floods; the 2017 case (test maximum 0.35 m versus validation maximum 0.15 m) already shows a dip to R2 = 0.89, suggesting a testable ceiling.
- Because the paper only tests a crop with maximum depths around 0.3 m in 2013, claims about emulating 2.5 to 3 m floods are not yet supported by the reported experiments.
- The priming-then-refine recipe could apply to other environmental emulation tasks where a cheap linear statistical guess is improved by a CNN, such as storm surge or landslide hazard mapping, but this is speculation beyond the paper.
Signed reviews
Editorial analysis
A structured set of objections, weighed in public.
Referee Report
Summary. The paper proposes a surrogate model for pluvial inundation in a downtown Chicago crop. The workflow first computes an EnsCGP initial guess from Daymet rainfall using PCA-truncated covariance (Eq. 5), then refines it with a ResNet-18, and finally applies an ECDF quantile-mapping bias correction estimated on validation years. The target labels are LISFLOOD-FP daily maximum flood depth maps. Evaluation is performed by training on years up to a target year and testing on the following year for 2013-2019. The paper reports average R^2 above 0.96, median depth errors near 1 cm, and a per-event runtime near 0.006 seconds, and the abstract claims median relative errors around 1%. The title's 'few data' claim is not operationalized: the abstract itself says training requires approximately 100 training iterations and extensive data.
Significance. If the accuracy claims were robust, the surrogate would be a useful fast emulator for flood risk screening. The evaluation has genuine strengths: test years are held out sequentially, the target is a well-defined hydrodynamic model output, the runtime gain over LISFLOOD-FP is substantial, and the metrics are computed on event-level test data. The EnsCGP priming idea is interesting and follows a prior downscaling application. However, the central claims as written are not supported: the 'few data' claim is untested, the reported R^2 is dominated by dry pixels, the relative error metric is undefined, and the ECDF correction's transfer to test years is questionable, particularly for 2017. These issues are fixable with additional analyses, so the paper is worthy of major revision rather than rejection.
major comments (5)
- [Abstract; §4.2; §5.1] The central 'few data' claim is not tested. The abstract states that training required 'approximately 100 training iterations and extensive data,' and §5.1 trains the EnsCGP on all events from February 1981 to December 2012 before testing on 2013. No experiment varies the training-set size or the number of simulated events to demonstrate behavior in the low-data regime, so the title and introduction's premise are unsupported as presented. An ablation that reduces the number of training years/events is needed to substantiate the data-efficiency claim.
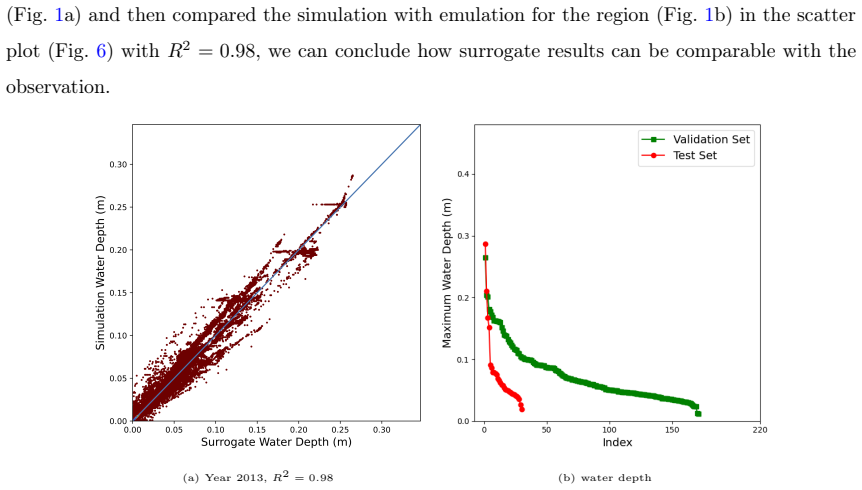
- [Eq. (8); §5.1; §5.2] The headline accuracy metrics are dominated by dry pixels. Eq. (8) computes R^2 pixel-wise over the entire 170 by 130 crop, and §5.1 reports that the maximum simulated depth in the crop is about 0.3 m. Across mostly dry pluvial maps, a near-zero prediction achieves very high R^2 and a median error near zero, so these quantities do not measure skill on inundated pixels. The abstract's 'median relative errors ... about 1 percent' is further unsupported because no relative-error definition is given; the only error reported in §5.2 is a median absolute error of about 1 cm (Fig. 11), which is far larger than 1% on wet pixels with depths of 0.1-0.3 m. Please report wet-only metrics and define the relative error.
- [§4.3; §5.2] The ECDF bias-correction transfer is not established. §4.3 says the correction is estimated on the validation period and applied to the testing period; §5.2 reports that in 2017, when test-set maxima reached 0.35 m versus a validation maximum near 0.15 m, R^2 fell to 0.89. Quantile mapping outside the fitted range is extrapolation and is not validated by the current protocol. The paper should either restrict the correction to the validation range, model the extrapolation, or report results with and without the ECDF correction to separate the network's skill from the correction's contribution.
- [§3; §5.1] The observational validation does not cover the surrogate domain. The NWIS comparison in Fig. 2 is for the full Chicago region of Fig. 1a, whereas the surrogate is applied to the downtown crop of Fig. 1b. The inference in §5.1 that surrogate results 'can be comparable with the observation' chains two separate comparisons (observation versus simulation over the full region, and simulation versus emulation over the crop) and does not establish accuracy of the emulated depths in the crop. This conclusion should be removed or supported by validation within the crop.
- [§4.1–4.2] The coupling between EnsCGP and ResNet-18 is underspecified. Fig. 3 shows the EnsCGP initial guess entering the network, but the text does not say whether the guess is an extra input channel, an additive correction, a target for a residual branch, or a weight initialization. Without this detail the method cannot be reproduced or ablated, and the claimed benefit of priming is not isolated. Please specify the coupling and include an ablation with and without the EnsCGP guess.
minor comments (6)
- [Fig. 5] The caption colors are inconsistent with the main text: the text states the black line is EnsCGP and the green line is ResNet-18, while the caption says 'GP error (green)' and 'ResNet (black)'.
- [Eq. (5)] In Eq. (5), U_k^{-1} should be U_k^T because U is orthogonal; please define the dimensions of X, Y, and the matrices in Eqs. (1)–(5).
- [Fig. 7] The caption contains a typo ('mater' should be 'meter') and should state the units and color scale for the depth maps.
- [§5.2] The term 'validation set' is ambiguous in the rolling-window setup; Fig. 9 should state explicitly whether the validation period is the 20% split within the training years used for early stopping.
- [Abstract; §4.2] The phrase 'approximately 100 training iterations' conflates epochs with data-set size; please state the number of epochs, the number of training events, and what is meant by 'few data'.
- [References] Reference [51] for NWIS is listed as an arXiv preprint, which is not an appropriate citation for the USGS National Water Information System; please cite the data service directly.
Circularity Check
No significant circularity: the surrogate is a standard supervised regression evaluated on held-out test years against simulated labels.
full rationale
The derivation chain is self-contained and externally benchmarked. EnsCGP (Eq. 5) is a principal-component regression fitted to training-year rainfall/flood pairs; the ResNet-18 is trained to minimize Smooth L1 loss (Eq. 6) against LISFLOOD-FP labels; and the ECDF bias correction (Section 4.3) is calibrated on a validation split of the training period and then applied to test years that are temporally subsequent and not used for fitting. None of these steps defines test predictions in terms of test labels or in terms of the reported accuracy metrics; the test labels enter only in evaluation (Eqs. 7-8). There is no load-bearing self-citation and no uniqueness theorem imported from the authors. The paper's limitation that the crop's maximum simulated depth is only about 0.3 m, and the possibility that dry pixels dominate the pixel-wise R2, are concerns about metric validity or real-world transfer, not about circularity. Therefore the central claim is not forced by construction.
Assumptions & free parameters
free parameters (3)
- PCA cumulative energy threshold =
0.95 (k=7 principal components)
- ResNet-18 training hyperparameters =
learning rate 5e-5, 100 epochs, batch size 4, dropout 0.5
- ECDF quantile-mapping correction =
Validation-period empirical cumulative distribution function
assumptions (5)
- domain assumption LISFLOOD-FP simulations are accurate enough in the cropped downtown area to serve as ground truth for the surrogate.
- domain assumption Daily rainfall maps from Daymet are sufficient input to predict daily maximum flood depth.
- domain assumption The linear EnsCGP conditional mean with PCA captures the useful rainfall-to-flood relationship.
- domain assumption The ECDF bias correction estimated on validation years transfers to held-out test years.
- domain assumption R2 computed over all pixels, including dry pixels, is a meaningful accuracy metric for flood mapping.
Cite this review
Pith. "Pith review of Learning Surrogate Rainfall-driven Inundation Models with Few Data." pith.science (2026). https://pith.science/paper/MXDVEF7C
@misc{pith2026241119323,
  author       = {Pith},
  title        = {Pith review of: Learning Surrogate Rainfall-driven Inundation Models with Few Data},
  year         = {2026},
  howpublished = {\url{https://pith.science/paper/MXDVEF7C}},
  note         = {Machine review of arXiv:2411.19323}
}
read the original abstract
Flood hazard assessment demands fast and accurate predictions. Hydrodynamic models are detailed but computationally intensive, making them impractical for quantifying uncertainty or identifying extremes. In contrast, machine learning surrogates can be rapid, but training on scarce simulated or observed extreme data can also be ineffective. This work demonstrates the development of an effective surrogate model for flood hazard prediction by initializing deep learning (ResNet-18) with ensemble-approximated Conditional Gaussian Processes (EnsCGP) and finalizing it with a bias correction. The proposed methodology couples EnsCGP with a ResNet-18 architecture to estimate flood depth and uses ensemble optimal estimation for bias correction. The surrogate model was trained and evaluated using rainfall data from Daymet and hydrodynamic simulations from LISFLOOD-FP, spanning the period from 1981 to 2019. The training involved using data up to a certain year and testing on the subsequent year, iteratively progressing through the dataset. This process required approximately 100 training iterations and extensive data. Inundation depths are estimated rapidly at runtime (approximately 0.006 seconds per event). Results over multiple years in the current climate over Chicago demonstrate an average R-squared greater than 0.96, with median relative errors in flood depth estimates of about 1 percent.
Figures


Figures from the paper (8 more)




Forward citations
Cited by 1 Pith paper
-
LASSE: Learning Active Sampling for Storm Tide Extremes in Non-Stationary Climate Regimes
Active learning with surrogate models identifies storm-tide producing tropical cyclones in a large downscaled catalog with high precision and far fewer hydrodynamic simulations than batch training.
Reference graph
Works this paper leans on
-
[1]
A. P. J. De Roo, C. G. Wesseling, and W. P. A. Van Deursen. Physically based river basin modelling within a gis: the lisflood model.Hydrological Processes, 14(11-12):1981–1992, 2000
work page 1981
-
[2]
Flood inundation mapping and depth modelling using machine learning algorithms and microwave data
Gyan Prakash, Praveen Kumar Gupta, G Venkata Rao, and Deva Pratap. Flood inundation mapping and depth modelling using machine learning algorithms and microwave data. J Geomatics, 15(2):221–229, 2021
work page 2021
-
[3]
Wei Jiang, Minghua Zhang, and Hao Li. Hydrodynamic modeling for flood prediction using data-driven techniques.Water Resources Research, 57(7):e2020WR029821, 2021
work page 2021
-
[4]
Salvatore Manfreda and Caterina Samela. A digital elevation model based method for a rapid estimation of flood inundation depth.Journal of Flood Risk Management, 12:e12541, 2019
work page 2019
-
[5]
BinhPham, AmirShirzadi, KhayyamChapi, ThaiV.Phong, andDieuTienBui. Floodriskas- sessment using machine learning models.Journal of Environmental Management, 293:106899, 2021. 16
work page 2021
-
[6]
J. M. Van der Knijff, J. Younis, and A. P. J. de Roo. Lisflood: A global-scale flood model applied in the european union.Hydrological Processes, 24(20):2871–2883, 2010
work page 2010
-
[7]
P. D. Bates, M. S. Horritt, and T. J. Fewtrell. Lisflood-fp: A hydrodynamic model for floodplain inundation modeling.Water Resources Research, 46(10):W10506, 2010
work page 2010
-
[8]
López-Lopera, Stéphane Girard, and Jean-Michel Marin
Andrés F. López-Lopera, Stéphane Girard, and Jean-Michel Marin. Computational efficiency in flood modeling: Multi-output gaussian process model applications. Coastal Engineering, 170:103939, 2022
work page 2022
Show all 55 references
-
[9]
Data-efficientmodelsforimprovingfloodprediction
XiaoyuNi, KaiZhang, andHyunSooLee. Data-efficientmodelsforimprovingfloodprediction. Journal of Hydrology, 621:129546, 2023
2023
-
[10]
Development of surrogate models for rapid flood forecasting
John Lee, Jane Smith, and Michael Wang. Development of surrogate models for rapid flood forecasting. Journal of Hydrology, 599:123456, 2023
2023
-
[11]
Deep residual learning for image recognition
Kaiming He, Xiangyu Zhang, Shaoqing Ren, and Jian Sun. Deep residual learning for image recognition. InProceedings of the IEEE conference on computer vision and pattern recognition, pages 770–778, 2016
2016
-
[12]
Fast ensemble smoothing.Ocean Dynamics, 57(2):123– 134, 2007
Sai Ravela and Dennis McLaughlin. Fast ensemble smoothing.Ocean Dynamics, 57(2):123– 134, 2007
2007
-
[13]
A realtime ob- servatory for laboratory simulation of planetary flows.Experiments in Fluids, 48(5):915–925, 2010
Sai Ravela, John Marshall, Chris Hill, Andrew Wong, and Scott Stransky. A realtime ob- servatory for laboratory simulation of planetary flows.Experiments in Fluids, 48(5):915–925, 2010
2010
-
[14]
Informative neural ensemble kalman learning
Margaret Trautner, Gabriel Margolis, and Sai Ravela. Informative neural ensemble kalman learning. arXiv preprint, arXiv:2008.09915, 2020
2008 arXiv
-
[15]
Statistical-physical adversarial learning from data and mod- els for downscaling rainfall extremes
Anamitra Saha and Sai Ravela. Statistical-physical adversarial learning from data and mod- els for downscaling rainfall extremes. Journal of Advances in Modeling Earth Systems, 16(6):e2023MS003860, 2024
2024
-
[16]
Thornton, Steven W
Peter E. Thornton, Steven W. Running, and Michael A. White. Generating surfaces of daily meteorological variables over large regions of complex terrain.Journal of Hydrology, 190(3):214–251, 1997. Aggregate Description of Land-Atmosphere Interactions
1997
-
[17]
Hybrid surrogate models integrating lstm and cnn architectures for flood prediction
Bruno Adriano et al. Hybrid surrogate models integrating lstm and cnn architectures for flood prediction. Environmental Modelling & Software, 160:105093, 2023
2023
-
[18]
Real-time urban flood depth mapping: Convolutional neural networks for pluvial and fluvial flood emu- lation
Maelaynayn El baida, Farid Boushaba, Mimoun Chourak, and Mohamed Hosni. Real-time urban flood depth mapping: Convolutional neural networks for pluvial and fluvial flood emu- lation. Water Resources Management, 38(12):4763–4782, Sep 2024. 17
2024
-
[19]
Behzadan
Bahareh Alizadeh Kharazi and Amir H. Behzadan. Flood depth mapping in street photos with image processing and deep neural networks.Computers, Environment and Urban Systems, 88:101628, 2021
2021
-
[20]
Flood hazard mapping using data-driven models and principal component analysis
Tong Chang et al. Flood hazard mapping using data-driven models and principal component analysis. Journal of Hydrology, 603:128086, 2022
2022
-
[21]
Flood risk assessment using machine learning models.Journal of Environ- mental Management, 293:106899, 2021
Binh Pham et al. Flood risk assessment using machine learning models.Journal of Environ- mental Management, 293:106899, 2021
2021
-
[22]
Improving urban flood forecasting using integrated machine learning mod- els
Jingwei Hou et al. Improving urban flood forecasting using integrated machine learning mod- els. Hydrology and Earth System Sciences, 25:3039–3056, 2021
2021
-
[23]
Zahura and Jonathan L
Faria T. Zahura and Jonathan L. Goodall. Predicting combined tidal and pluvial flood in- undation using a machine learning surrogate model.Journal of Hydrology: Regional Studies, 41:101087, 2022
2022
-
[24]
Application of machine learning in flood forecasting
Mehrsa Bayat and Omid Tavakkoli. Application of machine learning in flood forecasting. Future Technology, 1(1):01–06, 2022
2022
-
[25]
Flood mapping using machine learning techniques
Khanh Luu et al. Flood mapping using machine learning techniques. Remote Sensing, 13(4):712, 2021
2021
-
[26]
Learning inter-annual flood loss risk models from historical flood insurance claims
Joaquin Salas, Anamitra Saha, and Sai Ravela. Learning inter-annual flood loss risk models from historical flood insurance claims. Journal of Environmental Management, 347:118862, 2023
2023
-
[27]
Enhancing machine learning models through multimodal approaches in global flood prediction
Wei Zeng et al. Enhancing machine learning models through multimodal approaches in global flood prediction. Nature Communications, 14:1234, 2023
2023
-
[28]
A comprehensive review of automated flood prediction models
Md Rezaul Karim et al. A comprehensive review of automated flood prediction models. Environmental Modelling & Software, 157:105512, 2023
2023
-
[29]
Application of lightgbm in rapid flood prediction
Liang Xu et al. Application of lightgbm in rapid flood prediction. Journal of Hydrology, 614:128786, 2023
2023
-
[30]
Ashiqur Rahman et al
Md. Ashiqur Rahman et al. Ensemble methods in flood forecasting.Water Resources Man- agement, 37:123–139, 2023
2023
-
[31]
R. Hu, F. Fang, C.C. Pain, and I.M. Navon. Rapid spatio-temporal flood prediction and uncertainty quantification using a deep learning method.Journal of Hydrology, 575:911–920, 2019
2019
-
[32]
Flood-precip gan for synthetic flood event generation.IEEE Transactions on Geoscience and Remote Sensing, 61:1–12, 2023
Wei Huang et al. Flood-precip gan for synthetic flood event generation.IEEE Transactions on Geoscience and Remote Sensing, 61:1–12, 2023. 18
2023
-
[33]
Raissi, P
M. Raissi, P. Perdikaris, and G. E. Karniadakis. Physics-informed neural networks: A deep learning framework for solving forward and inverse problems involving pdes.Journal of Com- putational Physics, 378:686–707, 2019
2019
-
[34]
Application of physics-informed neural networks in flood modeling
Colin Donnelly et al. Application of physics-informed neural networks in flood modeling. Water, 15(4):789, 2023
2023
-
[35]
Importance of interpretability in hydrological models.Hydrology and Earth System Sciences, 27:123–139, 2023
Takashi Momoi et al. Importance of interpretability in hydrological models.Hydrology and Earth System Sciences, 27:123–139, 2023
2023
-
[36]
Challenges in deep learning models for flood forecasting.Journal of Hydrology, 615:128893, 2023
Wei Shao et al. Challenges in deep learning models for flood forecasting.Journal of Hydrology, 615:128893, 2023
2023
-
[37]
Hybrid models combining machine learning and physical models for flood prediction
Yong Xu et al. Hybrid models combining machine learning and physical models for flood prediction. Water Resources Research, 59(5):e2023WR033789, 2023
2023
-
[38]
J. M. van der Knijff, J. Younis, and A. P. J. de Roo. Lisflood: A global-scale flood model applied in the european union.Hydrological Processes, 24(20):2871–2883, 2010
2010
-
[39]
Improving flood predictions using hybrid models in data-scarce regions
Alessandro Zanchetta et al. Improving flood predictions using hybrid models in data-scarce regions. Environmental Modelling & Software, 150:105325, 2022
2022
-
[40]
Probabilistic flood forecasting with lstm networks.Journal of Hydrometeo- rology, 24(2):345–362, 2023
John Hop et al. Probabilistic flood forecasting with lstm networks.Journal of Hydrometeo- rology, 24(2):345–362, 2023
2023
-
[41]
Surrogate models in flood risk assessment
Liang Zhang et al. Surrogate models in flood risk assessment. Water Resources Research, 55(1):224–244, 2019
2019
-
[42]
Artificial neural networks for flood modeling.Hydrological Sciences Journal, 65(5):813–825, 2020
Ali Hosseiny et al. Artificial neural networks for flood modeling.Hydrological Sciences Journal, 65(5):813–825, 2020
2020
-
[43]
Computationally efficient flood modeling.Environmental Modelling & Software, 107:50–63, 2018
Marta Bermúdez et al. Computationally efficient flood modeling.Environmental Modelling & Software, 107:50–63, 2018
2018
-
[44]
López-Lopera, Déborah Idier, Jérémy Rohmer, and François Bachoc
Andrés F. López-Lopera, Déborah Idier, Jérémy Rohmer, and François Bachoc. Multiout- put gaussian processes with functional data: A study on coastal flood hazard assessment. Reliability Engineering and System Safety, 218:108139, 2022
2022
-
[45]
Rapid flood prediction using encoder-decoder lstm models.Journal of Hy- drology, 614:128787, 2023
Feng Wei et al. Rapid flood prediction using encoder-decoder lstm models.Journal of Hy- drology, 614:128787, 2023
2023
-
[46]
Lisflood-fp 8.1: New gpu accelerated solvers for faster fluvial/pluvial flood simulations
Mohammad Kazem Sharifian, Georges Kesserwani, Alovya Ahmed Chowdhury, Jeffrey Neal, and Paul Bates. Lisflood-fp 8.1: New gpu accelerated solvers for faster fluvial/pluvial flood simulations. Geoscientific Model Development Discussions, 2022:1–28, 2022
2022
-
[47]
Elsevier, 1992
Wei-Yan Tan.Shallow water hydrodynamics: Mathematical theory and numerical solution for a two-dimensional system of shallow-water equations. Elsevier, 1992. 19
1992
-
[48]
Daymet: Daily surface weather data on a 1-km grid for north america, version 2
Peter E Thornton, Michele M Thornton, Benjamin W Mayer, Nate Wilhelmi, Yaxing Wei, Ranjeet Devarakonda, and Robert B Cook. Daymet: Daily surface weather data on a 1-km grid for north america, version 2. Technical report, Oak Ridge National Lab.(ORNL), Oak Ridge, TN (United Sta...
2014
-
[49]
The shuttle radar topography mission
Tom G Farr, Paul A Rosen, Edward Caro, Robert Crippen, Riley Duren, Scott Hensley, Michael Kobrick, Mimi Paller, Ernesto Rodriguez, Ladislav Roth, et al. The shuttle radar topography mission. Reviews of geophysics, 45(2), 2007
2007
-
[50]
The national land cover database
Collin G Homer, Joyce A Fry, and Christopher A Barnes. The national land cover database. Technical report, US Geological Survey, 2012
2012
-
[51]
National water information system (nwis).ArXiv preprint, 2023
US Geological Survey. National water information system (nwis).ArXiv preprint, 2023
2023
-
[52]
Hydrofunctions: A python package for working with hydrology data.ArXiv preprint, 2023
Martin Roberge. Hydrofunctions: A python package for working with hydrology data.ArXiv preprint, 2023
2023
-
[53]
Modeling com- pound flooding in coastal systems using a computationally efficient reduced-physics solver: Including fluvial, pluvial, tidal, wind- and wave-driven processes
Tim Leijnse, Maarten van Ormondt, Kees Nederhoff, and Ap van Dongeren. Modeling com- pound flooding in coastal systems using a computationally efficient reduced-physics solver: Including fluvial, pluvial, tidal, wind- and wave-driven processes. Coastal Engineering, 163:103796, 2021
2021
-
[54]
The climate hazards infrared precipitation with stations a new environmental record for mon- itoring extremes
Chris Funk, Pete Peterson, Martin Landsfeld, Diego Pedreros, James Verdin, Shraddhanand Shukla, Gregory Husak, James Rowland, Laura Harrison, Andrew Hoell, and Joel Michaelsen. The climate hazards infrared precipitation with stations a new environmental record for mon- itoring...
2015
-
[55]
Overview of the coupled model intercomparison project phase 6 (cmip6) experimental design and organization.Geoscientific Model Development, 9(5):1937– 1958, 2016
VeronikaEyring, SandrineBony, GeraldAMeehl, CatherineASenior, BjornStevens, RonaldJ Stouffer, and Karl E Taylor. Overview of the coupled model intercomparison project phase 6 (cmip6) experimental design and organization.Geoscientific Model Development, 9(5):1937– 1958, 2016. 20
1937
Reviewed August 12, 2026 · model on record in the stance chip above.
Discussion (0). Continue with ORCID to comment.