Library based identification and characterisation of polymers with nano-FTIR and IR-sSNOM imaging
Pith reviewed 2026-05-25 16:28 UTC · model grok-4.3
The pith
Nano-FTIR spectra enable successful library search identification of all tested polymer samples in under seven minutes per spectrum.
A machine-rendered reading of the paper's core claim, the machinery that carries it, and where it could break.
Core claim
Nano-FTIR data measured in less than seven minutes per spectrum supports reliable library-based identification of polymer types, and the restricted spectral interval 1700-1300 cm^{-1} already differentiates the materials with success rates similar to those achieved by conventional far-field FTIR spectroscopy.
What carries the argument
Library search matching of near-field nano-FTIR spectra against far-field polymer reference libraries, which works because the spectral fingerprints remain sufficiently diagnostic despite the tip-limited sampling volume.
If this is right
- High-resolution domain mapping in polymer blends becomes feasible with automated identification.
- Nanoscale polymer particles in environmental samples can be typed without averaging over larger volumes.
- Measurement protocols can be shortened by using only the 1700-1300 cm^{-1} range while retaining identification power.
- IR-sSNOM imaging can be combined with library search for spatially resolved chemical maps of polymer mixtures.
Where Pith is reading between the lines
- The same approach might allow library identification of other organic or inorganic nanoscale materials if their near-field spectra preserve diagnostic bands.
- Integration with simultaneous AFM topography could produce correlated mechanical and chemical maps at the same locations.
- If the limited-range result holds, portable or faster nano-FTIR systems could be designed around a narrower mid-IR detector window.
Load-bearing premise
Near-field spectra of polymers remain close enough to far-field reference spectra for the library matching routine to return correct identifications even for materials such as polystyrene that are already harder to detect.
What would settle it
A collection of nano-FTIR spectra from verified polymer standards that produce no correct library match or that consistently misidentify the material when the full or restricted spectral window is used.
Figures
read the original abstract
AFM is a technique widely applied in the nanoscale characterisation of polymers and their surface properties. With nano-FTIR and IR-sSNOM imaging an optical dimension is added to this technique that allows for straightforward high resolution characterisation and spectroscopy of polymers. As the volume sampled by these near-field techniques depends mostly on the radius of the cantilever tip, typically 10 nm, it is orders of magnitude smaller than in conventional techniques. Nevertheless, comparability of nano-FTIR near-field spectra and data from macroscopic methods has been shown. Some relevant polymers such as polystyrene however, prove to be more difficult to detect than others. Furthermore, the small sampled volume suggests lower signal quality of nano-FTIR data and proof of its suitability for a reliable library search identification is lacking. To evaluate the techniques especially towards automatic and higher throughput identification of nanoscale polymers, for example in blends or environmental samples, we examined domain distributions in a PS-LDPE film and spectral responses of foils of the most relevant commercial polymers. We demonstrate the successful library search identification of all samples with nano-FTIR data measured in less than seven minutes/spectrum. We discuss aspects affecting the accuracy of the identification and show that already the small spectral range of 1700-1300 cm$^{-1}$ leads to similar success in differentiating between polymer types with near-field data as with conventional far-field FTIR spectroscopy.
Editorial analysis
A structured set of objections, weighed in public.
Referee Report
Summary. The manuscript claims that nano-FTIR spectra acquired in under seven minutes per spectrum enable successful library-based identification of all tested polymer samples (PS-LDPE blend domains and commercial foils), with differentiation performance in the restricted 1700-1300 cm^{-1} window comparable to conventional far-field FTIR, despite the much smaller sampled volume and known detection challenges for some polymers such as polystyrene.
Significance. If the library-matching results hold under quantitative scrutiny, the work would support practical nanoscale polymer identification in blends or environmental samples using near-field techniques, with the short acquisition time and restricted spectral window offering clear throughput advantages. The experimental demonstration against commercial libraries is a strength, but the absence of match metrics leaves the robustness unverified.
major comments (2)
- [Abstract] Abstract: The central claim of 'successful library search identification of all samples' is unsupported by any reported quantitative metrics (match scores, correlation coefficients, similarity thresholds, or false-positive rates). This is load-bearing because the paper explicitly notes detection difficulties for polystyrene and the orders-of-magnitude smaller sampled volume; without these numbers it is impossible to assess whether the library hits are reliable or post-hoc.
- [Methods/Results] Methods/Results (library search procedure): No description is given of the scoring algorithm, acceptance criteria, or how near-field spectra were pre-processed before comparison to the far-field commercial library. This directly affects the reproducibility of the 'successful identification' result and the claim of comparable performance in the 1700-1300 cm^{-1} window.
minor comments (2)
- Figure captions and text should explicitly state the number of spectra acquired per sample and the exact library used (including version or accession numbers) to allow independent verification.
- The abstract states 'we discuss aspects affecting the accuracy of the identification' but the manuscript would benefit from a dedicated subsection or table summarizing those factors with reference to the specific polymers tested.
Simulated Author's Rebuttal
We thank the referee for the constructive comments. The concerns about quantitative support for the library identifications and the lack of procedural details are valid; both will be addressed by expanding the manuscript with additional data and descriptions to strengthen the claims without altering the core experimental results.
read point-by-point responses
-
Referee: [Abstract] Abstract: The central claim of 'successful library search identification of all samples' is unsupported by any reported quantitative metrics (match scores, correlation coefficients, similarity thresholds, or false-positive rates). This is load-bearing because the paper explicitly notes detection difficulties for polystyrene and the orders-of-magnitude smaller sampled volume; without these numbers it is impossible to assess whether the library hits are reliable or post-hoc.
Authors: We agree that explicit quantitative metrics are needed to substantiate the identification claims, especially given the noted challenges with polystyrene and the small sampling volume. The manuscript currently supports the identifications through direct spectral overlays and successful library hits for all tested samples (PS-LDPE domains and commercial foils), but does not tabulate match scores. In revision we will add a results table reporting the library match scores, correlation coefficients, and any similarity thresholds applied for each spectrum, allowing direct assessment of reliability and false-positive risk. revision: yes
-
Referee: [Methods/Results] Methods/Results (library search procedure): No description is given of the scoring algorithm, acceptance criteria, or how near-field spectra were pre-processed before comparison to the far-field commercial library. This directly affects the reproducibility of the 'successful identification' result and the claim of comparable performance in the 1700-1300 cm^{-1} window.
Authors: We concur that a clear description of the library-matching workflow is required for reproducibility. The original text references use of a commercial far-field polymer library but omits algorithmic and preprocessing specifics. We will expand the Methods section to detail the library software's scoring algorithm, the acceptance criteria for positive identification, and all preprocessing steps applied to the nano-FTIR spectra (baseline correction, normalization, and spectral window restriction) before library comparison. This addition will also clarify how performance in the 1700-1300 cm^{-1} window was evaluated relative to full-range far-field FTIR. revision: yes
Circularity Check
No circularity: experimental validation against external libraries
full rationale
The paper presents an experimental demonstration of library-based identification using nano-FTIR spectra measured on polymer samples, matched against commercial far-field FTIR reference libraries. No equations, fitted parameters, predictions, or derivations are described. The central claim rests on direct empirical success rates for identification (including restricted spectral windows), with no reduction of results to self-defined inputs, self-citations, or ansatzes. External commercial libraries provide independent benchmarks, and the work contains no load-bearing self-referential steps of the enumerated kinds.
Axiom & Free-Parameter Ledger
Reference graph
Works this paper leans on
-
[1]
F. Keilmann and R. Hillenbrand, Philos Trans A Math Phys Eng Sci, 2004, 362, 787
work page 2004
-
[2]
F. Huth, A. Govyadinov, S. Amarie, W. Nuansing, F. Keilmann and R. Hillenbrand, Nano Lett, 2012, 12, 3973
work page 2012
-
[3]
R. Hillenbrand and F. Keilmann, Physical Review Letters, 2000, 85, 3029
work page 2000
-
[4]
T. Taubner, R. Hillenbrand and F. Keilmann, Applied Physics Letters, 2004, 85, 5064
work page 2004
- [5]
-
[6]
A. A. Govyadinov, I. Amenabar, F. Huth, P. S. Carney and R. Hillenbrand, J Phys Chem Lett, 2013, 4, 1526
work page 2013
-
[7]
A. Cernescu, M. Szuwarzynski, U. Kwolek, P. Wydro, M. Kepczynski, S. Zapotoczny, M. Nowakowska and L. Quaroni, Anal Chem, 2018, 90, 10179
work page 2018
- [8]
- [9]
-
[10]
I. Amenabar, S. Poly, M. Goikoetxea, W. Nuansing, P. Lasch and R. Hillenbrand, Nat Commun, 2017, 8, 14402
work page 2017
-
[11]
M. R. Jung, F. D. Horgen, S. V. Orski, C. V. Rodriguez, K. L. Beers, G. H. Balazs, T. T. Jones, T. M. Work, K. C. Brignac, S. J. Royer, K. D. Hyrenbach, B. A. Jensen and J. M. Lynch, Mar Pollut Bull, 2018, 127, 704
work page 2018
-
[12]
1999 -03-31 ed.; National I nstitute of Advanced Industrial Science and Technology (AIST), Japan
Polystyrene. 1999 -03-31 ed.; National I nstitute of Advanced Industrial Science and Technology (AIST), Japan
work page 1999
-
[13]
S. Primpke, M. Wirth, C. Lorenz and G. Gerdts, Anal Bioanal Chem, 2018, 410, 5131. 14
work page 2018
-
[14]
S. Primpke, C. Lorenz, R. Rascher-Friesenhausen and G. Gerdts, Analytical Methods, 2017, 9, 1499
work page 2017
-
[15]
R. C. Thompson, Y. Olsen, R. P. Mitchell, A. Davis, S. J. Rowland, A. W. John, D. McGonigle and A. E. Russell, Science, 2004, 304, 838
work page 2004
-
[16]
Wypych, Handbook of Polymers, ChemTec Publishing, 2nd edn., 2016
G. Wypych, Handbook of Polymers, ChemTec Publishing, 2nd edn., 2016
work page 2016
-
[17]
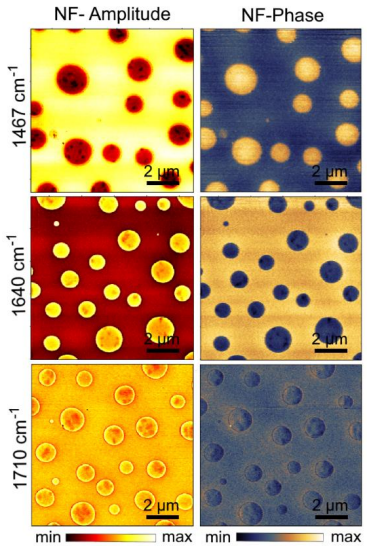
D. Nečas and P. Klapetek, Gwyddion 2.49, 2018. 15 Figure 1. Nano-FTIR scans with a) topography ( z), b) mechanical phase ( φM) and c) NF -amplitude (n = 2) signals of a standard polymer blend sample with spherical LDPE domains in a PS matrix. d) NF -phase (n =
work page 2018
-
[18]
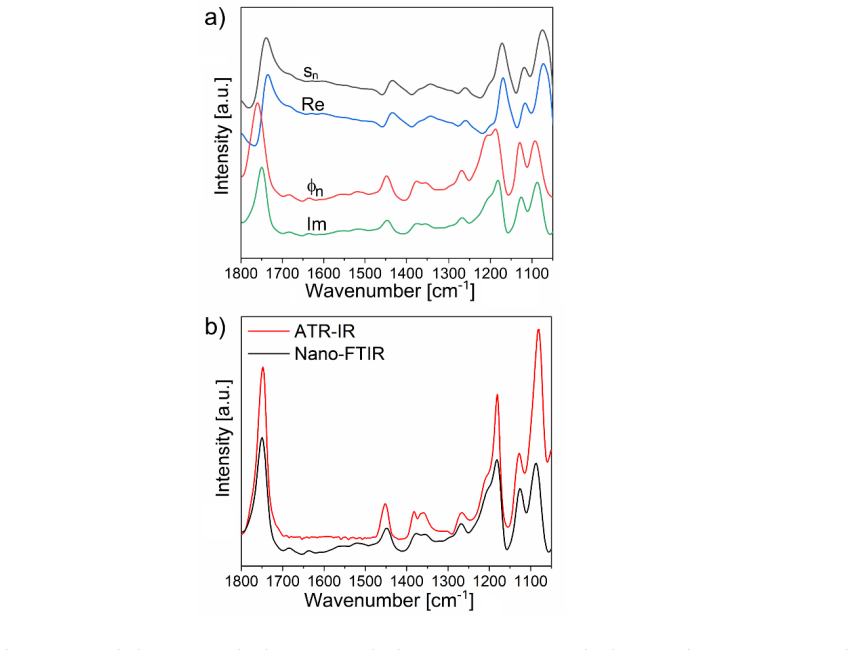
of a line-scan with a resolution of 20 nm through an LDPE domain. e) Nano-FTIR NF-phase point spectra of the different materials in the same spectral region (1700-1300 cm-1). f) and g) zooms of spectra recorded in the upper (A) and lower (B) transition zones. The lower NF-phase peak shifts from 1445 cm-1 to 1460 cm-1 from PS to LDPE. 16 Figure 2. IR-sSNOM...
work page 2000
-
[19]
Anal Bioanal Chem 2018, 410 (21), 5131-5141
Primpke, S.; Wirth, M.; Lorenz, C.; Gerdts, G., Reference database design for the automated analysis of microplastic samples based on Fourier transform infrared (FTIR) spectroscopy. Anal Bioanal Chem 2018, 410 (21), 5131-5141. Color Hit Quality 675 Compound name 4 CAS Number Molecular formula Molecular weight Color File PP new Average of graphs 1,1 2,1 3,...
work page 2018
discussion (0)
Sign in with ORCID, Apple, or X to comment. Anyone can read and Pith papers without signing in.