REVIEW 4 major objections 5 minor 36 references
Inferring differentiation order in adaptive immune responses from population level data
T0 review · 4 major / 5 minor · reviewed 2026-08-14 · deepseek-v4-flash
Pith's one-line read Population-level time courses can identify when memory T cells are made.
desk verdict A genuinely useful adaptation of Buchholz's branching-process framework to cohort data, with an honest internal consistency check, but the multi-dataset Memory First conclusion rests on a curtailment choice that excludes the late-time signal most relevant to the biological question. read the letter →
The pith
A machine-rendered reading of the paper's core claim, the machinery that carries it, and where it could break.
The reading
What carries the argument
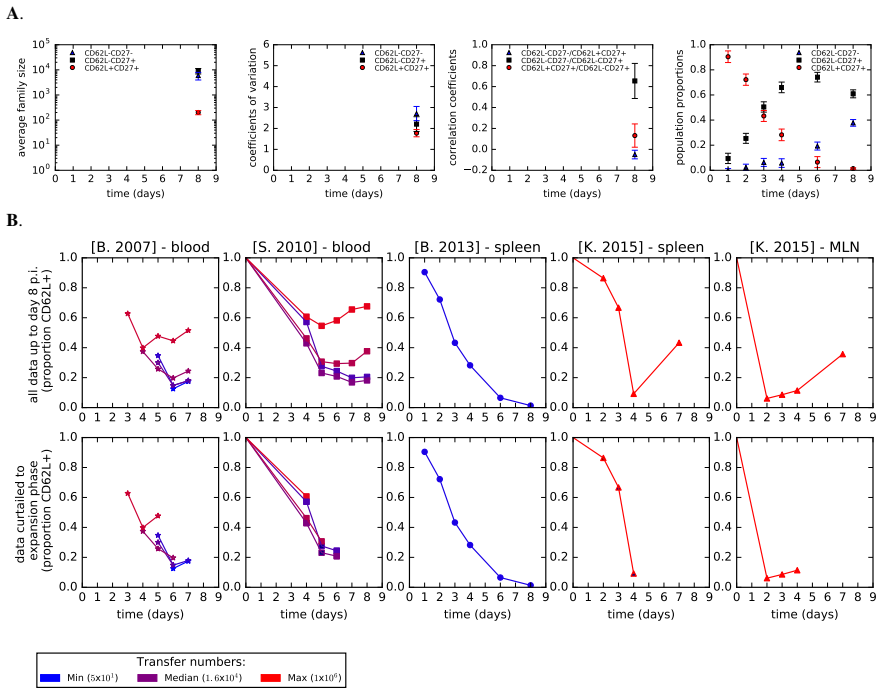
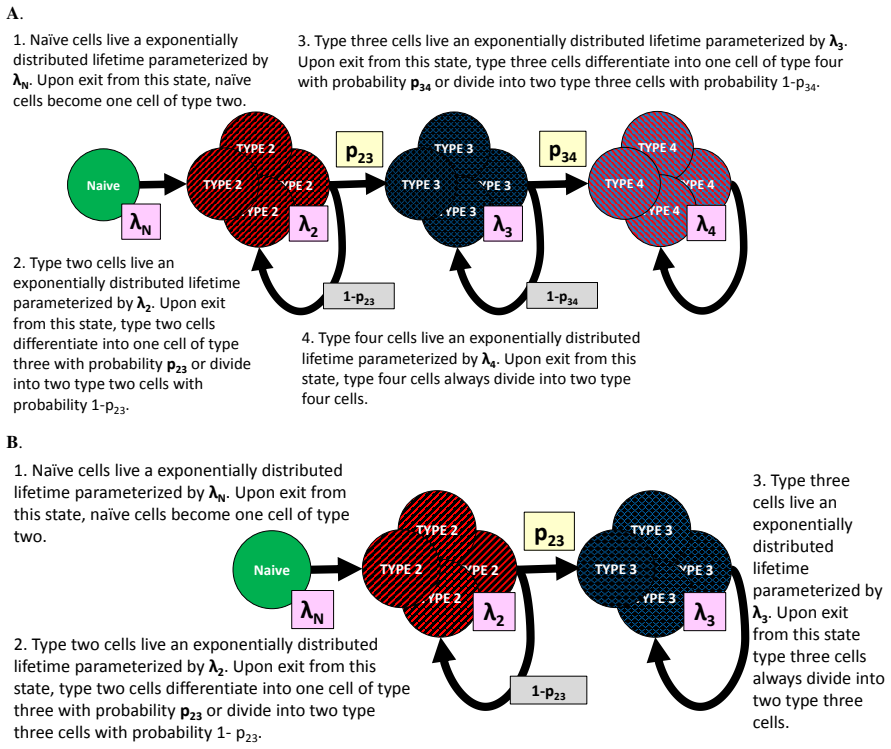
The central object is a multi-type Bellman-Harris branching process: each cell has an exponentially distributed lifetime, then either divides into two cells of its own type or differentiates into another type, with probabilities fixed by a small parameter set. The original version tracked clonal family sizes, variances and correlations at one time point; the adaptation replaces those statistics with cohort-level proportions over time plus an average family size at peak, using a weighted mean-squared-error objective that keeps the exponentially growing population statistic from dominating the proportions. The second load-bearing piece is the log-linear regression linking the number of adoptively transferred cells to the day of peak response, which determines how much of each time-course belongs to the expansion phase.
What would settle it
Use a cell-cycle reporter, as in the real-time tracking experiments cited here, to record the first day on which cells with a memory phenotype appear among non-cycling cells after the expansion peak; if memory-phenotype cells first emerge only after the exponential expansion has ended, the framework's Memory First deduction cannot be right.
Extended reading notes
Core claim
The central claim is that the modeling framework introduced in the 2013 clonal study is robust enough to answer the same biological question when fitted to far more widely available cohort data. Concretely, after replacing the clonal summary statistics with a weighted objective function based on population proportions plus average family size, and after curtailing each dataset to the estimated expansion phase, the Linear Memory First model — memory-precursor cells appear and proliferate before effector cells — is the best fit for all datasets examined, including the original study's own cohort data. The paper is explicit that this conclusion is conditional: it holds within a model that only allows differentiation during strictly exponential expansion with no cell death, and it requires an independent estimate of the day of peak response, which the authors derive by log-linear regression on adoptive-transfer number. Without that peak-day adjustment, the same method gives contradictory rankings, sometimes favouring Effector First.
Load-bearing premise
The argument collapses if memory precursors are created after the strictly exponential expansion phase has ended, or if the fitted day of peak response derived from transfer number is wrong; the paper itself flags both as live concerns.
Editorial extensions
If this is right
- Differentiation-order questions can be screened quickly from cohort time courses alone, without clonal barcoding.
- The original clonal-based conclusion is reinforced: within the expansion-phase assumption, memory precursors precede effector cells.
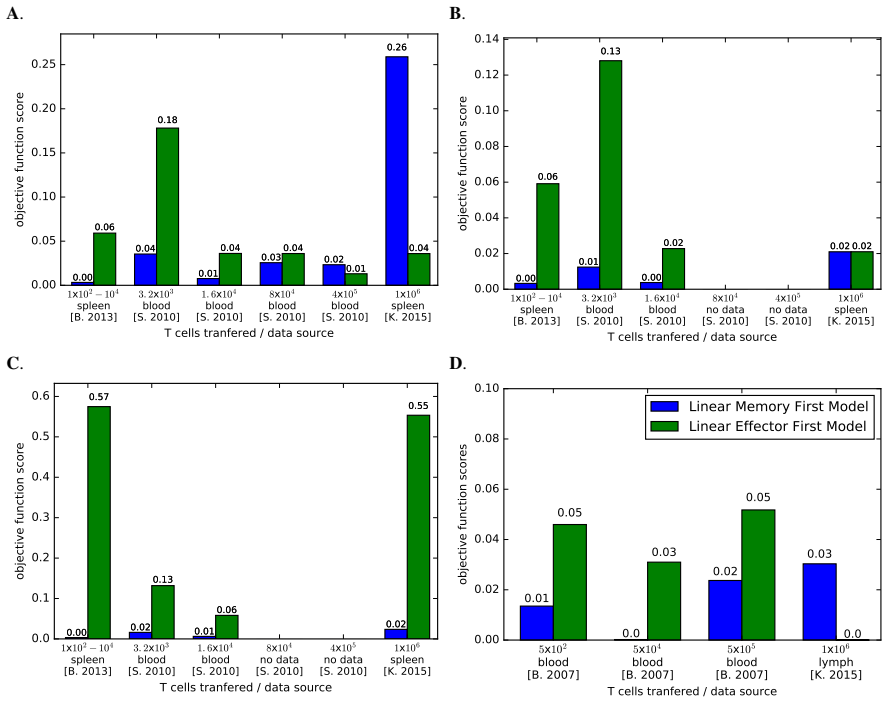
- Precursor transfer number must be controlled: high-transfer experiments shorten the expansion phase, and fitting beyond it reverses the model ranking.
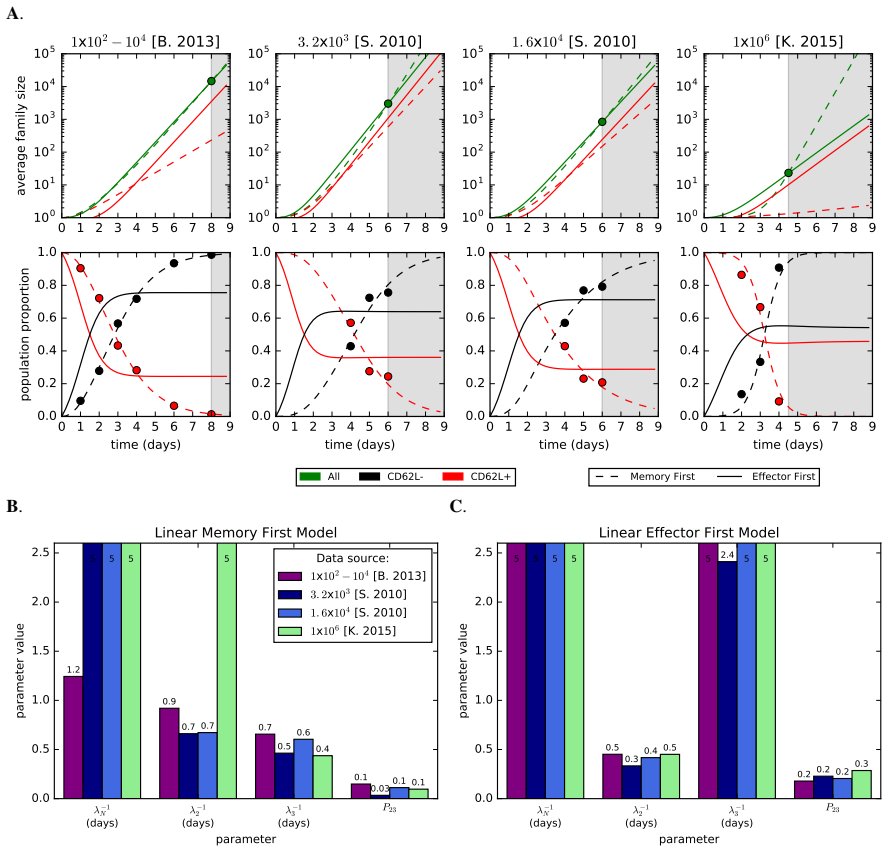
- The framework's parameter estimates are not reliable in detail; most best fits sit on boundary values and imply implausible naive-cell lifetimes.
- Data from lymph nodes may not be analysable by this method because migration breaks the model's assumptions.
Reading between the lines
- If memory generation after the expansion phase is confirmed, the Memory First ranking should be reinterpreted as a constraint of the model, not a fact about biology; fitting a model that allows post-expansion memory formation is a direct test.
- The log-linear peak-day estimator is a testable prediction: time-course experiments at intermediate transfer numbers should confirm or reject the inferred peak days before the method is trusted across datasets.
- The same cohort-fitting adaptation could in principle be transferred to B-cell responses or other differentiation questions whenever a two-phenotype time course and a peak-day estimate are available.
Signed reviews
Editorial analysis
A structured set of objections, weighed in public.
Referee Report
Summary. The paper adapts the multi-type Bellman-Harris branching process model of Buchholz et al. (2013) to infer the order of memory/effector differentiation from cohort-level (population) time-course data rather than clonal data. The authors first validate the adaptation by fitting six representative differentiation networks to the non-clonal data reported in Buchholz et al. and recover the original 'Memory First' conclusion with similar parameter values (Fig. 4). They then reduce the model to two competing structures, Linear Memory First and Linear Effector First, and apply it to data from Badovinac et al. (2007), Schlub et al. (2010), and Kinjo et al. (2015). When all data up to day 8 are fitted, the results are contradictory; however, after curtailing the data to an estimated expansion phase (based on a log-linear regression relating adoptive transfer number to day of peak response) and imposing an upper bound on cell lifetimes, the Memory First model provides the better fit across all spleen/blood datasets (Fig. 6B-C). The paper openly acknowledges that the model cannot represent the possibility that memory precursors are generated after the strictly exponential expansion phase, an alternative supported by data from Kinjo et al.
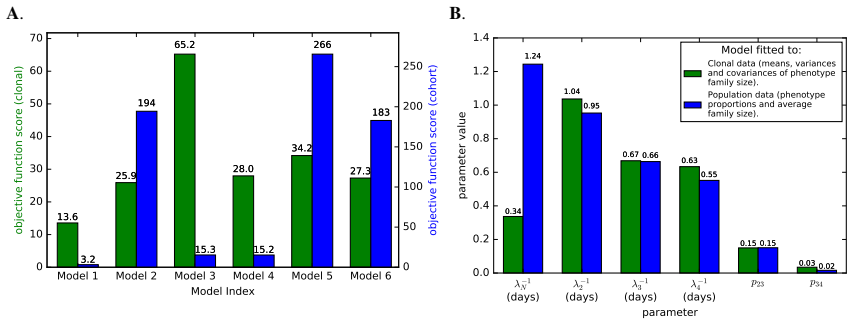
Significance. If the central claim holds, the paper provides a practical method for evaluating differentiation order from commonly available population-level time-course data, which would substantially increase the utility of the Buchholz et al. modeling framework. The internal consistency check on the Buchholz cohort data is a genuine positive result: fitting six models to cohort proportions yields the same best model as fitting to clonal summary statistics, with five of six parameters being quantitatively similar (Fig. 4B). The paper is also commendably transparent about its limitations, explicitly flagging the post-expansion memory alternative and the model's inability to represent it. However, the cross-dataset conclusion depends on several external estimates (peak day, average family size, expansion-phase endpoint) that are not derived from the data being fit, and no sensitivity analysis is provided to show that the Memory First conclusion is robust to these estimates. Because the load-bearing assumptions are acknowledged but not stress-tested, the significance of the cross-dataset claim is currently conditional.
major comments (4)
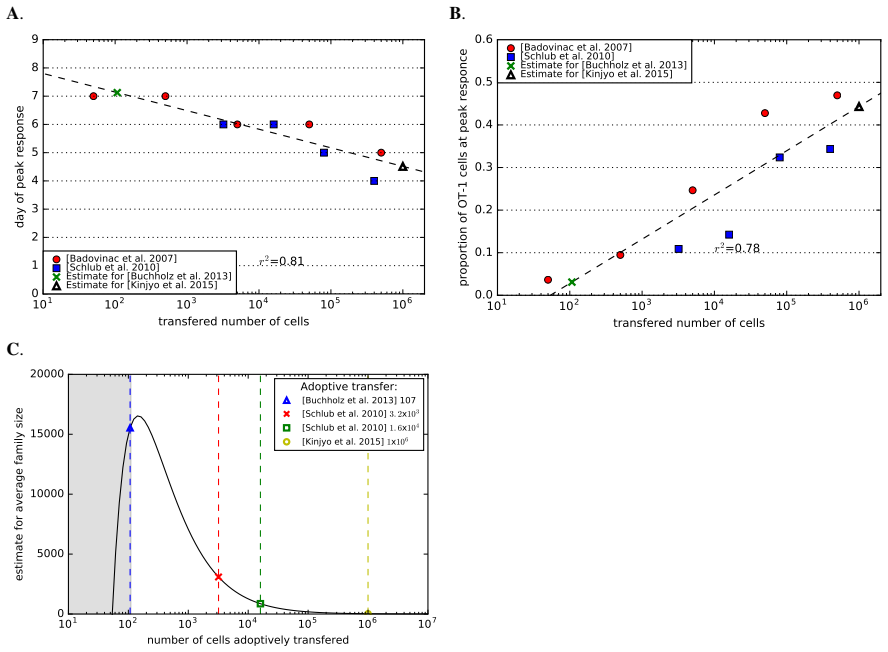
- [Section 4, Fig. 6B/C; Section 5] The central cross-dataset claim that 'Memory First provides the best fit' is obtained only after curtailing each dataset to an estimated expansion phase, and the curtailment endpoint is the single most consequential modeling choice. For the Kinjo et al. data, the endpoint (day 4-5) is inferred from a log-linear regression (Fig. 5A, r2=0.81) that extrapolates to 10^6 transferred cells. The manuscript itself notes in Section 4 that fitting the full day 0-8 data supports Effector First in several cases (Fig. 6A), and that Kinjo et al. report a late rise in CD62L+ proportion by day 7. Thus the comparison between Memory First and Effector First is conditional on excluding exactly the late-time data that would distinguish the two paths. A sensitivity analysis is needed: the regression has uncertainty, and the authors should show how the model ranking changes as the expansion-phase endpoint varies over a plausible range (e.g., day 4 to day 7 for the Kinjo data). Without such an analysis, the 'consistent deduction' claim in Section 5 is not yet supportable.
- [Section 4, Fig. 5B/C; Eq. (d3)] The estimate of average family size at peak for the Kinjo et al. experiment (23 cells per family) is derived from a log-linear regression of peak OT-1 proportion on transfer number plus several auxiliary assumptions (total lymphocyte count at peak is constant across experiments; the Buchholz average family size is representative). The authors state that a 'sanity check established there was no significant impact (data not shown)', but no details are given. This quantity is not merely a nuisance parameter: it sets the scale of the entire population trajectory and directly enters the objective function d3 through the squared relative error term (y1 - y1(theta))^2 / y1^2. A change in the family size estimate could plausibly change which model better matches the observed proportions, especially for small family sizes. The authors should report the sanity check and/or demonstrate robustness of the model ranking to a range of family-size estimates.
- [Section 3, objective function d2; Section 4, objective function d3] The objective function is changed between the Buchholz cohort fit (d2, a chi-square-like sum using estimated standard errors) and the other datasets (d3, a weighted mean squared error that scales only the family-size term by its observed value squared). The choice of d3 is justified as a way to balance scales, but no justification is given for why only the family-size term is normalized and why the proportional terms enter with unit weight. This weighting is not derived from a noise model, and it could affect the relative ranking of Memory First versus Effector First. The authors should either provide a principled derivation of d3 (e.g., as a likelihood under a stated error model) or show that the qualitative conclusions are unchanged under alternative reasonable weightings (e.g., normalizing every term by the observed value squared, or using relative errors for all terms).
- [Section 4, Fig. 6D and MLN analysis] The paper excludes the MLN data from Kinjo et al. because of 'high levels of migration', yet that dataset, when fitted with the same constrained procedure, returns Effector First as the better model (Section 4, Fig. 6D). Since the stated goal is to test the generality of the Memory First deduction across data from different papers and organs, the exclusion criterion should be made more specific and objective. The authors should either give a quantitative justification for excluding MLN data (e.g., a migration model or a goodness-of-fit threshold) or report the MLN result transparently as a limitation rather than as an exception that is set aside. As written, the exclusion risks making the claim of cross-dataset consistency circular.
minor comments (5)
- [Abstract and Section 4] The abstract states that the memory-precursors-after-expansion possibility is 'a deduction not possible from the mathematical methods provided'; this is a welcome and important caveat, but the wording in the main text (Section 4) is stronger: the authors write that the method 'indicates' differences that 'could come from other [15] results'. For clarity, use consistent language throughout: clearly distinguish between 'the model prefers Memory First given its assumption of expansion-phase-only memory generation' and 'memory generation after the expansion phase is occurring in the data'.
- [Section 3, Fig. 4B] The claim of 'remarkably similar' parameterization between clonal and cohort fits is based on five of six parameters having similar values, but the figure shows the naive-cell lifetime lambda_N differs substantially (0.34 vs 1.24 days). The text gives a plausible explanation (naive and TCMp are conflated), but this should be quantified: report the fitted value and its uncertainty for lambda_N in both cases, and state whether the difference is within a plausible range given the conflation.
- [Section 2, Fig. 2B] In Figure 2B, the top row shows 'all data up to day 8' while the bottom row shows 'data curtailed to expansion phase' for the same datasets. The curtailment endpoints are not marked on the figure, which makes it difficult for the reader to see exactly which time points are included in each fit. Provide vertical dashed lines or numeric labels indicating the last day retained for each dataset.
- [Section 4, Eq. (d3)] The notation for the objective function d3 is imprecise: the subscript ranges in the sum are written as i=2 to k+1, but the text above defines y1 as the family size and y2,...,y_{k+1} as proportions. This is understandable, but the definition of k is not stated. Please define k explicitly as the number of time points at which proportions are observed.
- [References and data availability] The paper manually extracts data from graphs in the cited papers. To ensure reproducibility, the authors should provide the extracted numerical data as a supplementary table or a publicly accessible repository, along with the fitting code or a clear description of the optimization procedure (e.g., which solver, number of restarts, convergence criteria). This is particularly important because the paper repeatedly notes that data are limited and parameters are at boundary values.
Circularity Check
No circularity found: the Memory First deduction is an unforced model-comparison result with explicitly acknowledged modeling limitations.
full rationale
The paper's central inference is a model comparison, not a restatement of its inputs. In Section 3, cohort-level proportions and peak family size are fitted to six linear differentiation networks using the objective function d2; in Section 4, two simplified networks (Linear Memory First and Linear Effector First) are fitted to cohort data from [2, 21, 15] via d3. In both cases, the winning network is determined by minimizing an error function over parameters, and the paper reports cases where Effector First wins (Fig. 6A, MLN data), showing the comparison is not forced by construction. The day-of-peak and average-family-size estimates in Fig. 5 are nuisance inputs used for scaling and data curtailment; they do not encode the differentiation order being inferred. The curtailment to the expansion phase is a stated modeling limitation rather than a circular step: the abstract and Discussion explicitly say that an alternative in which memory precursors arise after the expansion phase is 'a deduction not possible from the mathematical methods provided in Buchholz et al.' The related self-citation concern is minimal: Kinjo et al. [15] is co-authored by one of the present authors and is used both as data and as supporting evidence for the post-expansion alternative, but it is an external published dataset and the main claim does not rest on that citation. The paper's own honest caveats about model assumptions and biologically implausible parameterizations further indicate that the derivation is not circular, merely limited in scope.
Assumptions & free parameters
free parameters (8)
- Naive cell lifetime (simplified model) =
1/lambda_N, fitted per dataset; e.g., 1.2 days for Memory First on Buchholz data, often at the 5-day upper bound (Fig.
- Type 2 cell lifetime (simplified model) =
1/lambda_2, fitted per dataset (Fig. 7B/C)
- Type 3 cell lifetime (simplified model) =
1/lambda_3, fitted per dataset (Fig. 7B/C)
- Differentiation probability p23 (simplified model) =
fitted per dataset (Fig. 7B/C)
- Six-model parameters (lambda_N, lambda_2, lambda_3, lambda_4, p23, p34) =
For Model 1 from cohort data: 1.24, 0.95, 0.66, 0.55, 0.15, 0.02 (Fig. 4B)
- Peak-day log-linear regression =
Slope/intercept not reported; R2=0.81 (Fig. 5A)
- Peak OT-1 proportion log-linear regression =
Slope/intercept not reported; R2=0.78 (Fig. 5B)
- Upper bound on mean cell lifetime =
5 days
assumptions (6)
- domain assumption The expansion phase is a memoryless multi-type Bellman-Harris process with exponentially distributed cell lifetimes and no cell death.
- domain assumption Cell fates and lifetimes are independent across cells; there is no clonal heterogeneity in kinetic parameters.
- domain assumption Memory precursors, if formed during the response, are generated within the strictly exponential expansion phase.
- ad hoc to paper The number of adoptively transferred cells determines the day of peak response and the average family size at peak via log-linear relationships fitted to data from Badovinac et al. and Schlub et al.
- domain assumption The total number of lymphocytes at the peak immune response is the same across all experiments.
- ad hoc to paper In the Buchholz cohort data, naive cells are included in the TCMp count.
Cite this review
Pith. "Pith review of Inferring differentiation order in adaptive immune responses from population level data." pith.science (2026). https://pith.science/paper/N4SMT32V
@misc{pith2026190803482,
  author       = {Pith},
  title        = {Pith review of: Inferring differentiation order in adaptive immune responses from population level data},
  year         = {2026},
  howpublished = {\url{https://pith.science/paper/N4SMT32V}},
  note         = {Machine review of arXiv:1908.03482}
}
read the original abstract
A hallmark of the adaptive immune response is the proliferation of pathogen-specific lymphocytes that leave in their wake a long lived population of cells that provide lasting immunity. A subject of ongoing investigation is when during an adaptive immune response those memory cells are produced. In two ground-breaking studies, Buchholz et al. (Science, 2013) and Gerlach et al. (Science, 2013) employed experimental methods that allowed identification of offspring from individual lymphocytes in vivo, which we call clonal data, at a single time point. Through the development, application and fitting of a mathematical model, Buchholz et al. (Science, 2013) concluded that, if memory is produced during the expansion phase, memory cell precursors are made before the effector cells that clear the original pathogen. We sought to determine the general validity and power of the modeling approach introduced in Buchholz et al. (Science, 2013) for quickly evaluating differentiation networks by adapting it to make it suitable for drawing inferences from more readily available non-clonal phenotypic proportion time-courses. We first established the method drew consistent deductions when fit to the non-clonal data in Buchholz et al. (Science, 2013) itself. We fit a variant of the model to data reported in Badovinac et al. (J. Immun., 2007), Schlub et al. (Immun. & Cell Bio., 2010), and Kinjo et al. (Nature Commun., 2015) with necessary simplifications to match different reported data in these papers. The deduction from the model was consistent with that in Buchholz et al. (Science, 2013), albeit with questionable parameterizations. An alternative possibility, supported by the data in Kinjo et al. (Nature Commun., 2015), is that memory precursors are created after the expansion phase, which is a deduction not possible from the mathematical methods provided in Buchholz et al. (Science, 2013).
Figures

Figures from the paper (4 more)
Reference graph
Works this paper leans on
-
[1]
Rafi Ahmed, Michael J. Bevan, Steven L. Reiner, and Douglas T. Fearon. The precursors of memory: models and controversies. Nature Reviews Immunology, 9(9):662–668, 2009
work page 2009
-
[2]
Vladimir P. Badovinac, Jodie S. Haring, and John T. Harty. Initial T cell receptor transgenic cell precur- sor frequency dictates critical aspects of the CD8+ T cell response to infection. Immunity, 26(6):827– 841, 2007
work page 2007
-
[3]
Veit R. Buchholz, Michael Flossdorf, Inge Hensel, Lorenz Kretschmer, Bianca Weissbrich, Patricia Gr¨af, Admar Verschoor, Matthias Schiemann, Thomas H¨ofer, and Dirk H. Busch. Disparate individual fates compose robust CD8+ T cell immunity. Science, 340(6132):630–635, 2013
work page 2013
-
[4]
Veit R. Buchholz, Ton N. M. Schumacher, and Dirk H. Busch. T cell fate at the single-cell level.Annual review of immunology, 34:65–92, 2016
work page 2016
-
[5]
John T. Chang, Vikram R. Palanivel, Ichiko Kinjyo, Felix Schambach, Andrew M. Intlekofer, Arnob Banerjee, Sarah A. Longworth, Kristine E. Vinup, Paul Mrass, Jane Oliaro, Nigel Killeen, Jordan S. Orange, Sarah M. Russell, Wolfgang Weninger, and Steven L. Reiner. Asymmetric T lymphocyte division in the initiation of adaptive immune responses. Science, 315(5...
work page 2007
-
[6]
Dowling, Andrey Kan, Susanne Heinzel, Jie H
Mark R. Dowling, Andrey Kan, Susanne Heinzel, Jie H. S. Zhou, Julia M. Marchingo, Cameron J. Wellard, John F. Markham, and Philip D. Hodgkin. Stretched cell cycle model for proliferating lym- phocytes. Proceedings of the National Academy of Sciences , 111(17):6377–6382, 2014
work page 2014
-
[7]
Ken R. Duffy, Cameron J. Wellard, John F. Markham, Jie H. S. Zhou, Ross Holmberg, Edwin D. Hawkins, Jhagvaral Hasbold, Mark R. Dowling, and Philip D. Hodgkin. Activation-induced B cell fates are selected by intracellular stochastic competition. Science, 335(6066):338–341, 2012
work page 2012
-
[8]
Rohr, Le ¨ıla Peri´e, Nienke van Rooij, Jeroen W
Carmen Gerlach, Jan C. Rohr, Le ¨ıla Peri´e, Nienke van Rooij, Jeroen W. J. van Heijst, Arno Velds, Jos Urbanus, Shalin H. Naik, Heinz Jacobs, Joost B. Beltman, Rob J. de Boer, and Ton N. M. Schumacher. Heterogeneous differentiation patterns of individual CD8+ T cells. Science, 340(6132):635–639, 2013
work page 2013
Show all 36 references
-
[9]
The Theory of Branching Processes
Theodore E Harris. The Theory of Branching Processes. The RAND Corporation, 1964
1964
-
[10]
E. D. Hawkins, J. F. Markham, L. P. McGuinness, and P. D. Hodgkin. A single-cell pedigree anal- ysis of alternative stochastic lymphocyte fates. Proceedings of the National Academy of Sciences , 106(32):13457–13462, 2009
2009
-
[11]
E. D. Hawkins, M. L. Turner, M. R. Dowling, C. van Gend, and P. D. Hodgkin. A model of immune regulation as a consequence of randomized lymphocyte division and death times. Proceedings of the National Academy of Sciences , 104(12):5032–5037, 2007
2007
-
[12]
A Myc-dependent division timer complements a cell-death timer to regulate T cell and B cell responses
Susanne Heinzel, Tran Binh Giang, Andrey Kan, Julia M Marchingo, Bryan K Lye, Lynn M Corcoran, and Philip D Hodgkin. A Myc-dependent division timer complements a cell-death timer to regulate T cell and B cell responses. Nature Immunology, 18:96–103, 2017
2017
-
[13]
Modelling T-cell memory by genetic marking of memory T cells in vivo
Joshyi Jacob and David Baltimore. Modelling T-cell memory by genetic marking of memory T cells in vivo. Nature, 399:593–597, 1999
1999
-
[14]
King, Sabrina Koehli, Barbara Hausmann, Mathias Schmaler, Dietmar Zehn, and Ed Palmer
Carolyn G. King, Sabrina Koehli, Barbara Hausmann, Mathias Schmaler, Dietmar Zehn, and Ed Palmer. T cell affinity regulates asymmetric division, effector cell differentiation, and tissue pathology. Immu- nity, 37(4):709–720, 2012
2012
-
[15]
Wellard, Paulus Mrass, William Ritchie, Atsushi Doi, Lois L
Ichiko Kinjyo, Jim Qin, Sioh-Yang Tan, Cameron J. Wellard, Paulus Mrass, William Ritchie, Atsushi Doi, Lois L. Cavanagh, Michio Tomura, Asako Sakaue-Sawano, Osami Kanagawa, Atsushi Miyawaki, Philip D. Hodgkin, and Wolfgang Weninger. Real-time tracking of cell cycle progression...
2015
-
[16]
Phenotypic CD8+ T cell diversification occurs before, during, and after the first T cell division
Fabrice Lema ˆıtre, H´el`ene D Moreau, Laura Vedele, and Philippe Bousso. Phenotypic CD8+ T cell diversification occurs before, during, and after the first T cell division. The Journal of Immunology , 191(4):1578–1585, 2013
2013
-
[17]
J. M. Marchingo, G. Prevedello, A. Kan, S. Heinzel, P. D. Hodgkin, and K. R. Duffy. T-cell stimuli independently sum to regulate an inherited clonal division fate.Nature Communications, 7:13540, 2016
2016
-
[18]
Marchingo, Andrey Kan, Robyn M
Julia M. Marchingo, Andrey Kan, Robyn M. Sutherland, Ken R. Duffy, Cameron J. Wellard, Gabrielle T. Belz, Andrew M. Lew, Mark R. Dowling, Susanne Heinzel, and Philip D. Hodgkin. Antigen affinity, costimulation, and cytokine inputs sum linearly to amplify T cell expansion. Scien...
2014
-
[19]
Opferman, Bertram T
Joseph T. Opferman, Bertram T. Ober, and Philip G. Ashton-Rickardt. Linear differentiation of cytotoxic effectors into memory T lymphocytes. Science, 283(5408):1745–1748, 1999
1999
-
[20]
Visualizing spatiotemporal dynamics of multicellular cell-cycle progression
Asako Sakaue-Sawano, Hiroshi Kurokawa, Toshifumi Morimura, Aki Hanyu, Hiroshi Hama, Hatsuki Osawa, Saori Kashiwagi, Kiyoko Fukami, Takaki Miyata, Hiroyuki Miyoshi, Takeshi Imamura, Masa- haru Ogawa, Hisao Masai, and Atsushi Miyawaki. Visualizing spatiotemporal dynamics of mult...
2008
-
[21]
Schlub, Vladimir P
Timothy E. Schlub, Vladimir P. Badovinac, Jaime T. Sabea, John T. Harty, and Miles P. Davenport. Predicting CD62L expression during the CD8+ T cell response in vivo. Immunology and Cell Biology , 88(2):157–164, 2010. 9
2010
-
[22]
J. A. Smith and L. Martin. Do cells cycle? Proceedings of the National Academy of Sciences , 70(4):1263–1267, 1973
1973
-
[23]
John Wherry, V olker Teichgr¨aber, Todd C
E. John Wherry, V olker Teichgr¨aber, Todd C. Becker, David Masopust, Susan M. Kaech, Rustom Antia, Ulrich H. von Andrian, and Rafi Ahmed. Lineage relationship and protective immunity of memory CD8 T cell subsets. Nature Immunology, 4:225–234, 2003. 10 A. Path ogen NaiveNaive N...
2003
-
[24]
An array of eight OT- 1 congenic C57BL/6 donor mice is crossbred so that each has CD45/CD90 T cell markers that distinguish offspring
-
[25]
1 cell is transferred per donor for 7 mice, 100 for the 8th donor mouse
Adoptive transfer of purified naïve cells from 8 donor mice to host mouse. 1 cell is transferred per donor for 7 mice, 100 for the 8th donor mouse. 8 days post infection 3.The host mouse is infected with 5x10³cfu of LM-OVA, triggering the immune response
-
[26]
5.FACs analysis
At eight days after infection cells are harvested from the host mouse from the lungs, spleen and lymph nodes. 5.FACs analysis. For observed T cells, the congenic markers indicate the family and CD62L and CD27 markers indicate phenotype. Thus summary statistics of phenotype pop...
-
[27]
The donor mouse is crossbred so as to express CD90 or CD45
-
[28]
Adoptive transfer of different numbers of purified naïve T cells from donor mice to host mouse: • 5x101- 5x10⁵ [B.2007] • 3.2x10³- 4x10⁵ [S.2010] • 1x10²- 1x10⁴ [B.2013] • 1x10⁶ [K.2015] Various days post infection: • 3-74 days [B.2007] • 4-53 days [S.2010] • 1-8 days [B.2013]...
2007
-
[29]
The host mouse (expressing different markers from the donor) is infected with OVA expressing pathogen: • LM-OVA (7x10⁶cfu) [B.2007] • LM-OVA (8x10⁶cfu) [S.2010] • LM-OVA (5x10³cfu) [B.2013] • PR8-OVA (1x10²pfu) [K.2015]
2007
-
[30]
2015] 5.FACs analysis
At a fixed time post infection cells are harvested from the host mouse from: • blood tail snips [B.2007][S.2010] • spleen only [B.2013] • or spleen and MLN [K. 2015] 5.FACs analysis. CD90/CD45 congenic markers indicate donor progeny from the hosts progeny. Proportions of CD62L...
2007
-
[32]
Upon exit from this state, type two cells differentiate into one cell of type three with probability p23 or divide into two type two cells with probability 1-p23
Type two cells live an exponentially distributed lifetime parameterized by λ2. Upon exit from this state, type two cells differentiate into one cell of type three with probability p23 or divide into two type two cells with probability 1-p23
-
[33]
Upon exit from this state, type three cells differentiate into one cell of type four with probability p34 or divide into two type three cells with probability 1-p34
Type three cells live an exponentially distributed lifetime parameterized by λ3. Upon exit from this state, type three cells differentiate into one cell of type four with probability p34 or divide into two type three cells with probability 1-p34
-
[34]
Upon exit from this state, type four cells always divide into two type four cells
Type four cells live an exponentially distributed lifetime parameterized by λ4. Upon exit from this state, type four cells always divide into two type four cells. B. TYPE 2Naive TYPE 2 TYPE 2 TYPE 2 TYPE 3 TYPE 3 TYPE 3 TYPE 3 λ2λN λ3 p23 1-p23
-
[35]
Upon exit from this state, naïve cells become one cell of type two
Naïve cells live a exponentially distributed lifetime parameterized by λN. Upon exit from this state, naïve cells become one cell of type two
-
[36]
Upon exit from this state, type two cells differentiate into one cell of type three with probability p23 or divide into two type three cells with probability 1- p23
Type two cells live an exponentially distributed lifetime parameterized by λ2. Upon exit from this state, type two cells differentiate into one cell of type three with probability p23 or divide into two type three cells with probability 1- p23
-
[37]
Upon exit from this state type three cells always divide into two type three cells
Type three cells live an exponentially distributed lifetime parameterized by λ3. Upon exit from this state type three cells always divide into two type three cells. Figure 3. Linear differentiation models considered here. (A) These linear models are a subset of the 304 multi-t...
2007
Reviewed August 14, 2026 · model on record in the stance chip above.
Discussion (0). Continue with ORCID to comment.