REVIEW 2 major objections 5 minor 47 references
Leveraging Random Assignment to Impute Missing Covariates in Causal Studies
T0 review · 2 major / 5 minor · reviewed 2026-08-14 · deepseek-v4-flash
Pith's one-line read Respecting randomization in imputation of missing covariates yields only small accuracy gains in moderately sized experiments.
desk verdict A careful simulation study whose central null result is real but only established at n=1000; worth publishing with the scope made more explicit. read the letter →
The pith
A machine-rendered reading of the paper's core claim, the machinery that carries it, and where it could break.
The reading
What carries the argument
The central object is a Bayesian multiple imputation model for the joint distribution of the covariates and their missingness indicators, represented as a multinomial/Dirichlet model on the contingency table formed by covariates, missingness indicators, treatment, and optionally outcome. To identify the full-data distribution when missingness is not at random, the paper uses two identifying restrictions: the itemwise conditionally independent non-response (ICIN) assumption, which posits that each variable's missingness is conditionally independent of its own value given all other variables and their missingness indicators, and the missing at random (MAR) assumption. Respecting randomization in the design stage amounts to collapsing the contingency table over treatment, which is justified by the independence of treatment from covariates and missingness indicators; for the outcome stage, the factorization $f(X_{mis},X_{obs},D,T,Y) = f(X_{mis},X_{obs},D,T)\,f(Y|X_{mis},X_{obs},D,T)$ allows using the outcome without assuming $Y \perp\!\!\perp T$. The inference machinery is data augmentation via a Polya-Gamma sampler for the logistic outcome model and Dirichlet draws for the table probabilities.
What would settle it
Reproduce the paper's high-association scenario 1 simulation with n=1,000 and 35–40% missingness: the paper reports Monte Carlo standard deviations for the interaction coefficient $\beta_{tx2}$ that are essentially identical between the respecting-randomization (MI-R) and ignoring-randomization (MI-NR) multiple imputation routines (0.255 in both cases in Table 2). A replication in which these MC-SDs differ by more than 10% would contradict the paper's small-gains claim for its own settings.
Extended reading notes
Core claim
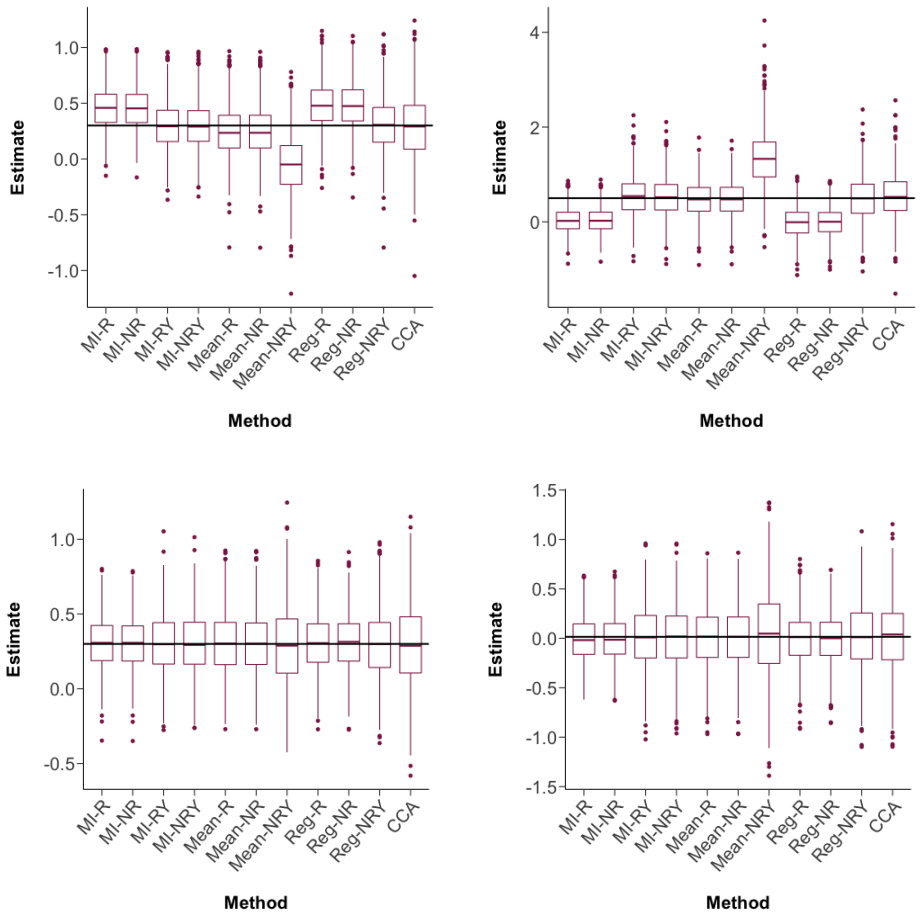
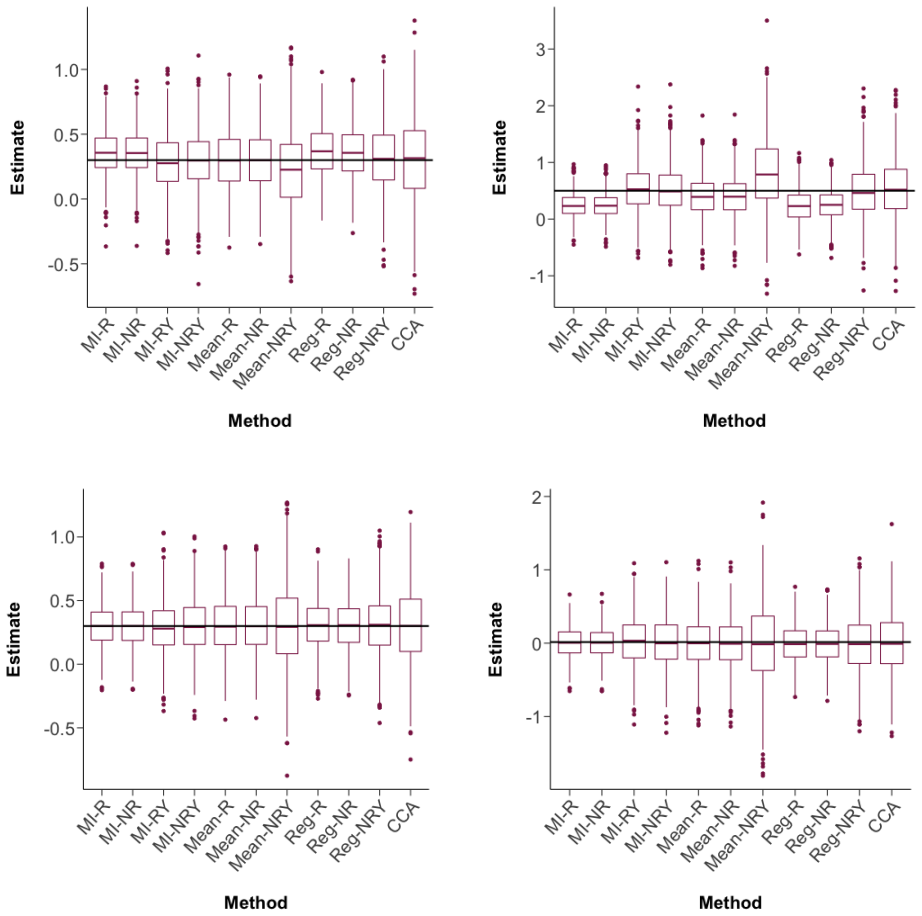
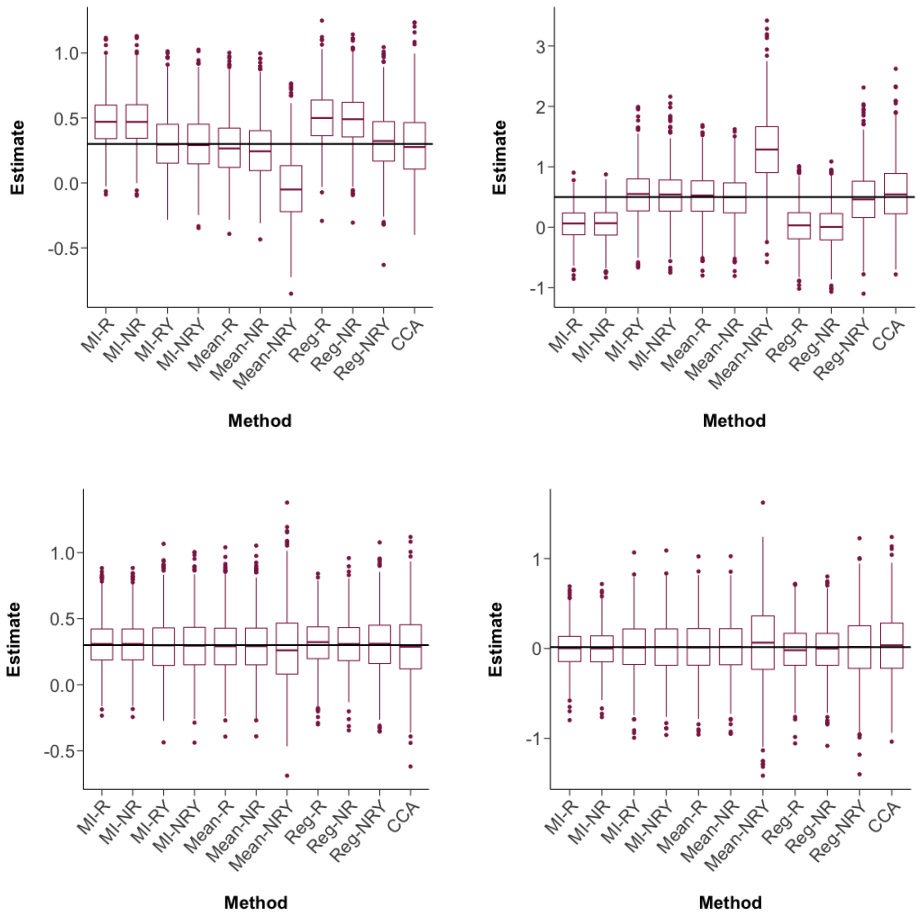
The paper's central discovery is that, under its simulation settings, properly accounting for randomization—by pooling data across treatment arms when estimating imputation models—makes little practical difference to the quality of treatment effect estimates. For all three imputation approaches (mean, regression, multiple), the Monte Carlo standard deviations, biases, and confidence interval coverage rates are nearly identical between routines that respect and those that ignore randomization. The explanation offered is that with 500 units per arm, the imputation model parameters are already estimated accurately within each arm, and with binary covariates the extra precision from pooling does not translate into materially different imputations. The same holds when the outcome is included in the imputation model. The paper does find a bias-variance trade-off between design-stage and outcome-stage multiple imputation when estimating effect modification: design-stage MI can be biased for the interaction coefficient but more efficient, while outcome-stage MI is less biased but more variable.
Load-bearing premise
The conclusion rests on the simulation design: sample size of 1,000 with 500 per arm, two binary covariates, missingness rates around 35–40%, and a logistic outcome model with a single treatment-by-covariate interaction; if real experiments differ materially from these settings, the size of the gains could change.
Editorial extensions
If this is right
- Analysts in moderately sized randomized experiments can impute missing covariates within treatment arms without giving up much accuracy in treatment effect estimates, since pooling across arms barely changes point estimates, variances, or coverage.
- For estimating heterogeneous treatment effects with multiple imputation, including the outcome in the imputation model reduces bias in the interaction coefficient but increases its variance, so the choice of design-stage versus outcome-stage imputation may be guided by whether bias or efficiency matters more.
- The single imputation strategies that impute within treatment-by-outcome cells perform poorly—producing biased estimates and undercoverage—and should not be used for missing covariates.
- Because the small-gains result was derived under an outcome model with a treatment-by-covariate interaction, it does not transfer directly to settings with constant treatment effects, where earlier studies found larger benefits from leveraging randomization.
Reading between the lines
- The paper's explanation for the small gains—that 500 units per arm already yield stable multinomial estimates for binary covariates—suggests a threshold relationship: as sample size shrinks or missingness tables become sparser, the benefit of pooling should become visible. A systematic sweep of sample sizes would turn that threshold into an actionable rule.
- If the same comparison were run with continuous covariates, pooling might matter more because within-arm parametric models can be unstable in small arms; the paper's contingency-table framework does not directly address that case.
- The paper's negative result for outcome-based single imputation stems largely from variance underestimation; a version that inflates the imputation variance (for example, through repeated draws rather than a single draw) could restore competitiveness, though the paper does not pursue this.
- For extremely rare outcomes or sparse covariate combinations, the design-stage MI's bias in the interaction coefficient could dominate its variance advantage, reversing the paper's favorable assessment of design-stage MI in large samples; this is a direct extrapolation of the paper's own large-n thought experiment.
Signed reviews
Editorial analysis
A structured set of objections, weighed in public.
Referee Report
Summary. The paper studies whether, when imputing missing baseline covariates in randomized experiments, the analyst should 'respect' the randomization by pooling imputation-model estimation across treatment arms or should ignore it by estimating separate imputation models within arms. The authors compare mean imputation, stochastic regression imputation, and multiple imputation, each implemented in a design-stage version (covariates only) and an outcome-stage version (covariates plus outcome). They evaluate the methods in a simulation with n=1000 (500 per arm), two binary covariates, three missingness scenarios (pre-treatment missingness, post-treatment missingness, and missingness predictive of the outcome), two identifying assumptions (ICIN and MAR), and two strengths of covariate-outcome association, using 1000 replications and reporting bias, MC-SD, estimated SE, coverage, and CI length. The central finding is that respecting versus ignoring randomization makes only small differences in the quality of treatment-effect and heterogeneous-treatment-effect estimates. The paper also compares design-stage versus outcome-stage imputation, finding a bias-efficiency tradeoff for MI and poor performance of outcome-based single imputation methods, and it applies the methods to a real randomized experiment on political ambition.
Significance. If the result holds, it gives practical guidance that, in moderately large randomized trials with binary covariates, the extra effort of building imputation models that enforce the same covariate distribution across arms is unlikely to materially improve inferences, provided the imputation model is otherwise reasonable. The paper also makes a useful methodological contribution by implementing non-parametrically identified multiple imputation under the ICIN assumption for a covariate with heterogeneous treatment effects, and by carefully comparing design-stage and outcome-stage MI. The simulation is thorough: 1000 replications, three missingness mechanisms, two identifying assumptions, complete performance metrics, and an application to real data. The main weaknesses are that the simulation uses only binary covariates, a single sample size, and does not ship code; nevertheless, the empirical claims are well supported by the reported tables.
major comments (2)
- [Section 4.1 and Section 6] The central claim that respecting randomization offers only small gains is established at a single sample size, n=1000 (500 per arm). Section 6 itself states that for treatment arms 'in the tens' the gains 'can be more substantial.' Because no simulation varies n, the paper does not locate the boundary between the 'small gains' regime and the 'substantial gains' regime. Many randomized experiments have per-arm sample sizes of 100-300, and the efficiency loss from estimating arm-specific imputation parameters in that range could be larger than the 1-3% MC-SD differences seen in Tables 2-5. I recommend adding a smaller-sample simulation condition (e.g., n=200 or n=400 total) or, at a minimum, revising the abstract and introduction to restrict the conclusion explicitly to n around 1000 and to explain the expected behavior at other sizes.
- [Section 4.1.2 and Section 3.1] In scenario 2, the missingness indicators (D1,D2) are generated as post-treatment variables depending on T, yet the design-stage 'respecting randomization' method (MI-R) is implemented by collapsing the contingency table over T, which presumes (D1,D2) ⊥⊥ T. This assumption is violated by design in that scenario. The paper does not acknowledge the misspecification or explain why the comparison between MI-R and MI-NR remains a clean comparison of 'respecting' versus 'not respecting' randomization. As written, the scenario 2 results could be interpreted as showing robustness to a false design-stage assumption rather than as evidence about the value of using the randomization. Please clarify the interpretation, or adjust the implementation so that 'respecting randomization' is defined consistently with the data-generating mechanism.
minor comments (5)
- [General] The simulation code is not provided; making it available would strengthen reproducibility and allow readers to probe the sample-size question raised above.
- [Table 1] The abbreviation 'NA' is used without definition; please state that it denotes a missing value.
- [Section 4.1.1] The loglinear model coefficients in Eq. (14) are given without any explanation of how they were chosen; a brief indication of how they yield the desired marginal distributions would aid reproducibility.
- [Section 5] The application has approximately 408 treated and 204 control units, which is still moderately large; the near-identical estimates between respecting and not respecting randomization there do not provide evidence about small-arm behavior.
- [Section 3.1] The Dirichlet prior specification and the handling of sparse missingness patterns (e.g., when the observed contingency table has zero counts) could be clarified; the text currently does not say how zero counts are treated in the posterior draws.
Circularity Check
No significant circularity: the paper's central claim is an empirical simulation comparison, and no prediction or derivation reduces by construction to its own inputs.
full rationale
The paper's headline result is that, for its simulation scenarios, respecting randomization in imputation offers only small accuracy gains relative to ignoring it. This is established by Monte Carlo comparison of distinct imputation procedures (MI-R vs MI-NR, Mean-R vs Mean-NR, Reg-R vs Reg-NR, and their outcome-stage variants) on data generated from explicit models; the conclusion is not entailed by the definitions of the methods. The quantities compared are not fitted to data and then relabeled as predictions: the simulation truths (βt=0.3, βtx2=0.5 or 0.015) are fixed inputs, and all reported biases, MC-SDs, coverages, and CI lengths are simulation outputs. The only notable self-citation is the ICIN identification machinery imported from Sadinle and Reiter (2017), where one author of the present paper is a co-author. That citation supplies an identifying restriction used to construct imputation distributions, but it is not the paper's target result, is not used to forbid alternatives, and does not determine the small-gains comparison. The paper also explicitly bounds its scope, stating in Section 6 that 'Our simulation scenarios are not exhaustive, and results may vary in alternative situations' and that findings are specific to analysis models with treatment-by-covariate interactions. Those are honest scope limitations rather than circular moves. Overall, the derivation chain is self-contained as an empirical study: simulation generation, imputation routines, and analysis models are all stated, and no central claim reduces by definition or by self-citation to its own inputs.
Assumptions & free parameters
free parameters (5)
- Sample size n =
1000 (500 per arm)
- Missingness probabilities for D1, D2 =
0.35 and 0.40 in Scenario 1; conditional on T in Scenario 2 (0.35/0.10 and 0.40/0.10)
- Outcome model coefficients (beta1, beta2, betat, betatx2) =
High association: 0.8, 0.9, 0.3, 0.5; Low association: 0.02, 0.05, 0.3, 0.015
- Covariate marginal probabilities =
P(X1=1)=0.7; P(X2=1|X1=1)=0.6; P(X2=1|X1=0)=0.45
- ICIN loglinear model coefficients (Eq. 14) =
Intercept 5; x1 0.3; x2 -0.5; d1 0.009; d2 0.05; x1x2 0.5; x1d2 0.75; x2d1 1; d1d2 0.25
assumptions (5)
- domain assumption SUTVA and complete randomization: T is independent of potential outcomes and covariates.
- domain assumption (D1,D2) independent of T for design-stage 'respecting randomization' imputation.
- standard math Identifying restrictions ICIN or MAR produce identifiable non-parametric distributions.
- domain assumption Outcome model used for imputation (Eq. 13) is the same as the analysis model, and Y is conditionally independent of D given X and T.
- standard math Multinomial-Dirichlet and Polya-Gamma posterior sampling are correctly implemented.
Cite this review
Pith. "Pith review of Leveraging Random Assignment to Impute Missing Covariates in Causal Studies." pith.science (2026). https://pith.science/paper/N65N2ENT
@misc{pith2026190801333,
  author       = {Pith},
  title        = {Pith review of: Leveraging Random Assignment to Impute Missing Covariates in Causal Studies},
  year         = {2026},
  howpublished = {\url{https://pith.science/paper/N65N2ENT}},
  note         = {Machine review of arXiv:1908.01333}
}
read the original abstract
Baseline covariates in randomized experiments are often used in the estimation of treatment effects, for example, when estimating treatment effects within covariate-defined subgroups. In practice, however, covariate values may be missing for some data subjects. To handle missing values, analysts can use imputation methods to create completed datasets, from which they can estimate treatment effects. Common imputation methods include mean imputation, single imputation via regression, and multiple imputation. For each of these methods, we investigate the benefits of leveraging randomized treatment assignment in the imputation routines, that is, making use of the fact that the true covariate distributions are the same across treatment arms. We do so using simulation studies that compare the quality of inferences when we respect or disregard the randomization. We consider this question for imputation routines implemented using covariates only, and imputation routines implemented using the outcome variable. In either case, accounting for randomization offers only small gains in accuracy for our simulation scenarios. Our results also shed light on the performances of these different procedures for imputing missing covariates in randomized experiments when one seeks to estimate heterogeneous treatment effects.
Figures


Figures from the paper (4 more)

Reference graph
Works this paper leans on
-
[1]
, " * write output.state after.block = add.period write newline
ENTRY address author booktitle chapter edition editor howpublished institution journal key month note number organization pages publisher school series title type volume year label extra.label sort.label INTEGERS output.state before.all mid.sentence after.sentence after.block FUNCTION init.state.consts #0 'before.all := #1 'mid.sentence := #2 'after.sente...
-
[2]
" write newline "" before.all 'output.state := FUNCTION n.dashify 't := "" t empty not t #1 #1 substring "-" = t #1 #2 substring "--" = not "--" * t #2 global.max substring 't := t #1 #1 substring "-" = "-" * t #2 global.max substring 't := while if t #1 #1 substring * t #2 global.max substring 't := if while FUNCTION word.in "in " FUNCTION format.date ye...
work page 1996
-
[3]
(2012), Categorical Data Analysis, Hoboken, NJ: John Wiley & Sons
Agresti, A. (2012), Categorical Data Analysis, Hoboken, NJ: John Wiley & Sons
work page 2012
-
[4]
Barnard, J. and Meng, X. L. (1999), Application of multiple imputation in medical studies: From AIDS to NHANES, Statistical Methods in Medical Research, 8, 17--36
work page 1999
-
[5]
Chen, H., Geng, Z., and Zhou, X. H. (2009), Identifiability and estimation of causal effects in randomized trials with noncompliance and completely nonignorable missing data (with discussion), Biometrics, 65(3), 675--682
work page 2009
-
[6]
Daniels, M. J. and Hogan, J. W. (2008), Missing Data in Longitudinal Studies: Strategies for Bayesian Modeling and Sensitivity Analysis, Boca Raton, FL: Chapman and Hall/CRC
work page 2008
-
[7]
Ding, P. and Geng, Z. (2014), Identifiability of subgroup causal effects in randomized experiments with nonignorable missing covariates, Statistics in Medicine, 33, 1121--1133
work page 2014
-
[8]
Foos, F. and Gilardi, F. (2019), Does exposure to gender role models increase women’s political ambition? A field experiment with politicians, Journal of Experimental Political Science, pp. 1--10
work page 2019
Show all 47 references
-
[9]
Frangakis, C. E. and Rubin, D. B. (1999), Addressing complications of intention-to-treat analysis in the combined presence of all-or-none treatment-noncompliance and subsequent missing outcomes, Biometrika, 86(2), 365--379
1999
-
[10]
D., van der Laan, M
Gill, R. D., van der Laan, M. J., and Robins, J. M. (1997), Coarsening at random: Characterizations, conjectures, counter-examples, in Proceedings of the First Seattle Symposium in Biostatistics, eds. D. Y. Lin and T. R. Fleming, pp. 255--294
1997
-
[11]
and Finkle, W
Greenland, S. and Finkle, W. D. (1995), A critical look at methods for handling missing covariates in epidemiologic regression analyses, American Journal of Epidemiology, 142, 1255--1264
1995
-
[12]
H., White, I
Groenwold, R. H., White, I. R., Donders, A. R., Carpenter, J. R., Altman, D. G., and Moons, K. G. (2012), Missing covariate data in clinical research: When and when not to use the missing-indicator method for analysis, Canadian Medical Association Journal, 184(11), 1265--1269
2012
-
[13]
Imai, K. (2009), Statistical analysis of randomized experiments with non-ignorable missing binary outcomes: An application to a voting experiment, Journal of the Royal Statistical Society: Series C (Applied Statistics), 58(1), 83--104
2009
-
[14]
Imbens, G. W. and Pizer, W. A. (2000), The analysis of randomized experiments with missing data, Resources for the Future, Discussion Paper, pp. 00--19
2000
-
[15]
and Safarkhani, M
Jolani, S. and Safarkhani, M. (2017), The effect of partly missing covariates on statistical power in randomized controlled trials with discrete-time survival endpoints, Methodology: European Journal of Research Methods for the Behavioral and Social Sciences, 13(2), 41--60
2017
-
[16]
T., Jolani, S., Tan, F
Kayembe, M. T., Jolani, S., Tan, F. E. S., and Van Breukelen , G. J. P. (2020), Imputation of missing covariate in randomized controlled trials with a continuous outcome: Scoping review and new results, Pharmaceutical Statistics, pp. 1--21
2020
-
[17]
Linero, A. R. and Daniels, M. J. (2018), Bayesian approaches for missing not at random outcome data: The role of identifying restrictions, Statistical Science, 33, 198--213
2018
-
[18]
Little, R. J. A. (1992), Regression with missing X's: A review, Journal of the American Statistical Association, 87(420), 1227--1237
1992
-
[19]
Little, R. J. A. (1993), Pattern-mixture models for multivariate incomplete data, Journal of the American Statistical Association, 88, 125--134
1993
-
[20]
Little, R. J. A. and Rubin, D. B. (2002), Statistical Analysis with Missing Data, Hoboken, NJ: John Wiley & Sons
2002
-
[21]
and Ashmead, R
Lu, B. and Ashmead, R. (2018), Propensity score matching analysis for causal effects with MNAR covariates, Statistica Sinica, 28(4), 2005--2025
2018
-
[22]
G., Donders, R
Moons, K. G., Donders, R. A., Stijnen, T., and Harrell, F. E. (2006), Using the outcome for imputation of missing predictor values was preferred, Journal of Clinical Epidemiology, 59, 1092--1101
2006
-
[23]
G., Scott, J
Polson, N. G., Scott, J. G., and Windle, J. (2013), Bayesian inference for logistic models using polya-gamma latent variables, Journal of the American Statistical Association, 108, 1339--1349
2013
-
[24]
Reiter, J. P. and Raghunathan, T. E. (2007), The multiple adaptations of multiple imputation, Journal of the American Statistical Association, 102, 1462--1471
2007
-
[25]
Robins, J. M. (1997), Non-response models for the analysis of non-monotone non-ignorable missing data, Statistics in Medicine, 16(1), 21--37
1997
-
[26]
Robins, J. M. and Wang, N. (2000), Inference for imputation estimators, Biometrika, 87, 113--124
2000
-
[27]
Rubin, D. B. (1976), Inference and missing data (with discussion), Biometrika, 63, 581--592
1976
-
[28]
Rubin, D. B. (1978), Bayesian inference for causal effects: The role of randomization, Annals of Statistics, 6(1), 34--58
1978
-
[29]
Rubin, D. B. (1987), Multiple Imputation for Nonresponse in Surveys, New York, NY: John Wiley & Sons
1987
-
[30]
Rubin, D. B. (1996), Multiple imputation after 18+ years, Journal of the American Statistical Association, 91(434), 473--489
1996
-
[31]
Rubin, D. B. (2007), The design versus the analysis of observational studies for causal effects: Parallels with the design of randomized trials, Statistics in Medicine, 26, 20--30
2007
-
[32]
Rubin, D. B. (2008), For objective causal inference, design trumps analysis, Annals of Applied Statistics, 2 (3), 808--840
2008
-
[33]
Rubin, D. B. and Schenker, N. (1991), Multiple imputation in health-care databases: An overview and some applications, Statistics in Medicine, 10, 585--598
1991
-
[34]
Don't Know
Rubin, D. B., Stern, H., and Vehovar, V. (1995), Handling "Don't Know" survey responses: The case of the Slovenian Plebiscite. Journal of the American Statistical Association, 90(431), 822--828
1995
-
[35]
and Reiter, J
Sadinle, M. and Reiter, J. P. (2017), Itemwise conditionally independent nonresponse modeling for incomplete multivariate data, Biometrika, 104(1), 207--220
2017
-
[36]
and Reiter, J
Sadinle, M. and Reiter, J. P. (2018), Sequential identification of nonignorable missing data mechanisms, Statistica Sinica, 28, 1741--1759
2018
-
[37]
and Smith, T
Schemper, M. and Smith, T. L. (1990), Efficient evaluation of treatment effects in the presence of missing covariate values, Statistics in Medicine, 9, 777--784
1990
-
[38]
Sterne, J. A. C., White, I. R., Carlin, J. B., Spratt, M., Royston, P., Kenward, M. G., Wood, A. M., and Carpenter, J. R. (2009), Multiple imputation for missing data in epidemiological and clinical research: Potential and pitfalls, BMJ, 338:b2393
2009
-
[39]
R., White, I
Sullivan, T. R., White, I. R., Salter, A. B., Ryan, P., and Lee, K. J. (2018), Should multiple imputation be the method of choice for handling missing data in randomized trials? Statistical Methods in Medical Research, 27, 2610--2626
2018
-
[40]
and Wong, W
Tanner, M. and Wong, W. (1987), The calculation of posterior distributions by data augmentation, Journal of the American Statistical Association, 82(398), 528--540
1987
-
[41]
Titterington, D. M. and Mill, G. M. (1983), Kernel-based density estimates from incomplete data, Journal of the Royal Statistical Society: Series B (Methodological), 45(2), 258--266
1983
-
[42]
(1994), Logistic Regression with Missing Values in the Covariates, New York, NY: Springer
Vach, W. (1994), Logistic Regression with Missing Values in the Covariates, New York, NY: Springer
1994
-
[43]
and Blettner, M
Vach, W. and Blettner, M. (1991), Biased estimates of the odds ratio in case-control studies due to the use of ad hoc methods of correcting for missing values for confounding variable, American Journal of Epidemiology, 134, 895--907
1991
-
[44]
R., Goetghebeur, E., Kenward, M., and Molenberghs, G
Vansteelandt, S. R., Goetghebeur, E., Kenward, M., and Molenberghs, G. (2006), Ignorance and uncertainty regions as inferential tools in a sensitivity analysis, Statistica Sinica, 16, 953--979
2006
-
[45]
and Robins, J
Wang, N. and Robins, J. M. (1998), Large-sample theory for parametric multiple imputation procedures, Biometrika, 85(4), 935--948
1998
-
[46]
White, I. R. and Thompson, S. G. (2005), Adjusting for partially missing baseline measurements in randomized trials, Statistics in Medicine, 24, 993--1007
2005
-
[47]
and Meng, X
Xie, X. and Meng, X. L. (2017), Dissecting multiple imputation from a multi-phase inference perspective: What happens when God ` s, imputer ` s and analyst ` s models are uncongenial? Statistica Sinica, 27, 1485--1594
2017
Reviewed August 14, 2026 · model on record in the stance chip above.
Discussion (0). Continue with ORCID to comment.