REVIEW 2 major objections 5 minor 50 references
Modelling Mg II During Solar Flares. I. Partial Frequency Redistribution, Opacity, and Coronal Irradiation
T0 review · 2 major / 5 minor · reviewed 2026-08-14 · deepseek-v4-flash
Pith's one-line read Even in the strongest solar flare models, the Mg II h & k lines must be computed with partial frequency redistribution (PRD), not complete redistribution (CRD), because CRD overestimates wing intensities by up to ~1000% and introduces…
desk verdict Systematic RH sensitivity study that settles PRD requirements for flare Mg II, with an acknowledged SE caveat that makes the irradiation numbers provisional. read the letter →
The pith
A machine-rendered reading of the paper's core claim, the machinery that carries it, and where it could break.
The reading
What carries the argument
The load-bearing mechanism is partial frequency redistribution (PRD): when a line forms in a low-density, strongly scattering medium, an absorbed wing photon is re-emitted coherently at nearly the same frequency rather than being redistributed across the whole line profile, so the source function depends on frequency and wing photons escape more easily. The paper contrasts PRD with complete frequency redistribution (CRD), where wing photons are re-emitted anywhere in the line, trapping them in the optically thick core. The quantitative comparisons are made through emergent intensities and contribution functions computed with the RH radiation-transfer code, using the hybrid angle-dependent PRD approximation (H-PRD) as the baseline and full angle-dependent PRD (AD-PRD) as the reference in high-velocity snapshots. The 10-level-plus-continuum Mg II model atom and the fixed non-equilibrium hydrogen populations supplied from the flare simulations support the comparison.
What would settle it
Recompute the F9, F10, and F11 snapshots with time-dependent (non-equilibrium) Mg II populations instead of statistical equilibrium and compare the CRD and PRD emergent profiles; if the wing-intensity difference drops below a few percent, or the PRD-only blue-wing feature disappears, the claim that PRD is required during flares fails. As an observational check, search a sample of IRIS flare-ribbon spectra for the predicted PRD-only blue-wing bump at the corresponding phase; if the feature is absent while red-wing condensation bumps are common, the redistribution mechanism would need revision.
Extended reading notes
Core claim
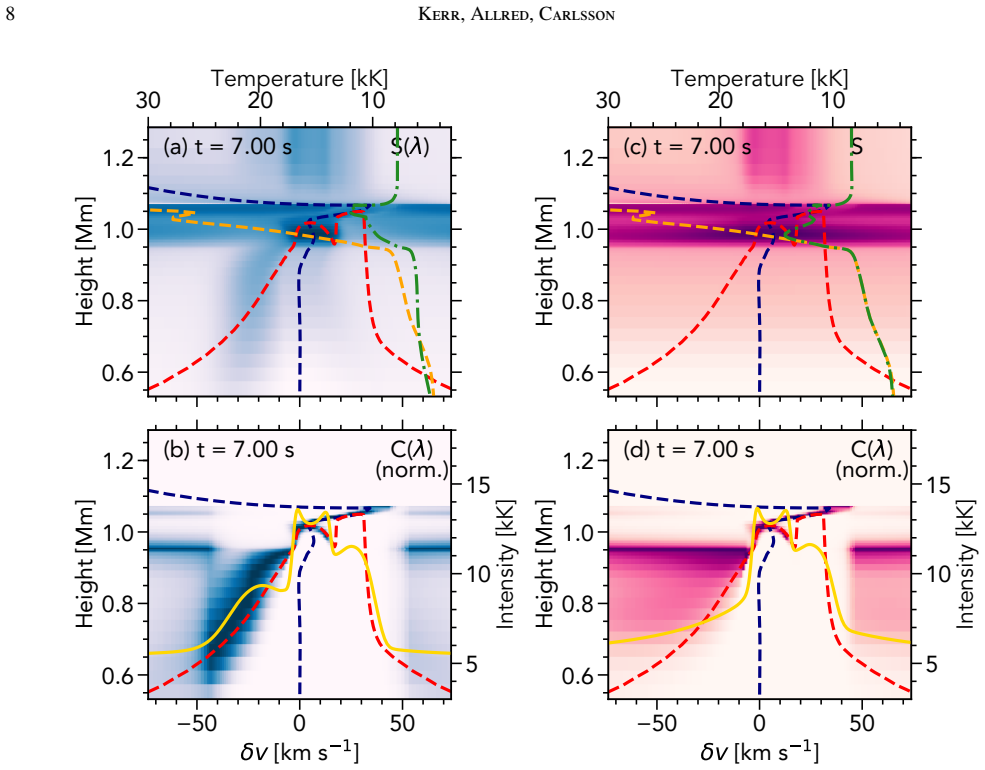
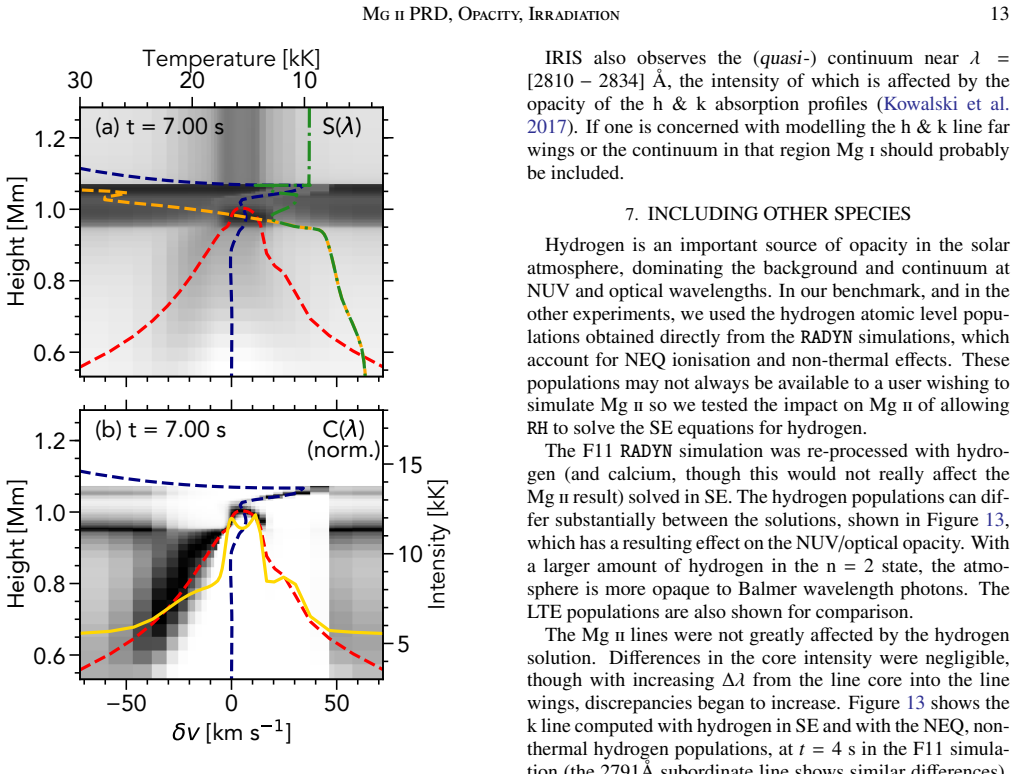
The paper claims that, for the Mg II resonance lines observed by IRIS during flares, the line source function is frequency-dependent and coherent scattering in the line wings persists even at electron densities near $10^{13}$ cm$^{-3}$ reached in the strongest (F11) simulation. In the CRD approximation, every absorbed photon is re-emitted at a frequency drawn from the absorption profile, so wing photons are redistributed into the opaque core; in PRD, a wing photon is re-emitted near its original frequency and can escape. The consequence is that CRD overestimates the inner-wing intensity by up to about 200% in the F11 case and up to 1000% in the F9 case, and it fails to reproduce a blue-wing emission feature that is purely a redistribution effect, not a Doppler shift from an upflow. The same conclusion holds for the subordinate 2791 Å line, where CRD differs by tens of percent. The paper also claims that the fast 'hybrid' angle-dependent PRD scheme reproduces the full angle-dependent solution to within 15–20% in localized wavelength regions while being roughly 400 times faster, and that a 10-level-plus-continuum Mg II model atom is required because a 3-level-plus-continuum atom cannot support the recombination-cascade path that populates the h & k upper levels.
Load-bearing premise
The load-bearing premise is that Mg II level populations are in statistical equilibrium in every RH solution, even though non-equilibrium effects are known to be significant during the first seconds of flare heating and cooling, so the quantitative comparisons between CRD and PRD, and the size of the irradiation effect, could change once time-dependent populations are used.
Editorial extensions
If this is right
- Flare studies that model Mg II with CRD will overestimate inner-wing intensities by factors of 2–10 and may report Doppler features that are actually redistribution artifacts; such results should be re-examined or caveated.
- The hybrid angle-dependent PRD (H-PRD) approximation is a safe default for flare studies even with large velocity fields, reducing computation time by roughly a factor of 400 relative to full AD-PRD, provided users accept localized 15–20% intensity errors.
- A model atom with only the ground state, h & k upper levels, and continuum is inadequate; any Mg II flare modelling must include higher excited levels that funnel recombinations down to the h & k upper levels.
- For the Mg II line cores and near wings, only Mg II and hydrogen need be treated in NLTE; additional species matter only for the far wings and the NUV quasi-continuum.
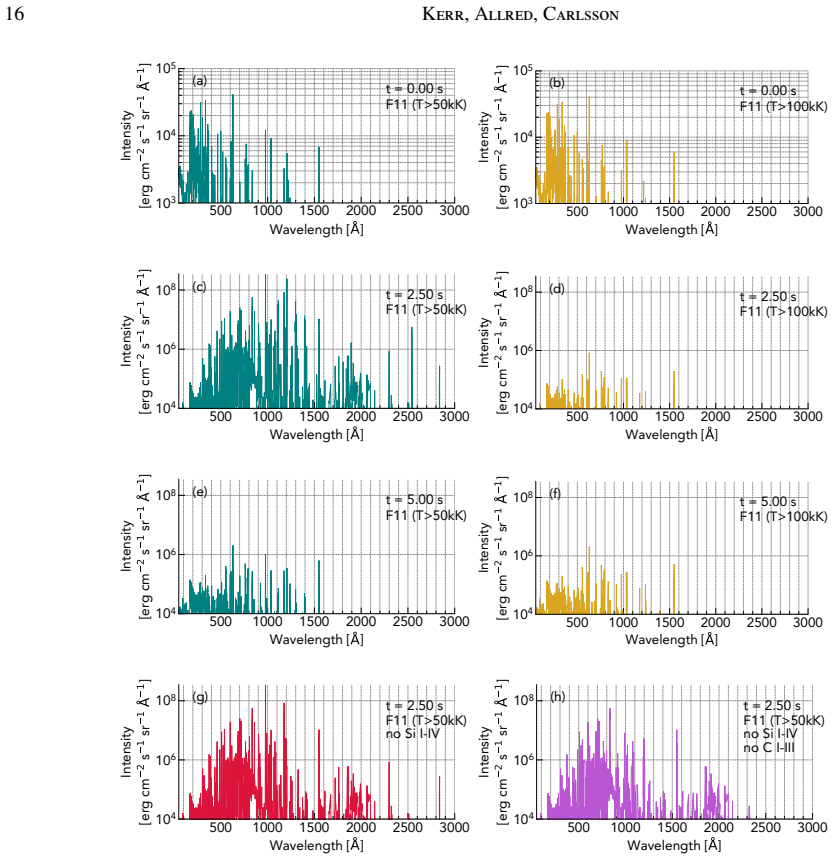
- Lower-mid transition region irradiation should be included when modelling the strongest flares, because it can depress Mg II line intensities by 10–30% during the first few seconds, an effect that depends on the Si and C transitions included in the irradiating spectrum.
Reading between the lines
- If PRD-only wing features like the blue-wing bump are real, then some reported upflow/downflow asymmetries in observed flare Mg II profiles may be misattributed to mass motions; a direct comparison of the synthetic PRD profiles with IRIS observations at the same flare phase would settle how often this happens.
- The same CRD-vs-PRD failure mode likely affects other optically thick chromospheric lines formed by scattering, such as Ca II K, where the paper notes a similar blue-wing bump appears; the density thresholds found here may transfer to those lines.
- Because the paper assumes statistical equilibrium for Mg II, and the authors themselves found NEQ effects matter in the heating/cooling phase, the irradiation effect (largest at t < 5 s) and the exact percentage CRD/PRD differences could shift once Paper II introduces NEQ Mg II populations; the early-time numbers are the least secure.
- A testable extension: run the same RH experiments with microturbulence treated as a free parameter across a grid (e.g., 0–20 km/s) to map when the CRD and PRD wing intensities converge; the paper's single 10 km/s test suggests the conclusion is robust, but a systematic grid would give observers a way to invert for turbulence.
Signed reviews
Editorial analysis
A structured set of objections, weighed in public.
Referee Report
Summary. This paper systematically tests how the choice of radiation-transfer physics affects forward models of the flaring Mg II spectrum. The authors post-process snapshots from three RADYN electron-beam flare simulations (F9, F10, F11) with the RH code and compare a standard baseline setup against variants: complete versus partial frequency redistribution (CRD versus PRD), hybrid versus angle-dependent PRD, smaller versus larger Mg II model atoms, omission versus inclusion of Mg I, statistical-equilibrium versus non-equilibrium hydrogen populations, inclusion of additional NLTE species, and the addition of downward transition-region/coronal irradiation. The main claims are that PRD remains necessary even for the strongest flare, that the fast hybrid PRD is acceptable for most purposes, that only hydrogen and Mg II need to be solved in NLTE for the line cores, that Mg I matters mainly for the NUV quasi-continuum, that the non-equilibrium hydrogen populations from RADYN are preferable to SE populations, that a minimal three-level-plus-continuum Mg II atom is insufficient, and that lower-mid transition-region irradiation can affect Mg II formation. The paper also describes two RH code modifications: fixing user-provided active-species populations and injecting a CHIANTI-based irradiating spectrum.
Significance. If the results hold, this paper provides a valuable benchmark for the IRIS-era Mg II flare modeling community. Its strengths are the quantitative, internally consistent comparisons; the use of contribution functions to diagnose line formation; the explicit testing of alternatives such as microturbulence and irradiation thresholds; and the detailed description of code modifications that others can adopt. The PRD-required conclusion is robust and well supported by the comparison of CRD and PRD profiles, including the wing-feature analysis in Section 3.2. The main limitation acknowledged by the authors is that all Mg II populations are computed in statistical equilibrium, which is a significant caveat for the quantitative claims, particularly the irradiation result.
major comments (2)
- [Section 9, final paragraph; Section 8, t < 5 s] Every RH solution in this paper computes Mg II populations in statistical equilibrium (Section 2.3), and the paper states in Section 9 that non-equilibrium effects 'do have an impact during the initial heating and cooling phase of the flares.' The irradiation effect is confined to exactly that phase: Section 8 states the effect 'was only present at t < 5 s, when the coronal irradiation was maximum.' Because the quantitative comparisons throughout the paper, and especially the 10-30% irradiation-induced intensity changes reported in Section 9(vii), rest on SE Mg II populations at early times, the SE assumption is load-bearing for the quantitative content of the conclusions. The PRD-required conclusion in Section 3.1 is robust to this caveat, but the abstract and conclusions should either explicitly state that all quantitative percentages are conditional on the adequacy of SE for Mg II, or the authors should add a test comparing SE and NEQ Mg II populations for at least one snapshot at t < 5 s. Deferring this test to Paper II is acceptable only if the present paper's claims are worded as provisional.
- [Section 8, Figures 14 and 15] The irradiation module assumes optically thin emission from cells above T > 50 kK and integrates the CHIANTI emissivity to form a downward-directed injected spectrum. The paper itself notes that certain species, such as Si IV and C III, can become optically thick in flares, and the sensitivity experiments in Figure 14(g,h) and Figure 15 remove Si I-IV and C I-III transitions. Since removing these transitions substantially reduces the reported intensity changes, the magnitude of the irradiation effect in the 'standard' case is strongly dependent on the optically thin assumption for lines that the authors suspect are not optically thin. The paper should state explicitly that the 20-40% values are upper bounds under the optically thin assumption, or provide an estimate of the effect of finite line opacity on the injected spectrum. As written, Section 9(vii) presents the irradiation result more decisively than the modeling assumptions support.
minor comments (5)
- [Section 3.2] The text says the line core is located in the redshifted component at '~lambda_rest,k + 25 Å'; this should presumably be approximately +0.25 Å (or the equivalent Doppler shift in km/s), since 25 Å is far outside the plotted wavelength range.
- [Section 9(iv)] The sentence 'The dominant sources of opacity at the MgII resonance line cores and near wings are are Mg II and hydrogen' contains a duplicated 'are'; please correct this typo.
- [Section 8] In the description of converting emissivities to an injected intensity, the text 'This is is then integrated through height' contains a duplicated 'is'; please correct the typo.
- [Section 4] The timing comparison between H-PRD and AD-PRD (3-4 days versus a few minutes, and the factor of 400) would be more reproducible if the machine, number of cores, and convergence criteria were specified in a footnote or in the code description.
- [References] Kerr et al. (2019a), the companion paper containing the non-equilibrium Mg II results, is listed as 'In Prep.'; since the SE caveat is central to the present paper's conclusions, a published or at least public reference would strengthen the discussion.
Circularity Check
No circularity: all central results are internal model experiments with no Mg II fitting; the SE assumption is an acknowledged limitation, not a constructed equivalence.
full rationale
The paper's claims are comparative radiative-transfer experiments performed on the same RADYN flare snapshots, and no Mg II spectrum or line quantity is fitted and then re-presented as a prediction. The CRD-vs-PRD conclusion follows from directly solving the same atmosphere under two redistribution prescriptions and comparing emergent intensities; the H-PRD approximation is tested within the paper against AD-PRD rather than assumed on the authority of Leenaarts et al. (2012). The NEQ hydrogen populations are supplied by RADYN, an independent radiation-hydrodynamics code, and their effect is shown by contrasting RH solutions with SE hydrogen. The coronal-irradiation module uses a CHIANTI emissivity grid and its effect is demonstrated by turning the injected radiation on and off, including a threshold sensitivity test. The only significant caveat is statistical equilibrium for Mg II, explicitly flagged in Sections 2.3 and 9 and deferred to Kerr et al. (2019a, Paper II). That is a correctness and robustness limitation on early-time quantitative percentages, not a circular step: SE is imposed uniformly on all configurations and is not derived from, nor fitted to, the Mg II spectra being modelled. No load-bearing self-citation supplies the main result, so there is no circularity.
Assumptions & free parameters
free parameters (4)
- Microturbulence =
2 km/s nominal; 10 km/s test
- Irradiation temperature threshold =
50 kK (100 kK test)
- Electron beam parameters (F, delta, E_c) =
F = 1e9, 1e10, 1e11 erg cm^-2 s^-1; delta = 5; E_c = 20 keV
- Irradiating spectrum content =
CHIANTI transitions except He and RH-solved lines; variants removing Si i-IV and C i-III
assumptions (5)
- domain assumption RH's coupled NLTE statistical equilibrium and radiation transfer solver (MALI) with the specified atomic models produces correct synthetic Mg II spectra for a given atmosphere and populations.
- domain assumption The RADYN 1D plane-parallel electron-beam flare atmospheres are representative of the flaring chromosphere where IRIS Mg II forms.
- domain assumption Non-equilibrium hydrogen populations from RADYN, computed under CRD with non-thermal rates, are adequate fixed inputs for RH background opacity.
- ad hoc to paper TR and coronal irradiation can be treated as optically thin emission from cells above T > 50 kK, with CHIANTI emissivities, injected downward from the loop apex.
- ad hoc to paper Statistical equilibrium for Mg II level populations is sufficient for the comparative conclusions of this study.
Cite this review
Pith. "Pith review of Modelling Mg II During Solar Flares. I. Partial Frequency Redistribution, Opacity, and Coronal Irradiation." pith.science (2026). https://pith.science/paper/NBQ5OPO3
@misc{pith2026190805329,
  author       = {Pith},
  title        = {Pith review of: Modelling Mg II During Solar Flares. I. Partial Frequency Redistribution, Opacity, and Coronal Irradiation},
  year         = {2026},
  howpublished = {\url{https://pith.science/paper/NBQ5OPO3}},
  note         = {Machine review of arXiv:1908.05329}
}
read the original abstract
The Interface Region Imaging Spectrograph (IRIS) has routinely observed the flaring Mg II NUV spectrum, offering excellent diagnostic potential and a window into the location of energy deposition. A number of studies have forward modelled both the general properties of these lines and specific flare observations. Generally these have forward modelled radiation via post-processing of snapshots from hydrodynamic flare simulations through radiation transfer codes. There has, however, not been a study of how the physics included in these radiation transport codes affects the solution. A baseline setup for forward modelling MgII in flares is presented and contrasted with approaches that add or remove complexity. It is shown for Mg II: (1) PRD is still required during flare simulations despite the increased densities, (2) using full angle-dependent PRD affects the solution but takes significantly longer to process a snapshot, (3) including Mg I in NLTE results in negligible differences to the Mg II lines but does affect the NUV quasi-continuum, (4) only hydrogen and Mg II need to be included in NLTE, (5) ideally the non-equilibrium hydrogen populations, with non-thermal collisional rates, should be used rather than the statistical equilibrium populations, (6) an atom consisting of only the ground state, h & k upper levels, and continuum level is insufficient to model the resonance lines, and (7) irradiation from a hot, dense flaring transition region can affect the formation of Mg II. We discuss modifications to the RH code allowing straightforward inclusion of transition region and coronal irradiation in flares.
Figures


Figures from the paper (11 more)






Reference graph
Works this paper leans on
- [1]
-
[2]
C., Hawley, S
Allred, J. C., Hawley, S. L., Abbett, W. P., & Carlsson, M. 2005, ApJ, 630, 573
2005
-
[3]
C., Kowalski, A
Allred, J. C., Kowalski, A. F., & Carlsson, M. 2015, ApJ, 809, 104
2015
-
[4]
Allred, J. C., Kowalski, A. F., Kerr, G. S., & Alaoui, M. 2019, In Prep
work page 2019
-
[5]
Brown, J. C. 1971, SoPh, 18, 489
work page 1971
-
[6]
Brown, S. A., Fletcher, L., Kerr, G. S., et al. 2018, ApJ, 862, 59 Caffau, E., Ludwig, H.-G., Steffen, M., Freytag, B., & Bonifacio, P. 2011, SoPh, 268, 255
work page 2018
-
[7]
1998, in Lecture Notes in Physics, Berlin Springer
Carlsson, M. 1998, in Lecture Notes in Physics, Berlin Springer
work page 1998
-
[8]
Carlsson, M., & Judge, P. G. 1993, ApJ, 402, 344
work page 1993
Show all 50 references
-
[9]
2015, ApJL, 809, L30
Carlsson, M., Leenaarts, J., & De Pontieu, B. 2015, ApJL, 809, L30
2015
-
[10]
Carlsson, M., & Stein, R. F. 1992, ApJL, 397, L59 —. 1997, ApJL, 481, 500 —. 2002, ApJ, 572, 626 De Pontieu, B., Title, A. M., Lemen, J. R., et al. 2014, SoPh, 289, 2733
1992
-
[11]
Young, P. R. 1997, A&AS, 125, doi:10.1051/aas:1997368
1997 doi
-
[12]
C., & Gan, W
Fang, C., Henoux, J. C., & Gan, W. Q. 1993, A&A, 274, 917
1993
-
[13]
Feldman, U., & Doschek, G. A. 1977, ApJL, 212, L147
1977
-
[14]
Fletcher, L., & Hudson, H. S. 2008, ApJ, 675, 1645
2008
-
[15]
R., Hudson, H
Fletcher, L., Dennis, B. R., Hudson, H. S., et al. 2011, SSRv, 159, 19
2011
-
[16]
P., Carlsson, M., & Leenaarts, J
Golding, T. P., Carlsson, M., & Leenaarts, J. 2014, ApJ, 784, 30
2014
-
[17]
R., & Cauzzi, G
Graham, D. R., & Cauzzi, G. 2015, ApJL, 807, L22
2015
-
[18]
D., Aschwanden, M
Holman, G. D., Aschwanden, M. J., Aurass, H., et al. 2011, SSRv, 159, 107 Huben´y, I. 1982, JQSRT, 27, 593
2011
-
[19]
Hubeny, I., & Lites, B. W. 1995, ApJ, 455, 376
1995
-
[20]
A., Judge, P
Jaeggli, S. A., Judge, P. G., & Daw, A. N. 2018, ApJ, 855, 134
2018
-
[21]
S., Fletcher, L., Russell, A
Kerr, G. S., Fletcher, L., Russell, A. J. B., & Allred, J. C. 2016, ApJ, 827, 101
2016
-
[22]
S., Sim˜oes, P
Kerr, G. S., Sim˜oes, P. J. A., Qiu, J., & Fletcher, L. 2015, A&A, 582, A50
2015
-
[23]
L., & Parkinson, W
Kohl, J. L., & Parkinson, W. H. 1976, ApJ, 205, 599
1976
-
[24]
F., Allred, J
Kowalski, A. F., Allred, J. C., Daw, A., Cauzzi, G., & Carlsson, M. 2017, ApJ, 836, 12
2017
-
[25]
Kuridze, D., Mathioudakis, M., Sim˜oes, P. J. A., et al. 2015, ApJ, 813, 125
2015
-
[26]
R., Dere, K
Landi, E., Young, P. R., Dere, K. P., Del Zanna, G., & Mason, H. E. 2013, ApJ, 763, 86
2013
-
[27]
2012, A&A, 543, A109
Leenaarts, J., Pereira, T., & Uitenbroek, H. 2012, A&A, 543, A109
2012
-
[28]
1984, SoPh, 90, 63
Lemaire, P., Choucq-Bruston, M., & Vial, J.-C. 1984, SoPh, 90, 63
1984
-
[29]
1973, A&A, 22, 61
Lemaire, P., & Skumanich, A. 1973, A&A, 22, 61
1973
-
[30]
2019, A&A, 621, A35
Libbrecht, T., de la Cruz Rodr´ıguez, J., Danilovic, S., Leenaarts, J., & Pazira, H. 2019, A&A, 621, A35
2019
-
[31]
2015, ApJ, 813, 34
Lin, H.-H., & Carlsson, M. 2015, ApJ, 813, 34
2015
-
[32]
P., Dennis, B
Lin, R. P., Dennis, B. R., Hurford, G. J., et al. 2002, SoPh, 210, 3
2002
-
[33]
2015, SoPh, 290, 3525
Liu, W., Heinzel, P., Kleint, L., & Kaˇsparov´a, J. 2015, SoPh, 290, 3525
2015
-
[34]
2009, Landolt B¨ornstein, 712
Lodders, K., Palme, H., & Gail, H.-P. 2009, Landolt B¨ornstein, 712
2009
-
[35]
1986, A&A, 163, 135
Magain, P. 1986, A&A, 163, 135
1986
-
[36]
W., & Mihalas, D
Milkey, R. W., & Mihalas, D. 1974, ApJ, 192, 769
1974
-
[37]
O., Kerr, G
Milligan, R. O., Kerr, G. S., Dennis, B. R., et al. 2014, ApJ, 793, 70
2014
-
[38]
2018, ApJ, 861, 62
Panos, B., Kleint, L., Huwyler, C., et al. 2018, ApJ, 861, 62
2018
-
[39]
Pereira, T. M. D., Carlsson, M., De Pontieu, B., & Hansteen, V . 2015, ApJ, 806, 14
2015
-
[40]
W., Bradshaw, S
Reep, J. W., Bradshaw, S. J., Crump, N. A., & Warren, H. P. 2019, ApJ, 871, 18
2019
-
[41]
W., Russell, A
Reep, J. W., Russell, A. J. B., Tarr, L. A., & Leake, J. E. 2018, ApJ, 853, 101 20 K err, Allred, Carlsson Rubio da Costa, F., & Kleint, L. 2017, ApJ, 842, 82
2018
-
[42]
B., & Hummer, D
Rybicki, G. B., & Hummer, D. G. 1991, A&A, 245, 171 —. 1992, A&A, 262, 209
1991
-
[43]
T., Reames, D
Schmelz, J. T., Reames, D. V ., von Steiger, R., & Basu, S. 2012, ApJ, 755, 33
2012
-
[44]
F., & Auer, L
Smith, D. F., & Auer, L. H. 1980, ApJ, 238, 1126
1980
-
[45]
1995, A&A, 295, 517
Staath, E., & Lemaire, P. 1995, A&A, 295, 517
1995
-
[46]
J., et al
Tei, A., Sakaue, T., Okamoto, T. J., et al. 2018, PASJ, 70, 100
2018
-
[47]
2018, ApJ, 856, 34
Tian, H., & Chen, N.-H. 2018, ApJ, 856, 34
2018
-
[48]
2001, ApJ, 557, 389 —
Uitenbroek, H. 2001, ApJ, 557, 389 —. 2002, ApJ, 565, 1312
2001
-
[49]
2016, ApJ, 819, 89
Xu, Y ., Cao, W., Ding, M., et al. 2016, ApJ, 819, 89
2016
-
[50]
F., Tian, H., et al
Zhu, Y ., Kowalski, A. F., Tian, H., et al. 2019, arXiv e-prints, arXiv:1904.12285 Mg ii PRD, Opacity, Irradiation 21 APPENDIX A. LYα PRD Here we show Lyα line profiles and hydrogen populations, for RADYN flare snapshots forward modelled using RH, comparing the PRD and CRD solut...
2019 arXiv
Reviewed August 14, 2026 · model on record in the stance chip above.
Discussion (0). Continue with ORCID to comment.