REVIEW 2 major objections 5 minor 12 references
Electronic Structure of UTe$_2$ Studied by Photoelectron Spectroscopy
T0 review · 2 major / 5 minor · reviewed 2026-08-14 · deepseek-v4-flash
Pith's one-line read The paper uses resonant and angle-resolved photoelectron spectroscopy to argue that the uranium $5f$ electrons in UTe$_2$ are itinerant yet strongly correlated, with an unexplained admixture into the tellurium bands.
desk verdict First RPES/ARPES on UTe2: itinerant 5f quasiparticles and a correlation-induced incoherent peak are credible, but the 'enhanced U5f–Te5p hybridization' claim rides on a weak, under-controlled difference spectrum and should not survive in its current form. read the letter →
The pith
A machine-rendered reading of the paper's core claim, the machinery that carries it, and where it could break.
The reading
What carries the argument
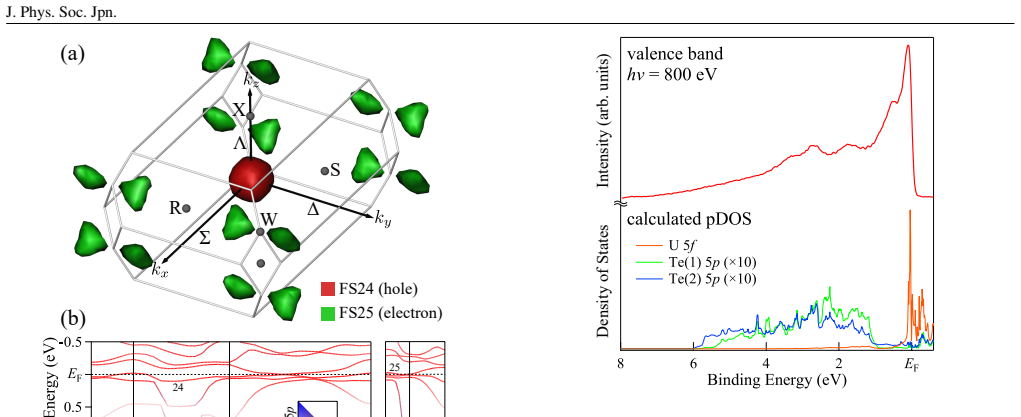
The key experimental method is U $4d$--$5f$ resonant photoelectron spectroscopy (RPES), in which the photon energy is tuned across the U $4d_{5/2}$ absorption edge to resonantly enhance photoemission from the U $5f$ states. The central object is the difference spectrum between on- and off-resonance photon energies, which isolates the partial U $5f$ density of states and divides the valence band into region A ($E_B \lesssim 0.2$ eV), region B ($0.2 \lesssim E_B \lesssim 1.0$ eV), and region C ($1.0 \lesssim E_B \lesssim 3.5$ eV). On the theory side, relativistic linear augmented plane wave calculations within the local density approximation provide the itinerant reference, and ARPES simulations that include $k_z$ broadening, photohole lifetime, photoionization cross sections, and resolution allow a band-by-band comparison. The extra intensity in regions B and C of the RPES difference spectrum is what carries the claim that correlation and hybridization go beyond the LDA picture.
What would settle it
Measure the same difference spectra with several off-resonant photon energies around the U $4d_{5/2}$ edge, and separately perform resonant photoemission across the Te $3d$ or $4d$ edge on the same crystals. If region C disappears when the tellurium edge is tuned into resonance, the apparent U $5f$ admixture is a subtraction artifact; if it persists, the Te $5p$ bands genuinely carry uranium $5f$ weight. A second decisive check is a many-body calculation with the Te $5p$ states explicitly in the correlated subspace, compared against the measured U $5f$ partial density of states.
Extended reading notes
Core claim
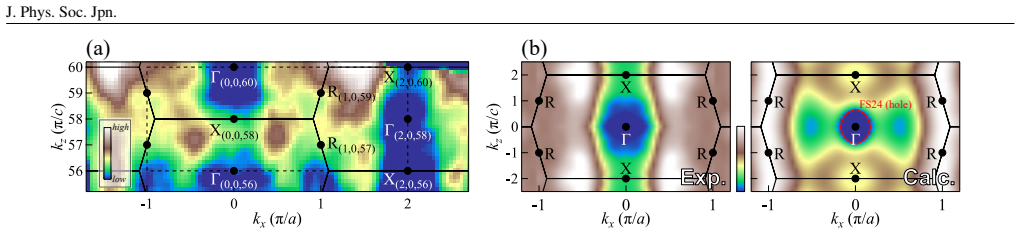
The paper's central result, stated in its summary, is that the U $5f$ states of UTe$_2$ have an itinerant but strongly-correlated nature with enhanced hybridization with the Te $5p$ states. Resonant photoemission across the U $4d_{5/2}$ absorption edge reveals three binding-energy regions: a sharp enhancement just below $E_F$ assigned to itinerant quasiparticle bands; an incoherent peak near 0.5--0.6 eV; and a weak enhancement between 1 and 3.5 eV where band structure calculations place only Te $5p$ weight. ARPES finds that the dispersive band just below $E_F$ matches calculated band 22, while the non-dispersive 0.5--0.6 eV feature has no calculated counterpart. The Fermi surface map in the $k_x$--$k_z$ plane resembles the calculated hole pocket of band 24, although individual Fermi surface sheets are not resolved. The paper concludes that the electronic structure is an itinerant $5f$ model plus strong-correlation corrections, with an unexplained uranium--tellurium hybridization.
Load-bearing premise
The claim of anomalous U $5f$ weight in the Te $5p$ bands rests on the assumption that the off-resonance spectrum at 725 eV is a clean reference, so that subtracting it from the on-resonance spectra leaves only genuine U $5f$ intensity and no residual Te $5p$ or surface contribution in region C.
Editorial extensions
If this is right
- Models of UTe$_2$ superconductivity should start from an itinerant but strongly renormalized $5f$-electron description, since the measured quasiparticle bands near $E_F$ match LDA band 22 while also showing incoherent weight.
- The 0.5--0.6 eV non-dispersive feature gives a concrete, energy-resolved benchmark that many-body calculations of UTe$_2$ must reproduce.
- A correct description of UTe$_2$ also has to explain U $5f$ weight inside the Te $5p$ bands at 1--3.5 eV, a feature absent from the LDA bands.
- Because bands 24 and 25 have extrema within roughly 20 meV of $E_F$, small changes in band filling could alter the Fermi surface topology, so the experimental indistinguishability of the Fermi surface sheets leaves this sensitivity unresolved.
Reading between the lines
- If the region-C enhancement is intrinsic, UTe$_2$ is a clear case where a ligand band acquires $5f$ weight beyond standard LDA; a natural next experiment is photon-energy-dependent RPES across the Te $3d$ or $4d$ edge to see whether the apparent admixture appears when tellurium is the resonantly enhanced species.
- The anomalous admixture could plausibly reflect energy-dependent or orbital-dependent U--Te hybridization; a many-body calculation that puts the Te $5p$ states in the correlated subspace is a testable route to reproducing region C.
- The extremely shallow Fermi-surface pockets imply that stoichiometry, strain, or pressure could drive UTe$_2$ between electron- and hole-pocket regimes, which may matter for interpreting the pressure dependence of its superconductivity.
Signed reviews
Editorial analysis
A structured set of objections, weighed in public.
Referee Report
Summary. The manuscript reports soft-x-ray resonant photoelectron spectroscopy (RPES) and angle-resolved photoelectron spectroscopy (ARPES) measurements of UTe2 single crystals, combined with LDA band-structure calculations. In the U 4d–5f RPES data the authors identify three binding-energy regions: a near-EF enhancement (region A) assigned to itinerant U 5f quasiparticle bands; an enhancement at 0.2–1.0 eV (region B) assigned to an incoherent peak from strong correlations; and a weak enhancement at 1–3.5 eV (region C) interpreted as an anomalous U 5f admixture into Te 5p bands. The ARPES data in the kx–kz plane are compared with LDA calculations and simulated ARPES maps; the parabolic dispersion of band 22 and the overall Fermi-surface map are found to be broadly consistent with the calculations, while a non-dispersive feature at EB ~0.5–0.6 eV is assigned to the incoherent peak. The Fermi-surface topology is not fully resolved. The authors conclude that the U 5f states of UTe2 are itinerant but strongly correlated, with enhanced hybridization with Te 5p states.
Significance. The paper is one of the first direct electronic-structure studies of UTe2 and provides useful experimental constraints for a material whose normal-state electronic structure is still poorly characterized. Its strengths are the explicit comparison to external LDA calculations rather than a fitted model, the inclusion of realistic simulations of the ARPES spectra (kz broadening, photohole lifetime, matrix elements, and resolution), and the identification of a clear non-dispersive feature at 0.5–0.6 eV that is absent from the LDA band structure. If the region-C RPES enhancement is confirmed to be intrinsic U 5f weight, the observation of U 5f admixture into the Te 5p manifold would be a notable result not captured by LDA and relevant to the hybridization physics of UTe2. At present, however, that specific part of the central claim is not quantitatively established because it rests on a weak difference-spectrum feature with an unexplained choice of off-resonant reference and no uncertainty assessment.
major comments (2)
- [Fig. 4; RPES analysis of region C] The 'anomalous admixture of the U 5f states into the Te 5p bands' at EB = 1–3.5 eV, which is the experimental basis for the abstract's 'enhanced hybridization with the Te 5p states,' rests entirely on the difference spectrum shown in Fig. 4(b,c). The text and Fig. 4(a) define hν = 725 eV as the complete off-resonant condition and state that all differences are taken against the spectrum at 725 eV after normalization to its maximum. However, the quantitative difference spectrum in Fig. 4(b,c) uses hν = 731 eV as the off-resonant reference, and 731 eV lies on the rising edge of the U 4d5/2 absorption feature. The weak region-C enhancement therefore depends on an unjustified change of reference and on the choice of normalization; the paper provides no error bars, no repeated scans, and no photon-energy dependence check to show that the enhancement is intrinsic U 5f weight rather than a Te 5p matrix-element or background variation. Because the paper itself states that the origin of the anomalous admixture is not understood, the conclusion of enhanced hybridization is not quantitatively supported. I request that the authors present the difference against the 725 eV reference, demonstrate the stability of region C under changes of the off-resonant photon energy and normalization, and provide an uncertainty estimate, or that they soften the hybridization claim accordingly.
- [Abstract and summary; quantitative basis of the hybridization claim] Even if the off-resonant subtraction issue is resolved, the statement that the U 5f–Te 5p hybridization is 'enhanced' relative to the band-structure calculation is not quantified. The manuscript shows that the difference spectrum has finite intensity in region C, but it does not estimate the U 5f spectral weight in that region, its ratio to the Te 5p weight, or the hybridization strength implied by the admixture. Without such a quantitative comparison, 'enhanced hybridization' is an interpretation rather than a measured result. The abstract and summary should state the weaker conclusion that a finite U 5f contribution in the Te 5p region is observed, unless a quantitative analysis is added.
minor comments (5)
- [Abstract] The sentence 'its overall band structure were mostly explained by band structure calculations' has a subject-verb agreement error; 'were' should be 'was'.
- [RPES results, Fig. 4(c)] The text states that the calculated U 5f pDOS was multiplied by the Fermi–Dirac function and broadened by the instrumental energy resolution, but it does not state whether photohole lifetime broadening was included; omitting lifetime broadening makes the comparison of spectral widths in Fig. 4(c) difficult to interpret, and the authors should specify the broadening procedure in full.
- [ARPES methodology] The inner potential V0 = 12 eV is used without a sensitivity check; because the kz assignment of the ARPES cuts and the Fermi-surface map depends on this choice, a brief test of V0 would strengthen the assignment of band 22 and the Fermi-surface comparison.
- [Fermi surface map, Fig. 7] The statement that differences in intensity are due to the momentum matrix element effect is plausible, but it is presented as a fact; the authors should label it as an assumption or support it with a matrix-element calculation.
- [General] There is a typographical error in the text 'Figure. 4 (b)'; it should read 'Figure 4(b)'.
Circularity Check
No circular derivation: the paper's claims are conclusions drawn from measured RPES/ARPES spectra compared with an independent LDA band calculation.
full rationale
The paper does not derive its central claims from the quantities it sets out to predict. The U 5f partial density of states and the ARPES band dispersions are measured, and the calculated LDA bands are produced externally with no adjustable parameters targeted at UTe2's photoemission features. The RPES difference spectra, including the weak region-C enhancement, are experimental observables; the paper explicitly states that the anomalous admixture 'is not understood at present', which confirms it is presented as a finding rather than as a consequence of the calculation. Self-citations (Refs. 3, 4, 6, 9, 11) are used only for experimental conventions (background subtraction, ARPES simulation details, inner potential) and for analogies with other uranium compounds; none of these citations supplies the conclusion that UTe2 is itinerant but strongly correlated, nor the claim of enhanced U5f-Te5p hybridization. A possible systematic issue with the off-resonance reference (Fig. 4(b) uses 731 eV while the text calls 725 eV 'complete off-resonant'), and the absence of error bars on the region-C difference spectrum, are data-quality concerns rather than circularity; they do not make any prediction equal its input by construction. Score 1 reflects only minor self-citation in interpretive comparisons, with no load-bearing circular step.
Assumptions & free parameters
free parameters (2)
- Inner potential V0 for ARPES momentum mapping =
12 eV
- ARPES simulation broadening parameters (kz broadening, photohole lifetime, energy and angular resolution) =
Not stated in paper; taken from Ref. 11
assumptions (4)
- domain assumption Free-electron final-state dispersion with inner potential V0 = 12 eV accurately converts ARPES angles and photon energies to momentum.
- domain assumption The spectrum at hν = 725 eV is completely off-resonant, so subtracting it from on-resonance spectra isolates U 5f emission.
- domain assumption LDA with all U 5f electrons treated as itinerant is an appropriate reference for the itinerant part of the spectral function.
- domain assumption The non-dispersive feature at EB = 0.5-0.6 eV is intrinsic bulk electronic structure rather than a surface state or matrix-element artifact.
Cite this review
Pith. "Pith review of Electronic Structure of UTe$_2$ Studied by Photoelectron Spectroscopy." pith.science (2026). https://pith.science/paper/NE2KSHIC
@misc{pith2026190809418,
  author       = {Pith},
  title        = {Pith review of: Electronic Structure of UTe$_2$ Studied by Photoelectron Spectroscopy},
  year         = {2026},
  howpublished = {\url{https://pith.science/paper/NE2KSHIC}},
  note         = {Machine review of arXiv:1908.09418}
}
abstract
The electronic structure of the unconventional superconductor UTe$_2$ was studied by resonant photoelectron spectroscopy (RPES) and angle-resolved photoelectron spectroscopy (ARPES) with soft X-ray synchrotron radiation. The partial $\mathrm{U}~5f$ density of states of UTe$_2$ were imaged by the $\mathrm{U}~4d$--$5f$ RPES and it was found that the $\mathrm{U}~5f$ state has an itinerant character, but there exists an incoherent peak due to the strong electron correlation effects. Furthermore, an anomalous admixture of the $\mathrm{U}~5f$ states into the $\mathrm{Te}~5p$ bands was observed at a higher binding energy, which cannot be explained by band structure calculations. On the other hand, the band structure of UTe$_2$ was obtained by ARPES and its overall band structure were mostly explained by band structure calculations. These results suggest that the $\mathrm{U}~5f$ states of UTe$_2$ have itinerant but strongly-correlated nature with enhanced hybridization with the $\mathrm{Te}~5p$ states.
Figures


Figures from the paper (3 more)


Reference graph
Works this paper leans on
-
[1]
" write newline "" before.all 'output.state := FUNCTION fin.entry add.period write newline FUNCTION new.block output.state before.all = 'skip after.block 'output.state := if FUNCTION add.blank " " * before.all 'output.state := FUNCTION add.colon ": " * before.all 'output.state := FUNCTION new.sentence output.state after.block = 'skip output.state before.a...
-
[2]
S. Ran, C. Eckberg, Q.-P. Ding, Y. Furukawa, T. Metz, S. R. Saha, I.-L. Liu, M. Zic, H. Kim, J. Paglione, and N. P. Butch: Science 365 (2019) 684
work page 2019
-
[3]
D. Aoki, A. Nakamura, F. Honda, D. Li, Y. Homma, Y. Shimizu, Y. J. Sato, G. Knebel, J.-P. Brison, A. Pourret, D. Braithwaite, G. Lapertot, Q. Niu, M. Vali s ka, H. Harima, and J. Flouquet: J. Phys. Soc. Jpn. 88 (2019) 043702
work page 2019
-
[4]
S.-i. Fujimori, M. Kobata, Y. Takeda, T. Okane, Y. Saitoh, A. Fujimori, H. Yamagami, Y. Haga, E. Yamamoto, and Y. O \= O nuki: Phys. Rev. B 99 (2019) 035109
work page 2019
-
[5]
S.-i. Fujimori, Y. Takeda, T. Okane, Y. Saitoh, A. Fujimori, H. Yamagami, Y. Haga, E. Yamamoto, and Y. \=Onuki: J. Phys. Soc. Jpn. 85 (2016) 062001
work page 2016
- [6]
-
[7]
S. Fujimori, T. Ohkochi, I. Kawasaki, A. Yasui, Y. Takeda, T. Okane, Y. Saitoh, A. Fujimori, H. Yamagami, Y. Haga, E. Yamamoto, and Y. O \= O nuki: Phys. Rev. B 91 (2015) 174503
work page 2015
- [8]
Show all 12 references
-
[9]
von Barth and L
U. von Barth and L. Hedin: J. Phys. C: Solid State Phys. 5 (1972) 1629
1972
-
[10]
Fujimori, I
S.-i. Fujimori, I. Kawasaki, A. Yasui, Y. Takeda, T. Okane, Y. Saitoh, A. Fujimori, H. Yamagami, Y. Haga, E. Yamamoto, and Y. O \= O nuki: Phys. Rev. B 89 (2014) 104518
2014
-
[11]
Yeh and I
J. Yeh and I. Lindau: Atomic Data and Nuclear Data Tables 32 (1985) 1
1985
-
[12]
Fujimori, T
S. Fujimori, T. Ohkochi, T. Okane, Y. Saitoh, A. Fujimori, H. Yamagami, Y. Haga, E. Yamamoto, and Y. O \= O nuki: Phys. Rev. B 86 (2012) 235108
2012
Reviewed August 14, 2026 · model on record in the stance chip above.
Discussion (0). Continue with ORCID to comment.