Investigation on the Atmospheric Incoming Flow of a Utility-Scale Wind Turbine using Super-large-scale Particle Image Velocimetry
Pith reviewed 2026-05-24 15:44 UTC · model grok-4.3
The pith
The sonic-SLPIV velocity ratio for incoming flow to a utility-scale wind turbine is normally distributed and below unity 85 percent of the time.
A machine-rendered reading of the paper's core claim, the machinery that carries it, and where it could break.
Core claim
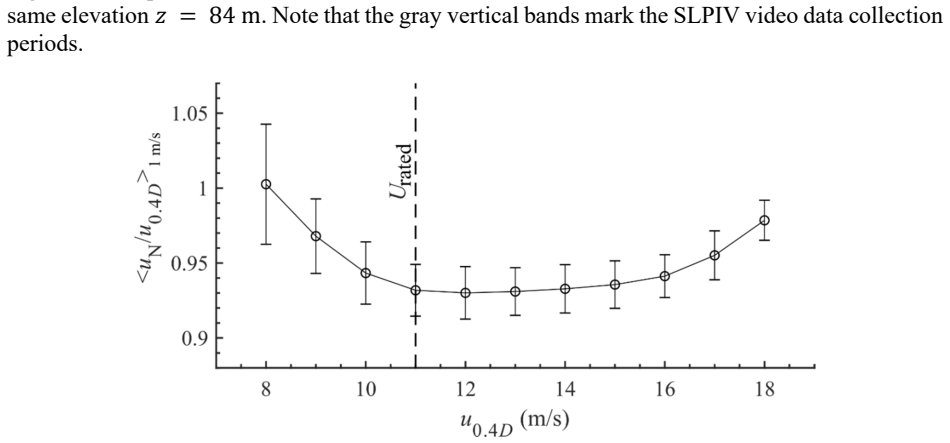
Using SLPIV with snowflakes, the incoming flow shows an induction zone and a region with enhanced vertical velocity. Time series comparisons indicate that the sonic-SLPIV velocity ratio is normally distributed and less than unity 85% of the time. The ratio decreases with wind speed up to rated speed then plateaus and rises, increases in mean and spread with larger yaw error, and exhibits non-monotonic behavior with incidence angle from negative to positive. Short-term velocity fluctuation intensity has limited impact on the ratio.
What carries the argument
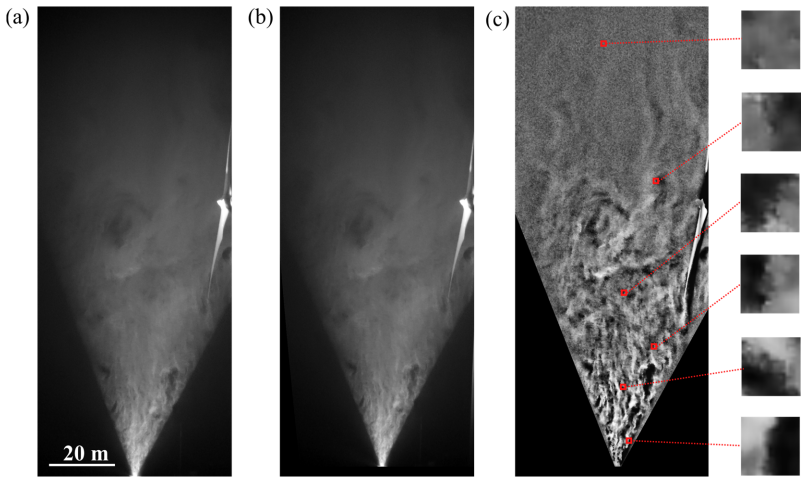
Super-large-scale particle image velocimetry (SLPIV) using natural snowflakes to image the flow field in an 85 m vertical by 40 m streamwise volume 0.2 rotor diameters upstream of the turbine.
If this is right
- The sonic-SLPIV velocity ratio is normally distributed and less than unity 85% of the time.
- The velocity ratio decreases with increasing wind speed up to the rated speed, then plateaus and rises with further increase.
- Larger yaw error leads to an increase in both the mean and the spread of the velocity ratio distribution.
- As incidence angle changes from negative to positive, the velocity ratio first decreases toward zero then plateaus while fluctuations increase.
- The intensity of short-term velocity fluctuation has limited impact on the sonic-SLPIV velocity ratio.
Where Pith is reading between the lines
- Accounting for these ratio variations in control algorithms could reduce errors in estimated power production caused by nacelle sensor placement.
- The non-monotonic incidence angle dependence implies that vertical flow components may interact with blade aerodynamics in ways that affect fatigue loads beyond standard models.
- Repeating the SLPIV campaign across seasons or sites would test whether the reported ratio behaviors generalize beyond the specific turbine and snow conditions observed.
Load-bearing premise
Snowflakes serve as faithful, unbiased tracers of the true atmospheric velocity field throughout the 85 m by 40 m measurement volume without significant settling, clustering, or illumination artifacts that bias the reported velocity ratios.
What would settle it
Simultaneous independent velocity measurements using lidar or a calibrated probe array in the same upstream volume showing that snowflake-derived SLPIV velocities are systematically offset from the true flow.
Figures






read the original abstract
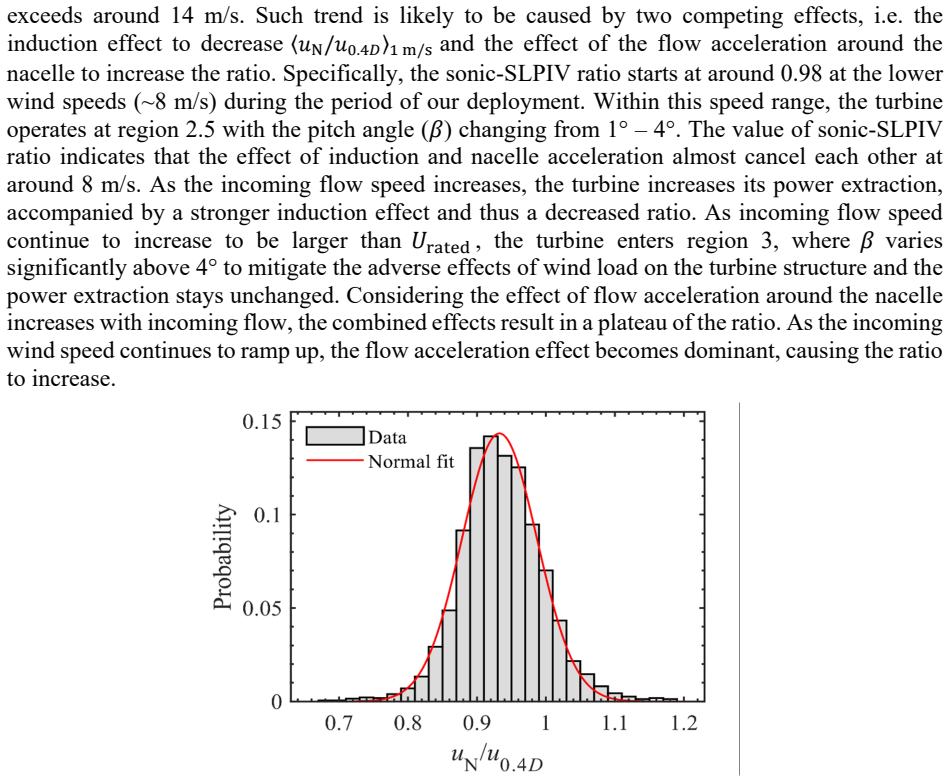
The atmospheric incoming flow of a wind turbine is intimately connected to its power production as well as its structural stability. Here we present an incoming flow measurement of a utility-scale turbine at the high spatio-temporal resolution, using super-large-scale particle image velocimetry (SLPIV) with natural snowflakes. The datasets include over a one-hour duration of incoming flow with a field of view of 85 m (vertical) x 40 m (streamwise) centered at 0.2 rotor diameter upstream of the turbine. The mean flow shows the presence of the induction zone and a distinct region with enhanced vertical velocity. Time series of nacelle sonic anemometer and SLPIV measured streamwise velocity outside the induction zone show generally matched trends with time-varying discrepancies potentially due to the induction effect and the flow acceleration around the nacelle. These discrepancies between the two signals, characterized by the sonic-SLPIV velocity ratio, is normally distributed and is less than unity 85% of the time. The velocity ratio first decreases with increasing wind speed up to around the rated speed of the turbine, then plateaus, and finally rises with a further increase in wind speed. With conditional sampling, the distribution of the velocity ratio shows that larger yaw error leads to an increase in both the mean and the spread of the distribution. Moreover, as the incident angle of the incoming flow changes from negative to positive (i.e. from pointing downward to upward), the velocity ratio first decreases as the angle approaches zero. With further increase of the incidence angle, the ratio then plateaus and fluctuations are augmented. Finally, our results show that the intensity of short-term velocity fluctuation has a limited impact on the sonic-SLPIV velocity ratio.
Editorial analysis
A structured set of objections, weighed in public.
Referee Report
Summary. The paper reports super-large-scale PIV measurements of the incoming atmospheric flow to a utility-scale wind turbine using natural snowflakes as tracers. Over one hour of data are acquired in an 85 m (vertical) by 40 m (streamwise) field of view located 0.2 rotor diameters upstream. The work documents the induction zone, a region of enhanced vertical velocity, and the statistical properties of the ratio between nacelle sonic-anemometer and SLPIV streamwise velocities, which is found to be normally distributed, less than unity 85 % of the time, and to vary systematically with wind speed, yaw error, and incidence angle.
Significance. If the tracer fidelity holds, the measurements supply rare, high-resolution field data on real atmospheric inflow in the induction zone of a full-scale turbine. Such data are valuable for validating CFD and engineering models of turbine aerodynamics and for quantifying the effects of yaw and incidence on local velocity ratios.
major comments (2)
- [Methods / Experimental setup] The entire set of statistical claims (normal distribution of the velocity ratio, 85 % occurrence below unity, conditional trends with wind speed, yaw, and incidence) rests on the unverified premise that snowflakes act as unbiased tracers throughout the 85 m × 40 m volume. No Stokes-number estimate, terminal-fall-speed correction, or test for preferential concentration appears in the methods description; without such checks the reported ratios cannot be interpreted as pure flow quantities.
- [Results / Velocity ratio analysis] The nacelle sonic reference is itself located in a region perturbed by the turbine nacelle and rotor. The manuscript does not present an independent verification (e.g., comparison with a far-upstream reference or a second measurement technique) that would allow the sonic-SLPIV ratio to be cleanly attributed to induction-zone effects rather than local flow distortion around the anemometer.
minor comments (2)
- [Abstract] The abstract states that the velocity ratio “first decreases … then plateaus, and finally rises” with wind speed, but the corresponding figure or table that quantifies the transition points around rated speed is not referenced.
- [Results] Notation for the incidence angle (positive/negative convention) and the precise definition of the sonic-SLPIV ratio should be stated explicitly in the text rather than left to figure captions.
Simulated Author's Rebuttal
We thank the referee for the constructive comments and the opportunity to address concerns regarding tracer fidelity and reference measurement attribution. We respond point-by-point to the major comments below.
read point-by-point responses
-
Referee: [Methods / Experimental setup] The entire set of statistical claims (normal distribution of the velocity ratio, 85 % occurrence below unity, conditional trends with wind speed, yaw, and incidence) rests on the unverified premise that snowflakes act as unbiased tracers throughout the 85 m × 40 m volume. No Stokes-number estimate, terminal-fall-speed correction, or test for preferential concentration appears in the methods description; without such checks the reported ratios cannot be interpreted as pure flow quantities.
Authors: We agree that explicit quantification of tracer response would strengthen the claims. The original manuscript does not contain Stokes-number estimates or preferential-concentration tests. We will add a dedicated paragraph in the Methods section providing a Stokes-number estimate based on representative snowflake diameters (0.5–2 mm) and densities drawn from the literature, together with a note that terminal-fall velocities remain << horizontal flow speeds in the recorded range. Visual inspection of the raw images showed no obvious clustering; this observation will also be stated. These additions will be included in the revised manuscript. revision: yes
-
Referee: [Results / Velocity ratio analysis] The nacelle sonic reference is itself located in a region perturbed by the turbine nacelle and rotor. The manuscript does not present an independent verification (e.g., comparison with a far-upstream reference or a second measurement technique) that would allow the sonic-SLPIV ratio to be cleanly attributed to induction-zone effects rather than local flow distortion around the anemometer.
Authors: We acknowledge the limitation. The manuscript already notes that discrepancies may arise from both induction-zone effects and local acceleration around the nacelle. The systematic dependence of the ratio on wind speed, yaw error, and incidence angle is difficult to explain by nacelle-local distortion alone, because the SLPIV plane lies 0.2 D upstream. Nevertheless, no independent far-upstream reference was deployed during the campaign, so a direct separation of the two contributions cannot be demonstrated. We will expand the Discussion to state this caveat explicitly while retaining the conditional-sampling results as supporting evidence for an upstream-flow contribution. revision: partial
- Independent far-upstream reference measurement to isolate nacelle-local distortion from induction-zone effects (unavailable in the original field campaign).
Circularity Check
No circularity: all results are direct experimental measurements and statistical summaries
full rationale
The paper presents field measurements of incoming flow using SLPIV with natural snowflakes and compares them to nacelle sonic anemometer data. Reported quantities (velocity ratios, distributions, conditional dependencies on wind speed/yaw/incidence) are computed directly from acquired image sequences and time series without any derivations, model equations, fitted parameters renamed as predictions, or self-citation chains. No load-bearing step reduces to its own inputs by construction. The analysis is self-contained against external benchmarks (raw PIV correlations and anemometer readings).
Axiom & Free-Parameter Ledger
axioms (1)
- domain assumption Natural snowflakes act as faithful passive tracers of the atmospheric velocity field across the imaged volume
Reference graph
Works this paper leans on
-
[1]
Introduction Understanding the characteristics of the atmospheric turbulent flow approaching the wind turbine (referred to as the incoming flow hereafter) plays a crucial role in improving the turbine operation for better energy extraction effi ciency and structural reliabil ity. Specifically, for example, the relationship between energy extr action and i...
-
[2]
Experimental Methods 2.1 Field site The measurements of the incoming flow were conducted in the Uni versity of Minnesota EOLOS Wind Research Field Station in Rosemount, Minnesota. The statio n consists of a 2.5 MW three- bladed, horizontal-axis Clipper Liberty wind turbine (referred to as the EOLOS turbine hereafter) with pitch-regulating capability and a...
work page 1920
-
[3]
Power output stays at the rated power at Region 3 with increasing wind speed
The turbine operational region is based on the rotor speed a nd power constraints of the turbine and is determined by incoming flow and the control strategy. Power output stays at the rated power at Region 3 with increasing wind speed. In order to mitigate st rong wind, pitch angle increases almost linearly with increasing wind speed for winds over 𝑈୰ୟ୲ୣୢ...
work page 2017
-
[4]
Results 3.1 Mean flow characteristics of incoming flow Figure 5. Time-averaged SLPIV velocity vector field of Run 1 (1:3 skip applied in both horizontal and vertical directions for cla rity) superimposed with (a) mean horizontal velocity ( 𝑈), and (b) mean vertical velocity ( 𝑊) contours and iso-velocity lines from 8 to 13 m/s and -0.5 to 0.1 m/s, respect...
-
[5]
as shown in Figure 6. According to Medici et al.[23], the incoming flow speed along the turbine axis can be expressed as ሺ௫ሻ ಮ ൌ1െ𝑎 1 మೣ ವ ටଵାቀమೣ ವቁ మ ( 1 ) The figure presents the SLPIV data spatially averaged around hub height (z = 80 m) with a vertical span of ± 1 m. As the figure shows, the experimental data fits reasonably well in the majority o...
-
[6]
Summary and Discussion The current study reports incoming flow measurements of a 2.5 M W pitch-regulated turbine at high spatio-temporal resolution, using super-large-scale particle image velocimetry (SLPIV) with natural snowflakes. The datasets include over one hour duration of incoming flow with an effective field of view 85 m (vertical) ൈ 40 m (streamw...
-
[7]
Wind Shear and Unce rtainties in Power Curve Measurement and Wind Resources
Antoniou I, Pedersen SM, Enevoldsen PB. Wind Shear and Unce rtainties in Power Curve Measurement and Wind Resources. Wind Eng 2009;33:449–68. doi:10.1260/030952409790291208
-
[8]
Yan J, Zhang H, Liu Y, Han S, Li L. Uncertainty estimation for wind energy conversion by probabilistic wind turbine power curve modelling. Appl Energy 2 019;239:1356–70. doi:10.1016/j.apenergy.2019.01.180
-
[9]
Monitoring of wind farms’ power cu rves using machine learning techniques
Marvuglia A, Messineo A. Monitoring of wind farms’ power cu rves using machine learning techniques. Appl Energy 2012;98:574–83. doi:10.1016/j.apenergy.2012.04.037
-
[10]
Rev iew of power curve modelling for windturbines
Carrillo C, Obando Montaño AF, Cidrás J, Díaz-Dorado E. Rev iew of power curve modelling for windturbines. Renew Sustain Energy Rev 2013;21:57 2–81. doi:10.1016/j.rser.2013.01.012
-
[11]
A comprehe nsive review on wind turbine power curve modeling techniques
Lydia M, Kumar SS, Selvakumar AI, Prem Kumar GE. A comprehe nsive review on wind turbine power curve modeling techniques. Renew Sustain Energy R ev 2014;30:452–60. doi:10.1016/j.rser.2013.10.030
-
[12]
Wind turbine power curves incorporating turbule nce intensity
Hedevang E. Wind turbine power curves incorporating turbule nce intensity. Wind Energy 2014;17:173–95. doi:10.1002/we.1566
-
[13]
De velopment of an enhanced parametric model for wind turbine power curve
Taslimi-Renani E, Modiri-Delshad M, Elias MFM, Rahim NA. De velopment of an enhanced parametric model for wind turbine power curve. Appl Energy 2016;177:544–52. doi:10.1016/j.apenergy.2016.05.124
-
[14]
Wind turbine control for load reduction
Bossanyi EA. Wind turbine control for load reduction. Wind Energy 2003;6:229–44. doi:10.1002/we.95
-
[15]
Review of state of the art in smar t rotor control research for wind turbines
Barlas TK, van Kuik GAM. Review of state of the art in smar t rotor control research for wind turbines. Prog Aerosp Sci 2010;46:1–27. doi:10.1016/j.paerosci.2009.08.002
-
[16]
A spinner- integrated wind lidar for enhan ced wind turbine control
Mikkelsen T, Angelou N, Hansen K, Sjöholm M, Harris M, Sli nger C, et al. A spinner- integrated wind lidar for enhan ced wind turbine control. Wind E nergy 2013;16:625–43. doi:10.1002/we.1564
-
[17]
LiDAR-ena bled model predictive control of wind turbines with real-time capabilities
Bottasso CL, Pizzinelli P, Riboldi CED, Tasca L. LiDAR-ena bled model predictive control of wind turbines with real-time capabilities. Renew Energy 2014 ;71:442–52. doi:10.1016/j.renene.2014.05.041
-
[19]
Flow Structure and Turbulence in Wind Farms
Stevens RJAM, Meneveau C. Flow Structure and Turbulence in Wind Farms. Annu Rev Fluid Mech 2017;49:311–39. doi:10.1146/annurev-fluid-010816-060206
-
[20]
Review of computatio nal fluid dynamics for wind turbine wake aerodynamics
Sanderse B, Van der Pijl SP, Koren B. Review of computatio nal fluid dynamics for wind turbine wake aerodynamics. Wind Energy 2011;14:799–819
work page 2011
-
[21]
Field measurements of wind turbine wakes with lidars
Iungo GV, Wu YT, Porté-Agel F. Field measurements of wind turbine wakes with lidars. J Atmos Ocean Technol 2013;30:274–87. doi:10.1175/JTECH-D-12-00051.1
-
[22]
Iungo GV, Porté-Agel F. Volumetric lidar scanning of wind turbine wakes under convective and neutral atmospheric stability regimes. J Atmos Ocean Techno l 2014;31:2035–48. doi:10.1175/JTECH-D-13-00252.1
-
[23]
Banta RM, Pichugina YL, Brewer WA, Lundquist JK, Kelley ND , Sandberg SP, et al. 3D volumetric analysis of wind turbine wake properties in the atmosphere using high-resolution Doppler lidar. J Atmos Ocean Technol 2015;32:904–14. doi:10.117 5/JTECH-D-14- 00078.1
work page 2015
-
[24]
Troldborg N, Zahle F, Réthoré P-E, Sørensen NN. Comparison of wind turbine wake properties in non-sheared inflow predicted by different computational fluid dynamics rotor models. Wind Energy 2015;18:1239–50. doi:10.1002/we.1757
-
[25]
Wake structure in actuator disk models of wind turbines in yaw under uniform infl ow conditions
Howland MF, Bossuyt J, Martínez-Tossas LA, Meyers J, Menev eau C. Wake structure in actuator disk models of wind turbines in yaw under uniform infl ow conditions. J Renew Sustain Energy 2016;8. doi:10.1063/1.4955091
-
[26]
High resolution wind turbine wake measurements with a scanning lidar
Herges TG, Maniaci DC, Naughton BT, Mikkelsen T, Sjöholm M . High resolution wind turbine wake measurements with a scanning lidar. J Phys Conf Se r 2017;854:0–11. doi:10.1088/1742-6596/854/1/012021
-
[27]
Detailed analysis of a waked turbine using a high-resolution scanning lidar
Herges TG, Berg JC, Bryant JT, White JR, Paquette JA, Naug hton BT. Detailed analysis of a waked turbine using a high-resolution scanning lidar. J Phys Conf Ser 2018;1037:0–10. doi:10.1088/1742-6596/1037/7/072009
-
[28]
The aerodynamics of the curled wake: a simplified model in view of flow control
Martínez-Tossas LA, Annoni J , Fleming PA, Churchfield MJ. The aerodynamics of the curled wake: a simplified model in view of flow control. Wind Energy Sci 2019;4:127–38. doi:10.5194/wes-4-127-2019
-
[29]
The upst ream flow of a wind turbine: blockage effect
Medici D, Ivanell S, Dahlberg J-Å, Alfredsson PH. The upst ream flow of a wind turbine: blockage effect. Wind Energy 2011;14:691–7. doi:10.1002/we.451
-
[30]
Okulov VL, van Kuik GAM. The Betz-Joukowsky limit: on the contribution to rotor aerodynamics by the British, German and Russian scientific scho ols. Wind Energy 2012;15:335–44. doi:10.1002/we.464
-
[31]
Sørensen JN. The General Momentum Theory. vol. 4. 2016. do i:10.1007/978-3-319-22114- 4_4
-
[32]
A simplified vortex model of propeller and wind-turbine wakes
Segalini A, Alfredsson PH. A simplified vortex model of propeller and wind-turbine wakes. J Fluid Mech 2013;725:91–116. doi:10.1017/jfm.2013.182
-
[33]
Upwind preview to a horizontal axis wi nd turbine: a wind tunnel and field-scale study
Howard KB, Guala M. Upwind preview to a horizontal axis wi nd turbine: a wind tunnel and field-scale study. Wind Energy 2016;19:1371–89. doi:10.1002/we.1901
-
[34]
Rotor equivalent wind speed for power curve measurement-comparative exercise for IEA Wind Annex 32
Wagner R, Cañadillas B, Clifton A, Feeney S, Nygaard N, Po odt M, et al. Rotor equivalent wind speed for power curve measurement-comparative exercise for IEA Wind Annex 32. J Phys Conf Ser 2014;524. doi:10.1088/1742-6596/524/1/012108
-
[35]
Bastankhah M, Porte-Agel F. Wind tunnel study of the wind turbine interaction with a boundary-layer flow: Upwind region, turbine performance, and wa ke region. Phys Fluids 2017;29. doi:10.1063/1.4984078
-
[36]
Simley E, Angelou N, Mikkelsen T, Sjöholm M, Mann J, Pao L Y. Characterization of wind velocities in the upstream induction zone of a wind turbine using scanning continuous-wave lidars. J Renew Sustain Energy 2016;8. doi:10.1063/1.4940025
-
[37]
Modelling Wind Turbine Inflow: The Indu ction Zone Meyer
Meyer Forsting AR. Modelling Wind Turbine Inflow: The Indu ction Zone Meyer. PhD Thesis,Technical University of Denmark, 2017. doi:10.11581/DTU
-
[38]
Using a cylindrical vortex model to assess the induction zone infront of aligned and yawed rotors
Branlard E, Meyer Forsting AR. Using a cylindrical vortex model to assess the induction zone infront of aligned and yawed rotors. EWEA Offshore 2015 Conf 2015:1–10
work page 2015
-
[39]
A simple model of the wind turbine induction zone derived from numerical simulations
Troldborg N, Meyer Forsting AR. A simple model of the wind turbine induction zone derived from numerical simulations. Wind Energy 2017;20:2011–20. doi:10.1002/we.2137
-
[40]
Meyer Forsting AR, Troldborg N, Murcia Leon JP, Sathe A, A ngelou N, Vignaroli A. Validation of a CFD model with a synchronized triple-lidar syst em in the wind turbine induction zone. Wind Energy 2017;20:1481–98. doi:10.1002/we.2103
-
[41]
Meyer Forsting AR, Bechmann A, Troldborg N. A numerical st udy on the flow upstream of a wind turbine in complex terrain. J Phys Conf Ser 2016;753. doi:10.1088/1742- 6596/753/3/032041
-
[42]
Antoniou I, Pedersen TF. Nacelle Anemometry on a 1MW Wind Turbine: Comparing the power performance results by use of the nacelle or mast anemome ter 1997. Denmark. Forskningscenter Risoe. Risoe-R, No. 941 (EN)
work page 1997
-
[43]
International Electrotech nical Commission. IEC 61400-12-2:2013, Wind turbines - Part 12- 2: Power performance of electricity-producing wind turbines based on nacelle anemometry. 2013
work page 2013
-
[44]
Investigation of the flow in relation to nacelle anemometry
Diznabi B. Investigation of the flow in relation to nacelle anemometry. Master Thesis, Technical University of Denmark, 2009
work page 2009
-
[45]
Martin CM, Lundquist JK, Clifton A, Poulos GS, Schreck SJ
St. Martin CM, Lundquist JK, Clifton A, Poulos GS, Schreck SJ. Atmospheric turbulence affects wind turbine nacelle transfer functions. Wind Energy Sc i Discuss 2016:1–22. doi:10.5194/wes-2016-45
-
[46]
Numerical study of turbulent flow arou nd a wind turbine nacelle
Masson C, Smaïli A. Numerical study of turbulent flow arou nd a wind turbine nacelle. Wind Energy 2006;9:281–98. doi:10.1002/we.171
-
[47]
Char acterization of the unsteady flo w in th e n a c e ll e re g io n o f a modern wind turbine
Zahle F, Sørensen NN. Char acterization of the unsteady flo w in th e n a c e ll e re g io n o f a modern wind turbine. Wind Energy 2011;14:271–83. doi:10.1002/we.418
-
[48]
Keck RE. A numerical investigation of nacelle anemometry f or a HAWT using actuator disc and line models in CFX. Renew Energy 2012;48:72–84. doi:10.1016/j.renene.2012.04.004
-
[49]
Natural snowfall reveals large-scale flow structu res in the wake of a 2.5-MW win d turbine
Hong J, Toloui M, Chamorro LP, Guala M, Howard K, Riley S, et al. Natural snowfall reveals large-scale flow structu res in the wake of a 2.5-MW win d turbine. Nat Commun 2014;5:1–9. doi:10.1038/ncomms5216
-
[50]
Toloui M, Riley S, Hong J, Howard K, Chamorro LP, Guala M, et al. Measurement of atmospheric boundary layer based on super-large-scale particle image velocimetry using natural snowfall. Exp Fluids 2014;55:1–14. doi:10.1007/s00348-014-1737-1
-
[51]
Near-wake behaviour of a ut ility-scale wind turbine
Dasari T, Wu Y, Liu Y, Hong J. Near-wake behaviour of a ut ility-scale wind turbine. J Fluid Mech 2019;859:204–46. doi:10.1017/jfm.2018.779
-
[52]
Heisel M, Dasari T, Liu Y, Hong J, Coletti F, Guala M. The spatial structure of the logarithmic region in very-high-Reynolds-number rough wall turb ulent boundary layers. J Fluid Mech 2018;857:704–47. doi:10.1017/jfm.2018.759
-
[53]
Snowflakes in the atmospheric surface layer: observation of particle–turbulence dynamics
Nemes A, Dasari T, Hong J, Guala M, Coletti F. Snowflakes in the atmospheric surface layer: observation of particle–turbulence dynamics. J Fluid Mec h 2017;814:592–613. doi:10.1017/jfm.2017.13
-
[54]
Precision and shortcomings of yaw error estimation using spinner-based light detection and ranging
Kragh KA, Hansen MH, Mikke lsen T. Precision and shortcomings of yaw error estimation using spinner-based light detection and ranging. Wind Energy 20 13;16:353–66. doi:10.1002/we.1492
-
[55]
UniTTe- Nordtank Measurement Campaign (Turbin e and Met Masts)
Vignaroli A. UniTTe- Nordtank Measurement Campaign (Turbin e and Met Masts). DTU Wind Energy. DTU Wind Energy I, No. 0363 2015
work page 2015
discussion (0)
Sign in with ORCID, Apple, or X to comment. Anyone can read and Pith papers without signing in.