REVIEW 4 major objections 4 minor 91 references
FEAST: JWST/NIRCam view of the Resolved Stellar Populations of the Interacting Dwarf Galaxies NGC~4485/NGC~4490
T0 review · 4 major / 4 minor · reviewed 2026-08-05 · deepseek-v4-flash
Pith's one-line read JWST images of NGC 4485/4490 reveal two recent starbursts, at roughly 30 and 100–200 Myr old, joined by a young-star bridge with a metal gradient, pointing to a close pass that stripped gas from NGC 4485 and fueled NGC 4490.
desk verdict First NIRCam resolved census of Arp 269 with careful data and public products, but the metallicity gradient and burst ages are partly built on the same assumed [Fe/H] inputs. read the letter →
The pith
A machine-rendered reading of the paper's core claim, the machinery that carries it, and where it could break.
The reading
What carries the argument
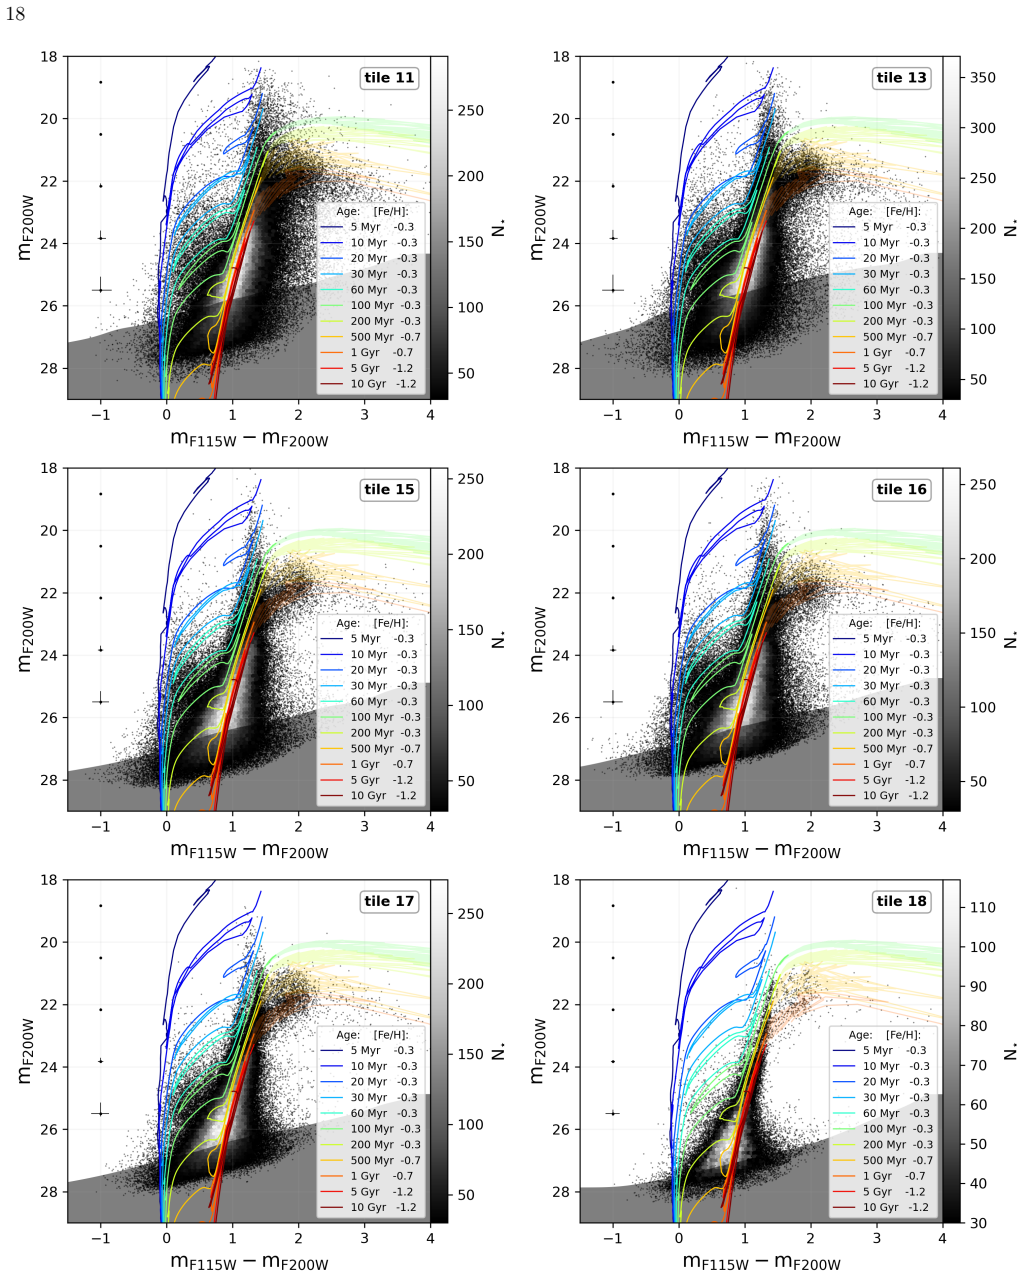
The central objects are the NIRCam color-magnitude diagrams in F115W/F200W, interpreted with PARSEC-COLIBRI stellar isochrones. Three features carry the argument: the red supergiant (RSG) sequence, where a gap marks a lull in star formation followed by a burst about 5–30 Myr ago; the blue core helium-burning (blue loop) overdensity, which dates the older burst to 100–200 Myr; and the median-color shift of RSG sequences, used as a metallicity indicator across the bridge. Spatial maps of age-selected stars trace the bridge, the dust lane, and the spatial coherence of the bursts.
What would settle it
A spatially resolved abundance measurement along the bridge, for example spectroscopy of H II regions or hot blue supergiants in the two bridge tiles, that showed the two young populations have the same oxygen abundance would disprove the metallicity-gradient interpretation; the roughly 0.2 magnitude red supergiant shift would then have to come from grey dust or reddening, and the gas-stripping scenario would lose its resolved-stellar support.
Extended reading notes
Core claim
Using NIRCam F115W and F200W photometry of the Arp 269 pair, the paper resolves individual stars and reads the near-infrared color-magnitude diagrams as a fossil record of the interaction. The CMDs show a burst starting about 30 Myr ago, visible as a gap in the red supergiant sequence followed by a populated bright section, and an earlier, precisely dated burst 100–200 Myr ago, visible as an overdensity of blue core helium-burning stars in NGC 4485. The older burst matches the ~230 Myr ago pericenter passage predicted by N-body simulations. Young stars form a bridge extending from NGC 4485 to NGC 4490, and the median color of the red supergiant sequence shifts by about 0.2 magnitudes between
Load-bearing premise
The load-bearing premise is that the young stellar populations of the two galaxies genuinely differ in metal content rather than in dust, because the paper chooses different metal abundances for the two galaxies to fit the red supergiant colors, then reads the measured color shift as confirming that metal gradient.
Editorial extensions
If this is right
- The ~30 Myr starburst is synchronized across the bridge and part of NGC 4490's northeast disk, implying the interaction triggered star formation on roughly 2 kpc scales at nearly the same time.
- The age-dated 100–200 Myr burst in NGC 4485's core independently supports a recent close passage, tightening the interaction timeline against the N-body prediction of ~230 Myr ago.
- If the metal gradient holds, the gas that fueled the bridge was stripped from the lower-mass, more metal-poor galaxy, meaning dwarf-dwarf encounters can chemically pre-enrich the interstellar medium of a more massive companion.
- Reddened old RGB stars along the bridge trace a continuous gas and dust lane that currently coincides with HI, connecting the galaxies and sustaining the active star-forming regions.
Reading between the lines
- Beyond the paper: a full time-resolved star formation history fit to these CMDs, which the authors say is in preparation, would test whether the two-burst structure survives and would let the recovered burst times be compared directly with the simulated encounter timeline.
- Beyond the paper: if the gas-stripping picture is right, this pair acts as an isolated control experiment for how dwarf-dwarf tides alone strip and mix gas, without a Milky-Way-like primary; the fast HI tail kinematics could be compared with the stellar bridge ages to test the stripping mechanism.
- Beyond the paper: the reddened RGB stars suggest old stellar populations are embedded in the same gas and dust lane as young stars, so deep wide-field imaging outside the current footprint could reveal whether the old halos are truly unperturbed or simply beyond the field of view.
- Beyond the paper: applying the same F115W/F200W CMD analysis to other dwarf pairs in the same observing program would show whether such synchronized post-pericenter bursts are a common outcome of dwarf-dwarf encounters.
Editorial analysis
A structured set of objections, weighed in public.
Referee Report
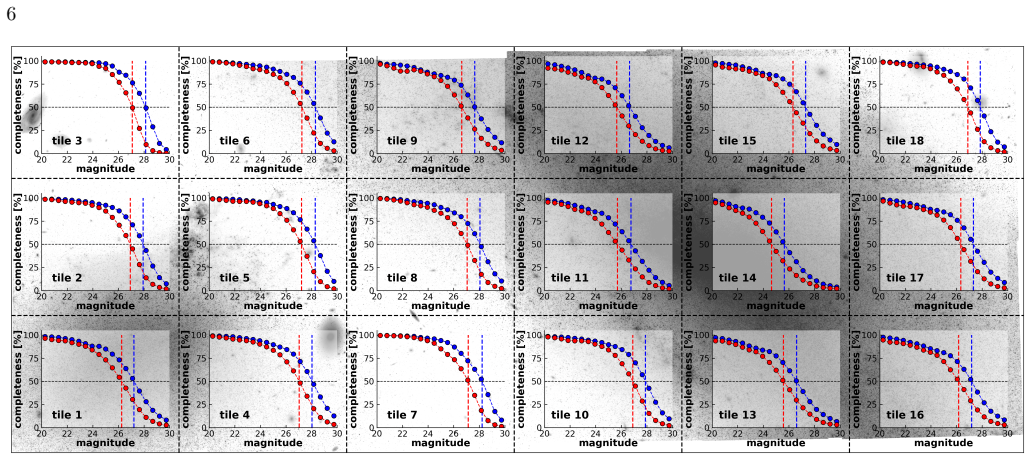
Summary. This paper presents JWST/NIRCam F115W/F200W resolved stellar photometry of the interacting dwarf pair NGC 4485/NGC 4490 (Arp 269). The authors reduce the data with DOLPHOT on 18 tiles, inject 18 million artificial stars to characterize completeness and errors, and compare the resulting CMDs with PARSEC-COLIBRI isochrones. On this basis they report a young bridge connecting the two galaxies, two distinct bursts of star formation at ~30 Myr and ~100–200 Myr, a spatial concentration of 100–200 Myr stars in the center of NGC 4485, and a ~0.2 mag color shift of the red supergiant sequences between tile 5 and tile 9 that they interpret as a factor-of-two metallicity gradient in the young stellar populations. They connect these findings to a scenario in which the last pericenter passage (~200–230 Myr ago) stripped metal-poor gas from NGC 4485, mixed it with NGC 4490's gas, and fueled the current star formation.
Significance. The dataset and photometric analysis are impressive: 18 million artificial stars, per-tile completeness, strict quality cuts, and public catalogs at MAST are notable strengths. If the burst chronology and the metallicity gradient survive quantitative scrutiny, the paper would provide valuable resolved-stellar evidence on how dwarf-dwarf interactions drive starbursts and chemical redistribution, and it would support the Pearson et al. (2018) interaction history with independent data. However, the paper's central physical interpretation currently rests on qualitative CMD feature identification and on metallicity assumptions that were chosen to reproduce the very colors later used to infer the gradient. The system is clearly worth detailed study; the manuscript needs stronger quantitative support before the interaction-scenario claims can be accepted.
major comments (4)
- [§3.2 and §3.3] Section 3.2 adopts [Fe/H] = -0.6 for NGC 4485 and -0.3 for NGC 4490 'to fit the color of the very young stars in the RSG sequences.' Section 3.3 then interprets the ~0.2 mag median color offset between the RSG sequences of tiles 5 and 9 as a 'significant chemical composition gradient' and a factor-of-two metallicity difference. Since the assumed metallicities were chosen to reproduce those exact colors, the gradient is partly an input assumption rather than an independent measurement. Please report the median RSG colors per tile, the model color-metallicity relation at fixed age, and a fit varying metallicity, age, and extinction simultaneously with uncertainties. This is needed because the gas-stripping/mixing scenario rests on this gradient.
- [§3.3, Fig. 7] Internal reddening is dismissed because the upper-MS blue edge does not shift, but the test is qualitative. Differential extinction between the upper-MS and RSG, grey dust, or dust preferentially associated with the young evolved stars could shift the RSG by ~0.2 mag without a detectable upper-MS shift. Figure 11 actually shows reddened RGB stars in the same bridge, so dust is present. Please place the reddening vector on the CMD, compute the E(B-V) needed to explain the offset and the expected upper-MS shift, and test whether the different RSG gaps/mass ranges in tiles 5 and 9 can produce the offset through age/mass differences.
- [§3.2, §4] Section 4 states the RSG gap 'can only be explained' by a 5-30 Myr burst. The gap is visually suggestive, but no synthetic-CMD simulation, completeness-corrected luminosity function, or significance test is shown. Also, the age assignments in Section 3.4 use synthetic CMDs generated with the same assumed [Fe/H] values; a wrong metallicity would shift the derived ages and the claimed 100-200 Myr spatial concentration. Please provide quantitative mock-CMD tests or a full SFH fit to support the burst chronology.
- [§3.3] The cited SITELLE gas-phase metallicity map (Duarte Puertas et al., in prep) is not shown. Since it would be the strongest external validation of the gradient, either include a quantitative comparison or explicitly label the stellar gradient as tentative pending that analysis.
minor comments (4)
- [§2] Typo: 'Nevetheless' in the paragraph on filter choice; also 'galaxys’' should be 'galaxies''.
- [§3.4] The text refers to 'The middle panel of Figure 9' when discussing 200 Myr–1 Gyr C-rich AGB stars; this panel is in Figure 10 (the middle panel of Figure 10).
- [§3.2/Fig. 6] The isochrone legend labels are small and the TPAGB opacity choice makes the C-rich AGB comparison hard to read; consider enlarging annotations or providing an online interactive figure.
- [§2.2/Fig. 3] The completeness curves in Figure 3 are informative but crowded; a table of 50% completeness magnitudes per tile/filter would be useful.
Circularity Check
Metallicity gradient claim is a fitted input: [Fe/H] values were chosen to match the RSG colors, then the same RSG color offset is reported as an independent chemical gradient.
-
fitted input called prediction
[Section 3.2 (Isochrones comparison) and Section 3.3 (Metallicity Gradient), summarized in Section 4]
"To fit the color of the very young stars in the RSG sequences, we assumed two different metallicity values for the two galaxies: [Fe/H] = −0.6 for NGC 4485 (i.e. tile 1 and 5); and [Fe/H] = −0.3 for the rest of the tiles belonging to NGC 4490 ... We observe a clear shift of ∼ 0.2 mag in the median color of the two RSG sequences ... This finding confirms the presence of a significant chemical composition gradient among the young stellar populations of the bridge between the two dwarf galaxies."
The two adopted metallicities differ by 0.3 dex (a factor of about two) and were explicitly chosen to reproduce the RSG colors of the two galaxies. The subsequent claim that the observed 0.2 mag RSG color offset between tile 5 and tile 9 is a 'significant chemical composition gradient' and a 'factor of two difference in the metal content' therefore restates the input [Fe/H] difference rather than measuring it independently. The color offset is an observed quantity, but its conversion into a metallicity gradient is the same assumption used in the isochrone fit. The non-shift of the upper-MS excludes uniform foreground reddening only; it does not test whether an age/mass-distribution difference or non-uniform extinction could produce the RSG offset, and no quantitative model with a single me
full rationale
Most of the paper's results are based on measured CMD features and are self-contained or externally supported: the age-dated bursts rely on isochrone morphology (e.g., the RSG gap), the bridge/spatial distributions come from star counts, and the comparison with Pearson et al. (2018) uses an independent N-body simulation. However, the abstract and summary's 'significant metallicity gradient' is not an independent measurement. Section 3.2 states that [Fe/H] = -0.6 and -0.3 were assumed 'to fit the color of the very young stars in the RSG sequences,' and Section 3.3 then presents the observed RSG color shift of ~0.2 mag as confirmation of a chemical gradient. The quoted 'factor of two difference in metal content' is simply the difference between the two assumed metallicities. This is a fitted-input-called-observation circularity for that specific claim. The qualitative upper-MS reddening test is useful but does not break the degeneracy between metallicity, age distribution, and non-uniform dust. Other self-citations (e.g., Correnti et al. 2025b for photometric cuts, Adamo et al. in prep for the survey) are not load-bearing for the main claims. The Duarte Puertas et al. (in prep) gas-phase result is cited as supporting but is not shown and includes a co-author; nonetheless, the central metallicity-gradient claim already reduces to the input assumption. Therefore the score is 6: one headline result is partially circular, while the rest of the analysis retains independent content.
Assumptions & free parameters
free parameters (2)
- [Fe/H] of young populations, NGC 4485 =
-0.6
- [Fe/H] of young populations, NGC 4490 =
-0.3
assumptions (5)
- domain assumption Distance modulus (m-M)0 = 29.70 and E(B-V) = 0.15 are adopted from Calzetti et al. 2015 / Sabbi et al. 2018
- domain assumption PARSEC-COLIBRI stellar models correctly predict NIR magnitudes and colors, including the RSG luminosity-age anti-correlation and TPAGB colors
- domain assumption The RSG sequence gap in tiles 5, 9, and 10 is a true deficit of intermediate-age stars, not photometric incompleteness or dust extinction
- domain assumption The Pearson et al. (2018) N-body pericenter timing of about 230 Myr ago is correct
- domain assumption Kroupa IMF and constant SFR over the last 800 Myr for the synthetic CMDs used in age assignment
Cite this review
Pith. "Pith review of FEAST: JWST/NIRCam view of the Resolved Stellar Populations of the Interacting Dwarf Galaxies NGC~4485/NGC~4490." pith.science (2026). https://pith.science/paper/NIKHMFEG
@misc{pith2026250901740,
  author       = {Pith},
  title        = {Pith review of: FEAST: JWST/NIRCam view of the Resolved Stellar Populations of the Interacting Dwarf Galaxies NGC~4485/NGC~4490},
  year         = {2026},
  howpublished = {\url{https://pith.science/paper/NIKHMFEG}},
  note         = {Machine review of arXiv:2509.01740}
}
abstract
We present new JWST/NIRCam observations of the interacting dwarf galaxy system NGC 4485/NGC 4490 (a.k.a. Arp 269), obtained as part of the Cycle 1 Feedback in Emerging extrAgalactic Star clusTers (FEAST) program. NGC 4485 and NGC 4490 form the closest known pair of interacting late-type dwarf galaxies (at $\sim 7.4$ Mpc), excluding the Magellanic Clouds. Near-infrared color-magnitude diagrams (CMDs) reveal a wide range of stellar populations in both galaxies, including young ($\lesssim 200$ Myr) upper main sequence stars, core helium-burning stars, and oxygen-rich asymptotic giant branch (AGB) stars. We also identify intermediate-age ($\sim 200$ Myr -- $1$ Gyr) carbon-rich AGB stars and a well-populated old ($\gtrsim 1$ Gyr) red giant branch (RGB). The CMDs show two distinct bursts of star formation beginning $\sim 30$ Myr and $\sim 200$ Myr ago, the latter consistent with the most recent pericenter passage predicted by N-body simulations. The spatial distribution of stars reveals a tidal bridge extending from NGC 4485 and connecting to the disk of NGC 4490. Compact star-forming regions are seen along NGC 4490's spiral arms, possibly originating from its infrared nucleus. A significant metallicity gradient is observed in the young stellar populations forming the bridge. These findings suggest that during the last pericenter passage, gas was stripped from NGC 4485 via tidal forces or ram pressure, accreted by NGC 4490, and mixed with in-situ material, fueling ongoing star formation. This system provides a unique nearby laboratory for studying how tidal interactions shape the star formation and chemical enrichment history of dwarf galaxies.
Figures


Figures from the paper (10 more)


Reference graph
Works this paper leans on
-
[1]
2022, Nature Astronomy, 6, 48, doi: 10.1038/s41550-021-01575-x
Annibali, F., & Tosi, M. 2022, Nature Astronomy, 6, 48, doi: 10.1038/s41550-021-01575-x
-
[2]
2016, ApJL, 826, L27, doi: 10.3847/2041-8205/826/2/L27
Annibali, F., Nipoti, C., Ciotti, L., et al. 2016, ApJL, 826, L27, doi: 10.3847/2041-8205/826/2/L27
-
[3]
2020, MNRAS, 491, 5101, doi: 10.1093/mnras/stz3185
Annibali, F., Beccari, G., Bellazzini, M., et al. 2020, MNRAS, 491, 5101, doi: 10.1093/mnras/stz3185
-
[4]
Annibali, F., Pinna, E., Hunt, L. K., et al. 2023, ApJL, 942, L23, doi: 10.3847/2041-8213/acab63 Astropy Collaboration, Robitaille, T. P., Tollerud, E. J., et al. 2013, A&A, 558, A33, doi: 10.1051/0004-6361/201322068 Astropy Collaboration, Price-Whelan, A. M., Sip˝ ocz, B. M., et al. 2018, AJ, 156, 123, doi: 10.3847/1538-3881/aabc4f Astropy Collaboration,...
-
[5]
2005, MNRAS, 356, 680, doi: 10.1111/j.1365-2966.2004.08510.x
Bekki, K., & Chiba, M. 2005, MNRAS, 356, 680, doi: 10.1111/j.1365-2966.2004.08510.x
arXiv 2005
-
[6]
2004, A&A, 424, 199, doi: 10.1051/0004-6361:20035910
Origlia, L. 2004, A&A, 424, 199, doi: 10.1051/0004-6361:20035910
-
[7]
2024, A&A, 691, A42, doi: 10.1051/0004-6361/202449575
Bellazzini, M., & Pascale, R. 2024, A&A, 691, A42, doi: 10.1051/0004-6361/202449575
-
[8]
Belokurov, V., Erkal, D., Deason, A. J., et al. 2017, MNRAS, 466, 4711, doi: 10.1093/mnras/stw3357
Show all 91 references
-
[9]
Deason, A. J. 2018, MNRAS, 478, 611, doi: 10.1093/mnras/sty982
2018 doi
-
[10]
B., Evans, N
Belokurov, V., Zucker, D. B., Evans, N. W., et al. 2006, ApJL, 642, L137, doi: 10.1086/504797
2006 doi
-
[11]
2010, ApJL, 721, L97, doi: 10.1088/2041-8205/721/2/L97
Besla, G., Kallivayalil, N., Hernquist, L., et al. 2010, ApJL, 721, L97, doi: 10.1088/2041-8205/721/2/L97
2010 doi
-
[12]
2024a, MNRAS, 527, 5339, doi: 10.1093/mnras/stad3524
Bortolini, G., Cignoni, M., Sacchi, E., et al. 2024a, MNRAS, 527, 5339, doi: 10.1093/mnras/stad3524
-
[13]
2024b, A&A, 689, A146, doi: 10.1051/0004-6361/202450632
Bortolini, G., ¨Ostlin, G., Habel, N., et al. 2024b, A&A, 689, A146, doi: 10.1051/0004-6361/202450632
-
[14]
2012, MNRAS, 427, 127, doi: 10.1111/j.1365-2966.2012.21948.x
Bressan, A., Marigo, P., Girardi, L., et al. 2012, MNRAS, 427, 127, doi: 10.1111/j.1365-2966.2012.21948.x
2012
-
[15]
C., Sabbi, E., et al
Calzetti, D., Lee, J. C., Sabbi, E., et al. 2015, AJ, 149, 51, doi: 10.1088/0004-6256/149/2/51
2015 doi
-
[16]
L., Sand, D
Carlin, J. L., Sand, D. J., Price, P., et al. 2016, ApJL, 828, L5, doi: 10.3847/2041-8205/828/1/L5
2016 doi
- [17]
-
[18]
P., et al
Cignoni, M., Sabbi, E., van der Marel, R. P., et al. 2016, ApJ, 833, 154, doi: 10.3847/1538-4357/833/2/154
2016 doi
-
[20]
P., Cole, S., Frenk, C
Cooper, A. P., Cole, S., Frenk, C. S., et al. 2010, MNRAS, 406, 744, doi: 10.1111/j.1365-2966.2010.16740.x
2010
-
[21]
2025a, arXiv e-prints, arXiv:2502.18171
Correnti, M., Annibali, F., Bellazzini, M., et al. 2025a, arXiv e-prints, arXiv:2502.18171. https://arxiv.org/abs/2502.18171
-
[22]
2025b, arXiv e-prints, arXiv:2507.03420, doi: 10.48550/arXiv.2507.03420 Crnojevi´ c, D., Sand, D
Correnti, M., Bortolini, G., Dell’Agli, F., et al. 2025b, arXiv e-prints, arXiv:2507.03420, doi: 10.48550/arXiv.2507.03420 Crnojevi´ c, D., Sand, D. J., Spekkens, K., et al. 2016, ApJ, 823, 19, doi: 10.3847/0004-637X/823/1/19
-
[23]
2008, Nature, 454, 735, doi: 10.1038/nature07153
Diemand, J., Kuhlen, M., Madau, P., et al. 2008, Nature, 454, 735, doi: 10.1038/nature07153
2008 doi
-
[24]
C., Skillman, E
Dohm-Palmer, R. C., Skillman, E. D., Saha, A., et al. 1997, AJ, 114, 2527, doi: 10.1086/118665
1997 doi
-
[25]
2016, DOLPHOT: Stellar photometry, Astrophysics Source Code Library, record ascl:1608.013
Dolphin, A. 2016, DOLPHOT: Stellar photometry, Astrophysics Source Code Library, record ascl:1608.013. http://ascl.net/1608.013 20
2016
-
[26]
Dolphin, A. E. 2000, PASP, 112, 1383, doi: 10.1086/316630
2000 doi
-
[27]
2019, MNRAS, 485, 3930, doi: 10.1093/mnras/stz627
Drissen, L., Martin, T., Rousseau-Nepton, L., et al. 2019, MNRAS, 485, 3930, doi: 10.1093/mnras/stz627
2019 doi
-
[28]
Elmegreen, B. G. 1998, in Astronomical Society of the Pacific Conference Series, Vol. 148, Origins, ed. C. E
1998
- [29]
-
[30]
Wittenmyer, R. A. 1998, AJ, 115, 1433, doi: 10.1086/300301
1998 doi
-
[31]
S., White, S
Frenk, C. S., White, S. D. M., Davis, M., & Efstathiou, G. 1988, ApJ, 327, 507, doi: 10.1086/166213 Gaia Collaboration, Vallenari, A., Brown, A. G. A., et al. 2023, A&A, 674, A1, doi: 10.1051/0004-6361/202243940
1988 doi
-
[32]
T., & Noguchi, M
Gardiner, L. T., & Noguchi, M. 1996, MNRAS, 278, 191, doi: 10.1093/mnras/278.1.191
1996 doi
-
[33]
C., & Rosales-Ortega, F
Garner, R., Mihos, J. C., & Rosales-Ortega, F. F. 2025, ApJ, 982, 143, doi: 10.3847/1538-4357/adbbd0
2025 doi
-
[34]
F., & Bland-Hawthorn, J
Guglielmo, M., Lewis, G. F., & Bland-Hawthorn, J. 2014, MNRAS, 444, 1759, doi: 10.1093/mnras/stu1549
2014 doi
-
[35]
2024, ApJ, 971, 108, doi: 10.3847/1538-4357/ad5343
Habel, N., Nally, C., Lenki´ c, L., et al. 2024, ApJ, 971, 108, doi: 10.3847/1538-4357/ad5343
2024 doi
-
[36]
2009, AJ, 137, 4643, doi: 10.1088/0004-6256/137/6/4643
Hurlock, S. 2009, AJ, 137, 4643, doi: 10.1088/0004-6256/137/6/4643
2009 doi
-
[37]
R., Millman, K
Harris, C. R., Millman, K. J., van der Walt, S. J., et al. 2020, Nature, 585, 357–362, doi: 10.1038/s41586-020-2649-2
2020 doi
-
[38]
Helmi, A., & White, S. D. M. 1999, MNRAS, 307, 495, doi: 10.1046/j.1365-8711.1999.02616.x
1999
-
[39]
R., McConnachie, A
Higgs, C. R., McConnachie, A. W., Irwin, M., et al. 2016, MNRAS, 458, 1678, doi: 10.1093/mnras/stw257
2016 doi
-
[40]
Hunter, J. D. 2007, Computing in science & engineering, 9, 90
2007
-
[41]
2001, Nature, 412, 49, doi: 10.1038/35083506
Tanvir, N. 2001, Nature, 412, 49, doi: 10.1038/35083506
2001 doi
-
[42]
Suntzeff, N. B. 1997, AJ, 113, 634, doi: 10.1086/118283
1997 doi
-
[43]
I., & Thuan, T
Izotov, Y. I., & Thuan, T. X. 2009, ApJ, 690, 1797, doi: 10.1088/0004-637X/690/2/1797
2009 doi
-
[44]
A., & Mandel, E
Joye, W. A., & Mandel, E. 2003, in Astronomical data analysis software and systems XII, Vol. 295, 489
2003
-
[45]
V., Zivick, P., et al
Kallivayalil, N., Sales, L. V., Zivick, P., et al. 2018, ApJ, 867, 19, doi: 10.3847/1538-4357/aadfee
2018 doi
-
[46]
D., Kaisina, E
Karachentsev, I. D., Kaisina, E. I., & Makarov, D. I. 2018, MNRAS, 479, 4136, doi: 10.1093/mnras/sty1774
2018 doi
-
[47]
D., & Kroupa, P
Karachentsev, I. D., & Kroupa, P. 2024, MNRAS, 528, 2805, doi: 10.1093/mnras/stae184
2024 doi
-
[48]
V., Gnedin, O
Kravtsov, A. V., Gnedin, O. Y., & Klypin, A. A. 2004, ApJ, 609, 482, doi: 10.1086/421322
2004 doi
-
[49]
2001, MNRAS, 322, 231, doi: 10.1046/j.1365-8711.2001.04022.x
Kroupa, P. 2001, MNRAS, 322, 231, doi: 10.1046/j.1365-8711.2001.04022.x
2001
-
[50]
R., Struck, C., & Smith, B
Lawrence, A., Kerton, C. R., Struck, C., & Smith, B. J. 2020, ApJ, 891, 11, doi: 10.3847/1538-4357/ab6c6a
2020 doi
-
[51]
G., Freedman, W
Lee, M. G., Freedman, W. L., & Madore, B. F. 1993, ApJ, 417, 553, doi: 10.1086/173334
1993 doi
-
[52]
2023, MNRAS, 523, 3905, doi: 10.1093/mnras/stad1281
Liu, Y., Zhu, M., Yu, H., et al. 2023, MNRAS, 523, 3905, doi: 10.1093/mnras/stad1281
2023 doi
-
[53]
2001, A&A, 373, 555, doi: 10.1051/0004-6361:20010596
Maeder, A., & Meynet, G. 2001, A&A, 373, 555, doi: 10.1051/0004-6361:20010596
2001 doi
-
[54]
2006, AJ, 132, 2729, doi: 10.1086/508925
Makarov, D., Makarova, L., Rizzi, L., et al. 2006, AJ, 132, 2729, doi: 10.1086/508925
2006 doi
-
[55]
Mandal, S., & Kerton, C. R. 2024, MNRAS, 529, 953, doi: 10.1093/mnras/stae500
2024 doi
-
[56]
2017, ApJ, 835, 77, doi: 10.3847/1538-4357/835/1/77 Mart ´ ınez-Delgado, D., Gabany, R
Marigo, P., Girardi, L., Bressan, A., et al. 2017, ApJ, 835, 77, doi: 10.3847/1538-4357/835/1/77 Mart ´ ınez-Delgado, D., Gabany, R. J., Crawford, K., et al. 2010, AJ, 140, 962, doi: 10.1088/0004-6256/140/4/962
2017 doi
-
[57]
2006, MNRAS, 369, 1021, doi: 10.1111/j.1365-2966.2006.10403.x
Moore, B. 2006, MNRAS, 369, 1021, doi: 10.1111/j.1365-2966.2006.10403.x
2006
-
[58]
W., Irwin, M
McConnachie, A. W., Irwin, M. J., Ibata, R. A., et al. 2009, Nature, 461, 66, doi: 10.1038/nature08327
2009 doi
-
[59]
McQuinn, K. B. W., B. Newman, M. J., Savino, A., et al. 2024, ApJ, 961, 16, doi: 10.3847/1538-4357/ad1105
2024 doi
-
[60]
C., Lenki´ c, L., et al
Nally, C., Jones, O. C., Lenki´ c, L., et al. 2024, MNRAS, 531, 183, doi: 10.1093/mnras/stae1163
2024 doi
-
[61]
2013, MNRAS, 434, 2390, doi: 10.1093/mnras/stt1175
Nanni, A., Bressan, A., Marigo, P., & Girardi, L. 2013, MNRAS, 434, 2390, doi: 10.1093/mnras/stt1175
2013 doi
-
[62]
A., D’Onghia, E., & Fox, A
Pardy, S. A., D’Onghia, E., & Fox, A. J. 2018, ApJ, 857, 101, doi: 10.3847/1538-4357/aab95b
2018 doi
-
[63]
A., D’Onghia, E., Navarro, J
Pardy, S. A., D’Onghia, E., Navarro, J. F., et al. 2020, MNRAS, 492, 1543, doi: 10.1093/mnras/stz3192
2020 doi
-
[64]
2024, A&A, 688, A144, doi: 10.1051/0004-6361/202348991
Pascale, R., Annibali, F., Tosi, M., et al. 2024, A&A, 688, A144, doi: 10.1051/0004-6361/202348991
2024 doi
-
[65]
2020, MNRAS, 498, 3283, doi: 10.1093/mnras/staa2565
Pastorelli, G., Marigo, P., Girardi, L., et al. 2020, MNRAS, 498, 3283, doi: 10.1093/mnras/staa2565
2020 doi
-
[66]
2020, ApJ, 893, 121, doi: 10.3847/1538-4357/ab7b75
Patel, E., Kallivayalil, N., Garavito-Camargo, N., et al. 2020, ApJ, 893, 121, doi: 10.3847/1538-4357/ab7b75
2020 doi
-
[67]
C., Besla, G., et al
Pearson, S., Privon, G. C., Besla, G., et al. 2018, MNRAS, 480, 3069, doi: 10.1093/mnras/sty2052
2018 doi
-
[68]
Peebles, P. J. E. 1982, ApJL, 263, L1, doi: 10.1086/183911
1982 doi
- [69]
-
[70]
H., Wright, G
Rieke, G. H., Wright, G. S., B¨ oker, T., et al. 2015, PASP, 127, 584, doi: 10.1086/682252
2015 doi
-
[71]
J., Kelly, D
Rieke, M. J., Kelly, D. M., Misselt, K., et al. 2023, PASP, 135, 028001, doi: 10.1088/1538-3873/acac53
2023 doi
-
[72]
P., Robert, C., et al
Rousseau-Nepton, L., Martin, R. P., Robert, C., et al. 2019, MNRAS, 489, 5530, doi: 10.1093/mnras/stz2455 21
2019 doi
-
[73]
2018, ApJS, 235, 23, doi: 10.3847/1538-4365/aaa8e5
Sabbi, E., Calzetti, D., Ubeda, L., et al. 2018, ApJS, 235, 23, doi: 10.3847/1538-4365/aaa8e5
2018 doi
-
[74]
2016, ApJ, 830, 3, doi: 10.3847/0004-637X/830/1/3
Sacchi, E., Annibali, F., Cignoni, M., et al. 2016, ApJ, 830, 3, doi: 10.3847/0004-637X/830/1/3
2016 doi
-
[75]
2024, A&A, 691, A65, doi: 10.1051/0004-6361/202450106
Sacchi, E., Bellazzini, M., Annibali, F., et al. 2024, A&A, 691, A65, doi: 10.1051/0004-6361/202450106
2024 doi
-
[76]
1998, MNRAS, 298, 166, doi: 10.1046/j.1365-8711.1998.01598.x
Salaris, M., & Cassisi, S. 1998, MNRAS, 298, 166, doi: 10.1046/j.1365-8711.1998.01598.x
1998
- [77]
-
[78]
J., Giroux, M
Smith, B. J., Giroux, M. L., Struck, C., & Hancock, M. 2010, AJ, 139, 1212, doi: 10.1088/0004-6256/139/3/1212
2010 doi
-
[79]
Taylor, M. B. 2005, in Astronomical Society of the Pacific Conference Series, Vol. 347, Astronomical Data Analysis Software and Systems XIV, ed. P. Shopbell, M. Britton, & R. Ebert, 29
2005
-
[80]
A., Hunter, D
Thronson, Jr., H. A., Hunter, D. A., Casey, S., Latter, W. B., & Harper, D. A. 1989, ApJ, 339, 803, doi: 10.1086/167337
1989 doi
-
[81]
A., Galazutdinova, O
Tikhonov, N. A., Galazutdinova, O. A., & Lebedev, V. S. 2014, Astronomy Letters, 40, 1, doi: 10.1134/S1063773714010058
2014 doi
-
[82]
2009, ARA&A, 47, 371, doi: 10.1146/annurev-astro-082708-101650
Tolstoy, E., Hill, V., & Tosi, M. 2009, ARA&A, 47, 371, doi: 10.1146/annurev-astro-082708-101650
2009 doi
-
[83]
2018, PhR, 730, 1, doi: 10.1016/j.physrep.2017.11.004
Tulin, S., & Yu, H.-B. 2018, PhR, 730, 1, doi: 10.1016/j.physrep.2017.11.004
2018 doi
-
[84]
2014, MNRAS, 439, 977, doi: 10.1093/mnras/stu028
Ventura, P., Dell’Agli, F., Schneider, R., et al. 2014, MNRAS, 439, 977, doi: 10.1093/mnras/stu028
2014 doi
-
[85]
A., & Guzman-Ramirez, L
Ventura, P., Karakas, A., Dell’Agli, F., Garc ´ ıa-Hern´ andez, D. A., & Guzman-Ramirez, L. 2018, MNRAS, 475, 2282, doi: 10.1093/mnras/stx3338
2018 doi
-
[86]
E., et al
Virtanen, P., Gommers, R., Oliphant, T. E., et al. 2020, Nature Methods, 17, 261, doi: 10.1038/s41592-019-0686-2
2020 doi
-
[87]
R., McQuinn, K
Weisz, D. R., McQuinn, K. B. W., Savino, A., et al. 2023, ApJS, 268, 15, doi: 10.3847/1538-4365/acdcfd
2023 doi
-
[88]
R., Dolphin, A
Weisz, D. R., Dolphin, A. E., Savino, A., et al. 2024, ApJS, 271, 47, doi: 10.3847/1538-4365/ad2600 Wes McKinney. 2010, in Proceedings of the 9th Python in Science Conference, ed. St´ efan van der Walt & Jarrod Millman, 56 – 61, doi: 10.25080/Majora-92bf1922-00a
2024 doi
-
[89]
S., et al
Wheeler, C., O˜ norbe, J., Bullock, J. S., et al. 2015, MNRAS, 453, 1305, doi: 10.1093/mnras/stv1691
2015 doi
-
[90]
White, S. D. M., & Frenk, C. S. 1991, ApJ, 379, 52, doi: 10.1086/170483
1991 doi
-
[91]
White, S. D. M., & Rees, M. J. 1978, MNRAS, 183, 341, doi: 10.1093/mnras/183.3.341
1978 doi
-
[92]
2024, ApJ, 965, 3, doi: 10.3847/1538-4357/ad2f2d
Zhang, L.-Y., Zhao, Y., & Zhang, H.-X. 2024, ApJ, 965, 3, doi: 10.3847/1538-4357/ad2f2d
2024 doi
Reviewed August 5, 2026 · model on record in the stance chip above.
Discussion (0). Sign in to comment.