REVIEW 4 major objections 4 minor 1 cited by
Revealing Hidden Substructures in the $M_{BH}$-$\sigma$ Diagram, and Refining the Bend in the $L$-$\sigma$ Relation
T0 review · 4 major / 4 minor · reviewed 2026-08-14 · deepseek-v4-flash
Pith's one-line read Black hole mass and galaxy velocity dispersion do not follow one universal relation; Sersic and core-Sersic galaxies define separate laws with slopes 5.75 and 8.64.
desk verdict Careful, transparent re-analysis of MBH-sigma; the Sersic/core-Sersic split is plausible but needs a formal model comparison before it becomes definitive. read the letter →
The pith
A machine-rendered reading of the paper's core claim, the machinery that carries it, and where it could break.
The reading
What carries the argument
The load-bearing object is the classification of a galaxy as Sersic versus core-Sersic based on multi-component decomposition of its surface-brightness profile. A core-Sersic galaxy has a central deficit of starlight relative to the inward extrapolation of its outer Sersic profile, a signature left by binary black holes carving out stars during major dry mergers. That structural label, not galaxy type alone, is what separates the two $M_{\rm BH}$-$\sigma$ tracks, and it also produces the analogous bend in the $L$-$\sigma$ diagram. The regressions use symmetric bisector fitting, which does not assume a causal direction between black hole mass and velocity dispersion.
What would settle it
Recompute the bisector regressions with all 143 galaxies that have velocity dispersions, comparing a single bent relation against two separate lines with an information criterion or a likelihood-ratio test; if the bend-only model fits as well as two lines, the claimed dichotomy is not needed. A direct observational check is to measure black hole masses in a magnitude-limited sample of galaxies with $M_{\rm BH}\lesssim10^6\,M_\odot$ and $\sigma\lesssim100$ km s$^{-1}$: if those points connect smoothly to the Sersic line with no separate track, the exclusion-based split fails.
Extended reading notes
Core claim
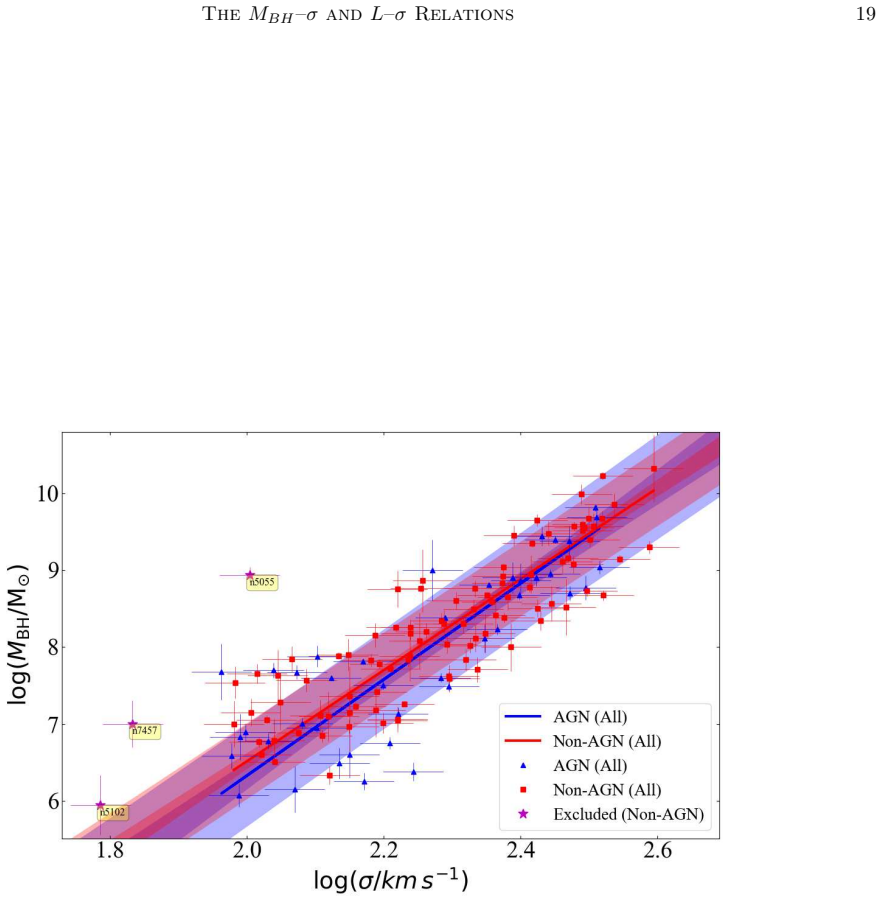
The discovery is that the $M_{\rm BH}$-$\sigma$ diagram contains hidden substructure: galaxies whose bulges have a partially depleted stellar core follow a steeper relation, $M_{\rm BH}\propto\sigma^{8.64\pm1.10}$, than galaxies with ordinary Sersic light profiles, $M_{\rm BH}\propto\sigma^{5.75\pm0.34}$, with the slopes differing by roughly $2.5\sigma$. The two lines cross near $\sigma\approx255$ km s$^{-1}$, meaning that at high velocity dispersions the core-Sersic population has systematically larger black hole masses than the Sersic relation would predict. The same structural divide produces a bend in the galaxy luminosity-velocity dispersion ($L$-$\sigma$) relation in both the V band and the 3.6 $\mu$m band, and the combined $M_{\rm BH}$-$L$-$\sigma$ relations are internally consistent. The paper further finds that barred and non-barred galaxies show no offset once bar classifications are updated, and that active galactic nuclei do not shift the relations.
Load-bearing premise
The two-line result depends on excluding eight galaxies, including the only four with $M_{\rm BH}\lesssim10^6\,M_\odot$; if those are a continuous low-mass population with a bend rather than outliers, the quoted Sersic slope and the dichotomy are artifacts.
Editorial extensions
If this is right
- The single $M_{\rm BH}\propto\sigma^{6.10}$ relation is a blend; at $\sigma\gtrsim255$ km s$^{-1}$ the core-Sersic line gives noticeably larger black hole masses than the Sersic line.
- Galaxy-black hole co-evolution models should reproduce two channels: gas-rich growth for Sersic galaxies and dry-merger growth for core-Sersic galaxies, with dry mergers adding black hole mass without a commensurate rise in $\sigma$.
- Black hole mass estimates for other galaxies become more accurate when the host is classified by light-profile shape, and virial $f$-factor calibrations for reverberation-mapped active galaxies may need to depend on core type.
- The bend in the $L$-$\sigma$ relation and the break in the $M_{\rm BH}$-$\sigma$ relation share a common structural origin, so the two scaling relations can be used together to check one another.
- Corrected bar classifications remove the previously reported barred-galaxy offset, so bars should not be treated as a separate population in $M_{\rm BH}$-$\sigma$ work.
Reading between the lines
- Editorial inference: if the dichotomy is real, black hole mass functions built from $\sigma$ surveys will be biased unless the core-Sersic fraction is accounted for, because the steep core-Sersic track assigns higher masses at fixed $\sigma$.
- Editorial inference: an untested corollary is that residuals of core-Sersic galaxies above the Sersic relation should correlate with the measured size of their depleted cores, tying the slope difference directly to the number of dry mergers.
- Editorial inference: the claimed absence of a bar offset would gain strength if tested with a larger sample of strongly barred early-type galaxies and with bars decomposed in the near-infrared rather than inherited from older catalogs.
Signed reviews
Editorial analysis
A structured set of objections, weighed in public.
Referee Report
Summary. The paper analyzes 145 galaxies with directly measured black hole masses and central velocity dispersions, using multi-component light-profile decompositions to classify hosts as Sersic or core-Sersic, with or without a disk, barred or unbarred, and with or without an AGN. The central claim is that Sersic and core-Sersic galaxies define two distinct MBH-sigma relations, MBH proportional to sigma^(5.75 +/- 0.34) for 102 Sersic galaxies and MBH proportional to sigma^(8.64 +/- 1.10) for 35 core-Sersic galaxies (Equations 5 and 6, with slopes inconsistent at roughly the 2.5-sigma level). The paper also reports that the L-sigma relation is bent because Sersic and core-Sersic galaxies follow different L-sigma relations, that barred/non-barred and AGN/non-AGN divisions do not produce offsets, and that the previously reported bar offset is partly due to misclassification. The authors argue the resulting morphology-dependent relations improve MBH estimation and bear on galaxy-black hole co-evolution.
Significance. If the central claim holds, the MBH-sigma relation is not a single universal power law but a superposition of two relations linked to galaxy assembly history, which would be an important result for black hole scaling relations and feedback models. The paper's empirical strengths include the large compiled sample, the use of updated homogeneous velocity dispersions, the presentation of BCES regressions in all three minimization directions, and the transparent appendix tables showing the effect of excluded galaxies. The secondary L-sigma analysis is also valuable as a consistency check. However, the distinct-relations claim is not yet statistically decisive: no model-selection test is reported, and the inferred slope difference depends on the regression direction chosen. The internal consistency checks in Section 4 are partly self-referential because they combine scaling relations fit to largely the same overlapping sample. The significance is therefore conditional on additional statistical testing.
major comments (4)
- [Section 3.3 and Table 3] The claim that Sersic and core-Sersic galaxies follow two distinct MBH-sigma relations rests on a slope difference of about 2.5 sigma using the preferred BCES(Bisector) slopes (5.75 +/- 0.34 vs 8.64 +/- 1.10), but Table 3 shows that the BCES(sigma|MBH) slopes, 7.02 +/- 0.52 vs 9.77 +/- 1.70, differ by only about 1.5 sigma. The paper reports no formal model-selection test, such as a permutation test, bootstrap test, BIC/AIC comparison, or an F-test, that would show a two-line model is preferred over a single relation. Because the two-line interpretation was selected after examining several partitions (core, disk, bar, AGN), the look-elsewhere effect should also be addressed. Please add a decisive statistical comparison of the single-line versus two-line model for the Sersic/core-Sersic split.
- [Section 3.1 and Appendix Table 4] The exclusion of eight galaxies, including all four galaxies with MBH below about 10^6 solar masses, is presented as necessary to obtain 'more stable relations,' but the selection is made after inspecting the same data. Appendix Table 4 shows that including the six excluded galaxies with reliable sigma measurements changes the Sersic bisector slope from 5.75 +/- 0.34 to 4.83 +/- 0.35 while the core-Sersic slope remains 8.50 +/- 1.10, so the low-mass exclusions do not erase the dichotomy; however, they do change the single all-galaxy slope from 6.10 +/- 0.28 to 5.29 +/- 0.32. The paper should provide an objective, pre-specified exclusion criterion, and should present the two-line comparison both with and without all excluded galaxies, including a discussion of whether a continuous bent relation is an alternative description.
- [Section 4] The internal consistency checks between MBH-sigma, MBH-M*_sph, and M*_sph-sigma relations are partly circular: the MBH-M*_sph relations from Sahu et al. (2019) and the MBH-sigma relations derived here are fit to samples that overlap by roughly 85%, and the predicted M*_sph-sigma relations are then compared to direct BCES fits to the same galaxies. This does not constitute an independent validation. The authors should state this limitation explicitly and, if possible, test consistency on a subsample not used to derive either relation.
- [Section 5.1 and 5.2] The claim of a bend in the L-sigma relation also lacks a formal statistical comparison between a single power law and a broken relation. The V-band slopes 2.44 +/- 0.18 and 4.86 +/- 0.54 and the 3.6 micron slopes 2.97 +/- 0.43 and 5.16 +/- 0.53 are presented after reclassifying several galaxies and excluding NGC 4482 and NGC 4291 as outliers; the bend-point is quoted without an uncertainty or a fitted break model. Please provide a model-selection test for the bend and quantify the sensitivity of the bend-point and slopes to the excluded and reclassified galaxies.
minor comments (4)
- [Table 2 note] The table note contains a typo: 'Intercept of the line line obtained from the BCES(Bisector) regression' should read 'Intercept of the line obtained from the BCES(Bisector) regression.'
- [Section 3.5.1] The comparison with Graham & Scott (2013) uses updated black hole masses, velocity dispersions, and bar classifications simultaneously; the authors state that the updated velocity dispersions alone do not drive the change, but it would be helpful to state explicitly which galaxies have updated MBH values and whether the reduced offset persists when using the old MBH values with the new bar classifications.
- [Section 5.1] The sentence 'Using elliptical galaxies from the V-band data-set of Lauer et al. (2007), with several modifications, Kormendy & Bender (2013) reported...' is grammatically awkward and should be rewritten for clarity.
- [Section 3.3] The sentence 'Sersic and core-Sersic categorization reveals two different relations followed by the two sub-populations' is slightly repetitive; consider 'The Sersic/core-Sersic categorization reveals two different relations.'
Circularity Check
No significant circularity: the two MBH-sigma relations are direct BCES fits to measured black hole masses and velocity dispersions; the internal consistency checks are explicitly labeled as checks, not independent predictions.
full rationale
No material circularity found. Equations (5) and (6) are BCES-bisector regressions of directly measured MBH against central velocity dispersion for independently classified Sersic (102 galaxies) and core-Sersic (35 galaxies) subsamples; the slope difference is an empirical result, not an input. The core-Sersic classification is based on the authors' earlier multi-component light-profile decompositions, which do not use MBH or sigma values, so the classification is not defined in terms of the relation being predicted. The Section 4 'internal consistency' checks combine the authors' own MBH-sigma and MBH-M* relations fit to largely the same galaxies; however, the paper explicitly frames these as consistency checks rather than independent predictions, and no equation reduces to its own input by construction. The L-sigma bend is refit from the Lauer et al. (2007) V-band dataset and 3.6 micron data with updated core classifications, external to the MBH-sigma fits. The Section 3.1 galaxy exclusions are sample-selection choices that affect robustness, but they are not circularity. The main statistical weaknesses, such as the absence of a formal one-line versus two-line model comparison and the dependence of the slope difference on the chosen regression direction, are correctness risks rather than circular steps.
Assumptions & free parameters
free parameters (5)
- Slope of Sersic MBH-sigma relation =
5.75 +/- 0.34
- Slope of core-Sersic MBH-sigma relation =
8.64 +/- 1.10
- Intercepts of the MBH-sigma relations =
8.24 +/- 0.05 and 7.91 +/- 0.20
- Velocity dispersion uncertainty =
10% constant
- Low-mass exclusion threshold =
MBH below 10^6 Msun excluded
assumptions (4)
- domain assumption Central velocity dispersion measured in a fixed physical aperture is comparable across all galaxy types and is a fair proxy for the spheroid velocity dispersion.
- domain assumption The Sersic/core-Sersic, disk, and bar classifications from the authors' multi-component decompositions are correct.
- domain assumption Directly measured black hole masses in the sample are accurate and mutually consistent despite heterogeneous methods (stellar and gas dynamics, masers, proper motion).
- ad hoc to paper The eight excluded galaxies are genuine outliers or unusable, not part of a continuous population.
Cite this review
Pith. "Pith review of Revealing Hidden Substructures in the $M_{BH}$-$\sigma$ Diagram, and Refining the Bend in the $L$-$\sigma$ Relation." pith.science (2026). https://pith.science/paper/O33JBKFI
@misc{pith2026190806838,
  author       = {Pith},
  title        = {Pith review of: Revealing Hidden Substructures in the $M_BH$-$\sigma$ Diagram, and Refining the Bend in the $L$-$\sigma$ Relation},
  year         = {2026},
  howpublished = {\url{https://pith.science/paper/O33JBKFI}},
  note         = {Machine review of arXiv:1908.06838}
}
abstract
Using 145 early- and late-type galaxies (ETGs and LTGs) with directly-measured super-massive black hole masses, $M_{BH}$, we build upon our previous discoveries that: (i) LTGs, most of which have been alleged to contain a pseudobulge, follow the relation $M_{BH}\propto\,M_{*,sph}^{2.16\pm0.32}$; and (ii) the ETG relation $M_{BH}\propto\,M_{*,sph}^{1.27\pm0.07}$ is an artifact of ETGs with/without disks following parallel $M_{BH}\propto\,M_{*,sph}^{1.9\pm0.2}$ relations which are offset by an order of magnitude in the $M_{BH}$-direction. Here, we searched for substructure in the $M_{BH}$--(central velocity dispersion, $\sigma$) diagram using our recently published, multi-component, galaxy decompositions; investigating divisions based on the presence of a depleted stellar core (major dry-merger), a disk (minor wet/dry-merger, gas accretion), or a bar (evolved unstable disk). The S\'ersic and core-S\'ersic galaxies define two distinct relations: $M_{BH}\propto\sigma^{5.75\pm0.34}$ and $M_{BH}\propto\sigma^{8.64\pm1.10}$, with $\Delta_{rms|BH}=0.55$ and $0.46$~dex, respectively. We also report on the consistency with the slopes and bends in the galaxy luminosity ($L$)--$\sigma$ relation due to S\'ersic and core-S\'ersic ETGs, and LTGs which all have S\'ersic light-profiles. Two distinct relations (superficially) reappear in the $M_{BH}$--$\sigma$ diagram upon separating galaxies with/without a disk (primarily for the ETG sample), while we find no significant offset between barred and non-barred galaxies, nor between galaxies with/without active galactic nuclei. We also address selection biases purported to affect the scaling relations for dynamically-measured $M_{BH}$ samples. Our new, (morphological type)-dependent, $M_{BH}$--$\sigma$ relations more precisely estimate $M_{BH}$ in other galaxies, and hold implications for galaxy/black hole co-evolution theories, and simulations. (Abridged)
Figures


Figures from the paper (12 more)




Forward citations
Cited by 1 Pith paper
-
RABBITS IV: Stellar feedback and SMBH merging time-scales in the sub-Milky Way mass regime
Stronger stellar feedback lowers central stellar densities in low-mass merger remnants and systematically lengthens SMBH merger delays, yielding a 30–500 Myr spread in post-hardening coalescence times.
Reference graph
Works this paper leans on
-
[1]
86 0 . 85bces(MBH|σ ) MBH 5. 22 ± 0. 36 8 . 34 ± 0. 05 0 . 32 0 . 43 bces(σ |MBH) σ 6. 29 ± 0. 35 8 . 29 ± 0. 06 0 . 34 0 . 47 46 Late-Type Galaxies bces(Bisector) Symmetric 5. 82 ± 0. 75 8 . 17 ± 0. 14 0 . 57 0 . 63
-
[2]
59 0 . 49bces(MBH|σ ) MBH 4. 07 ± 0. 90 7 . 90 ± 0. 17 0 . 54 0 . 58 bces(σ |MBH) σ 10. 06 ± 1. 74 8 . 83 ± 0. 30 0 . 85 0 . 96 Single Regression on (137) Early and Late-Type Galaxies bces(Bisector) Symmetric 6. 10 ± 0. 28 8 . 27 ± 0. 04 0 . 43 0 . 53
-
[3]
86 0 . 87bces(MBH|σ ) MBH 5. 50 ± 0. 29 8 . 26 ± 0. 04 0 . 42 0 . 51 bces(σ |MBH) σ 6. 82 ± 0. 32 8 . 29 ± 0. 05 0 . 46 0 . 58 S´ ersic and Core-S´ ersic Galaxies 102 S´ ersic Galaxies bces(Bisector) Symmetric 5. 75 ± 0. 34 8 . 24 ± 0. 05 0 . 46 0 . 55
-
[4]
78 0 . 78bces(MBH|σ ) MBH 4. 86 ± 0. 34 8 . 16 ± 0. 05 0 . 45 0 . 52 bces(σ |MBH) σ 7. 02 ± 0. 52 8 . 34 ± 0. 07 0 . 54 0 . 64 35 Core-S´ ersic Galaxies bces(Bisector) Symmetric 8. 64 ± 1. 10 7 . 91 ± 0. 20 0 . 25 0 . 46
-
[5]
73 0 . 65bces(MBH|σ ) MBH 7. 74 ± 1. 15 8 . 04 ± 0. 18 0 . 25 0 . 43 bces(σ |MBH) σ 9. 77 ± 1. 70 7 . 74 ± 0. 31 0 . 27 0 . 52 Galaxies with and without a disk 93 ES, S0, Sp-Type Galaxies bces(Bisector) Symmetric 5. 72 ± 0. 34 8 . 22 ± 0. 06 0 . 47 0 . 56
-
[6]
79 0 . 78bces(MBH|sigma) MBH 4. 86 ± 0. 35 8 . 15 ± 0. 05 0 . 45 0 . 53 bces(σ |MBH) σ 6. 94 ± 0. 51 8 . 32 ± 0. 07 0 . 54 0 . 64 44 E-Type Galaxies bces(Bisector) Symmetric 6. 69 ± 0. 59 8 . 25 ± 0. 10 0 . 30 0 . 43
-
[7]
82 0 . 80bces(MBH|σ ) MBH 6. 05 ± 0. 67 8 . 32 ± 0. 10 0 . 29 0 . 41 bces(σ |MBH) σ 7. 47 ± 0. 69 8 . 16 ± 0. 12 0 . 32 0 . 47 Galaxies with and without a bar 50 Barred Galaxies bces(Bisector) Symmetric 5. 30 ± 0. 54 8 . 14 ± 0. 10 0 . 45 0 . 53
-
[8]
65 0 . 61bces(MBH|σ ) MBH 3. 97 ± 0. 59 7 . 97 ± 0. 10 0 . 43 0 . 49 bces(σ |MBH) σ 7. 86 ± 1. 30 8 . 48 ± 0. 19 0 . 61 0 . 71 87 Non-Barred Galaxies bces(Bisector) Symmetric 6. 16 ± 0. 42 8 . 28 ± 0. 06 0 . 40 0 . 51
Show all 16 references
-
[9]
86bces(MBH|σ ) MBH 5
86 0 . 86bces(MBH|σ ) MBH 5. 57 ± 0. 43 8 . 30 ± 0. 06 0 . 40 0 . 49 bces(σ |MBH) σ 6. 88 ± 0. 45 8 . 25 ± 0. 07 0 . 44 0 . 55 Table 3 continued 32 Sahu, Graham, and Davis Table 3 (continued) Regression Minimization α β ǫ ∆ rms|BH r r s (dex) (dex) (dex) (1) (2) (3) (4) (5) (6...
-
[10]
79bces(MBH|σ ) MBH 5
83 0 . 79bces(MBH|σ ) MBH 5. 37 ± 0. 51 8 . 16 ± 0. 09 0 . 53 0 . 60 bces(σ |MBH) σ 7. 48 ± 0. 66 8 . 28 ± 0. 10 0 . 63 0 . 72 96 Galaxies without AGN bces(Bisector) Symmetric 5. 92 ± 0. 31 8 . 30 ± 0. 05 0 . 37 0 . 48
-
[11]
88bces(MBH|σ ) MBH 5
87 0 . 88bces(MBH|σ ) MBH 5. 43 ± 0. 33 8 . 29 ± 0. 05 0 . 37 0 . 46 bces(σ |MBH) σ 6. 51 ± 0. 33 8 . 30 ± 0. 05 0 . 39 0 . 51 Note— Columns: (1) Type of regression performed. (2) The coordin ate direction in which the offsets from the regression line is minimized. (3) Slope of...
2007
-
[12]
53bces(L|σ ) L 3
52 0 . 53bces(L|σ ) L 3. 38 ± 0. 48 8 . 70 ± 0. 06 0 . 28 0 . 32 bces(σ |L) σ 8. 55 ± 1. 53 8 . 08 ± 0. 19 0 . 44 0 . 58 80 S´ ersic ETGs bces(Bisector) Symmetric 2. 44 ± 0. 18 8 . 41 ± 0. 04 0 . 28 0 . 31
-
[13]
69bces(L|σ ) L 1
73 0 . 69bces(L|σ ) L 1. 93 ± 0. 18 8 . 35 ± 0. 04 0 . 27 0 . 29 bces(σ |L) σ 3. 30 ± 0. 36 8 . 51 ± 0. 05 0 . 35 0 . 38 3.6 µ m 24 Core-S´ ersic ETGs bces(Bisector) Symmetric 5. 16 ± 0. 53 8 . 56 ± 0. 08 0 . 00 0 . 19
-
[14]
76bces(L|σ ) L 5
86 0 . 76bces(L|σ ) L 5. 48 ± 0. 70 8 . 51 ± 0. 11 0 . 00 0 . 20 bces(σ |L) σ 4. 86 ± 0. 47 8 . 60 ± 0. 07 0 . 00 0 . 18 42 S´ ersic ETGs bces(Bisector) Symmetric 2. 97 ± 0. 43 8 . 72 ± 0. 07 0 . 33 0 . 36
-
[15]
61bces(L|σ ) L 2
61 0 . 61bces(L|σ ) L 2. 10 ± 0. 40 8 . 68 ± 0. 06 0 . 32 0 . 33 bces(σ |L) σ 5. 04 ± 0. 92 8 . 81 ± 0. 09 0 . 49 0 . 53 24 LTGs (All S´ ersic) bces(Bisector) Symmetric 2. 10 ± 0. 41 8 . 90 ± 0. 09 0 . 17 0 . 20
-
[16]
68bces(L|σ ) L 1
70 0 . 68bces(L|σ ) L 1. 64 ± 0. 44 8 . 83 ± 0. 10 0 . 16 0 . 18 bces(σ |L) σ 2. 89 ± 0. 42 9 . 03 ± 0. 08 0 . 21 0 . 25 Note— Columns: (1) Type of regression performed. (2) The coordin ate direction in which the offsets from the regression line is minimized. (3) Slope of the r...
2007
Reviewed August 14, 2026 · model on record in the stance chip above.
Discussion (0). Continue with ORCID to comment.