REVIEW 3 major objections 5 minor 3 cited by
The Dust Echo Emission of Fast Blue Optical Transients and Application to the Near-Infrared Excess of AT 2018cow
T0 review · 3 major / 5 minor · reviewed 2026-08-16 · deepseek-v4-flash
Pith's one-line read The near-infrared excess of the fast blue optical transient AT 2018cow is a thermal dust echo from a pre-existing circumstellar shell that the flash largely evaporates within about a day.
desk verdict A solid evolutionary echo model for AT 2018cow's NIR excess whose headline dust mass and distance inherit an assumed density profile and grain-size distribution, making the quantitative claims softer than the reported posteriors suggest. read the letter →
The pith
A machine-rendered reading of the paper's core claim, the machinery that carries it, and where it could break.
The reading
What carries the argument
The paper's central mechanism is a time-dependent dust-heating and evaporation calculation. Each grain balances the heating from the evolving photospheric radiation field against cooling by thermal emission and mass loss by sublimation, with evaporation rate $\dot a=-\zeta\exp(-E_b/k_\mathrm{B}T_d)$; this sets the dust-free cavity radius by energy conservation rather than by an optical-depth criterion. Outside the cavity, the minimum surviving grain size grows with radius because small grains are destroyed first, and the echo luminosity at observer time $t$ is the light-travel-delayed integral over that radius- and size-dependent population. The calculation turns a single evolving input light curve into a self-consistent, multi-temperature, time-dependent dust echo.
What would settle it
Take continued JHK and WISE photometry of AT 2018cow out to 100 to 300 days after explosion: the model predicts a light-crossing plateau followed by a roughly $t^{-3}$ decline with smoothly cooling dust temperatures, so any observed infrared light curve that stays flat, rebrightens, or shows spectral features inconsistent with cooling carbonaceous grains would contradict the echo interpretation.
Extended reading notes
Core claim
On the paper's own terms, the near-infrared excess of AT 2018cow is an echo of the transient's radiation reprocessed by a pre-existing dusty shell. The flash evaporates every grain within roughly $2\times10^{16}$ cm in less than a day, creating a dust-free cavity; further out, smaller grains are destroyed while larger ones survive, so the minimum surviving grain size grows with distance from the source. Each surviving grain is heated and cooled continuously, and because grains of different sizes sit at different temperatures, the echo is a multi-temperature blackbody that evolves as the transient fades. With one parameter set, the model reproduces the optical-to-NIR light curves and the spectra from 3 to 38 days, whereas independent single-temperature fits require dust mass and radius that change with time in ways the authors argue are unphysical. The fitted shell has a mass of roughly $3\times10^{-4}\,M_\odot$, extends to about $5\times10^{17}$ cm, and implies a total CSM mass of order $3\times10^{-2}\,M_\odot$ and a mass-loss rate near $10^{-6}$ to $10^{-4}\,M_\odot\,\mathrm{yr}^{-1}$.
Load-bearing premise
The pre-existing dust shell is assumed to have a density that falls off as the cube of the distance and to be made of carbon grains with the standard interstellar size distribution, with values taken from other astronomical contexts rather than measured for AT 2018cow; the fitted dust mass, CSM mass, and mass-loss rate scale directly with those assumptions.
Editorial extensions
If this is right
- The near-infrared excess of AT 2018cow can be explained without invoking nonthermal emission: it is thermal radiation from dust heated by the transient, so the excess becomes a direct probe of the circumstellar environment.
- Previous single-epoch spectral fits underestimated the dust mass and its distance; the self-consistent echo fit places the shell at about $5\times10^{17}$ cm with a mass near $3\times10^{-4}\,M_\odot$.
- The dust temperature in the echo is neither unique nor constant: at any single epoch small grains near the cavity are hotter, and all temperatures decline as the FBOT fades.
- The inferred CSM mass ($\sim3\times10^{-2}\,M_\odot$) and mass-loss rate ($10^{-6}$ to $10^{-4}\,M_\odot\,\mathrm{yr}^{-1}$) favour an evolved massive progenitor, possibly an ultra-stripped star in a binary, and motivate combined dust and radio modelling.
- Dust echoes in future nearby FBOTs can be used to map the geometry and mass-loss history of their progenitors, provided the infrared light curves are followed for months.
Reading between the lines
- If the evolutionary echo picture is right, the first few days of NIR colour evolution in a future FBOT should show a systematic reddening as the smallest, hottest grains near the cavity are destroyed first; rapid-cadence JHK photometry could test this directly.
- The high derived dust mass implies a dense CSM that should also absorb or scatter radio emission at early times; existing radio upper limits for AT 2018cow could therefore already provide an independent check on the fitted dust density.
- The same evaporation-plus-echo calculation should apply to other luminous transients that show infrared echoes, such as tidal disruption events and superluminous supernovae, potentially revealing that their dust masses are systematically underestimated by single-temperature fits.
Signed reviews
Editorial analysis
A structured set of objections, weighed in public.
Referee Report
Summary. The paper presents a time-dependent model of infrared dust echo emission from fast blue optical transients (FBOTs), in which the transient's radiation evaporates the innermost dust, producing a dust-free cavity and a transition zone where only larger grains survive, and the surviving grains are continuously heated and cool as the FBOT luminosity evolves. The model is applied to AT 2018cow: an Arnett/magnetar-powered FBOT light curve plus a dust shell with n(r) ∝ r^-3 and a graphite power-law grain size distribution are used to fit the optical-to-NIR light curves and seven epochs of spectra with a single parameter set. The authors find a dust shell mass of about 3×10^-4 M_sun, an outer radius of about 5×10^17 cm, and an implied CSM mass of about 3×10^-2 M_sun, and argue that these quantities are substantially larger than those obtained by independent single-temperature blackbody fits to individual NIR spectra, whose parameters vary unphysically with time.
Significance. If the model is accepted, it is a useful advance over epoch-by-epoch spectral fitting: it provides a physically self-consistent explanation of the NIR excess of AT 2018cow, avoids time-varying dust mass and radius, and predicts a distinctive evolution of the dust temperature distribution. The model is transparent and the underlying grain heating, evaporation, and echo integrals are standard. The central quantitative conclusions, however, remain contingent on unconstrained assumptions about the density profile and grain properties, so the headline claim that the dust mass and distance are much larger than found by direct fitting should be read as conditional on those assumptions. The comparison with direct single-temperature fits is heuristically valuable but needs to be made more quantitative to be fully convincing.
major comments (3)
- [§2 and Eq. (23)] In §2 the dust shell is fixed to n(r) = n_d (r/R*)^-3 with R* = 10^16 cm (Eq. 1) and to graphite grains with a^-3.5 from 0.001 to 10 microns; the authors themselves note that these ISM values may not truly be applicable to FBOTs. The headline dust mass is directly tied to these choices: Eq. (23) gives M_d ∝ n_d R*^3 a_max^3 (a_max/a_min)^(1-alpha) ln(R_out/R_ev,min), and the echo integral in Eq. (16) weights each shell by n(r) r, so a steeper or shallower density slope changes which radii dominate the observed flux. A change of the density index from -3 to -2 or -4, or a truncated grain size distribution, can plausibly shift the fitted n_d and R_out by much more than the quoted ±0.01 dex posterior uncertainties. I therefore ask for a quantitative sensitivity study over plausible density slopes (e.g., -2, -3, -4), grain-size power-law indices in the stated 2.0-4.5 range, and grain compositions, reporting how M_d, R_out, and the claimed factor-of-several increase over direct fits change. Without this, the central quantitative claim is not robust.
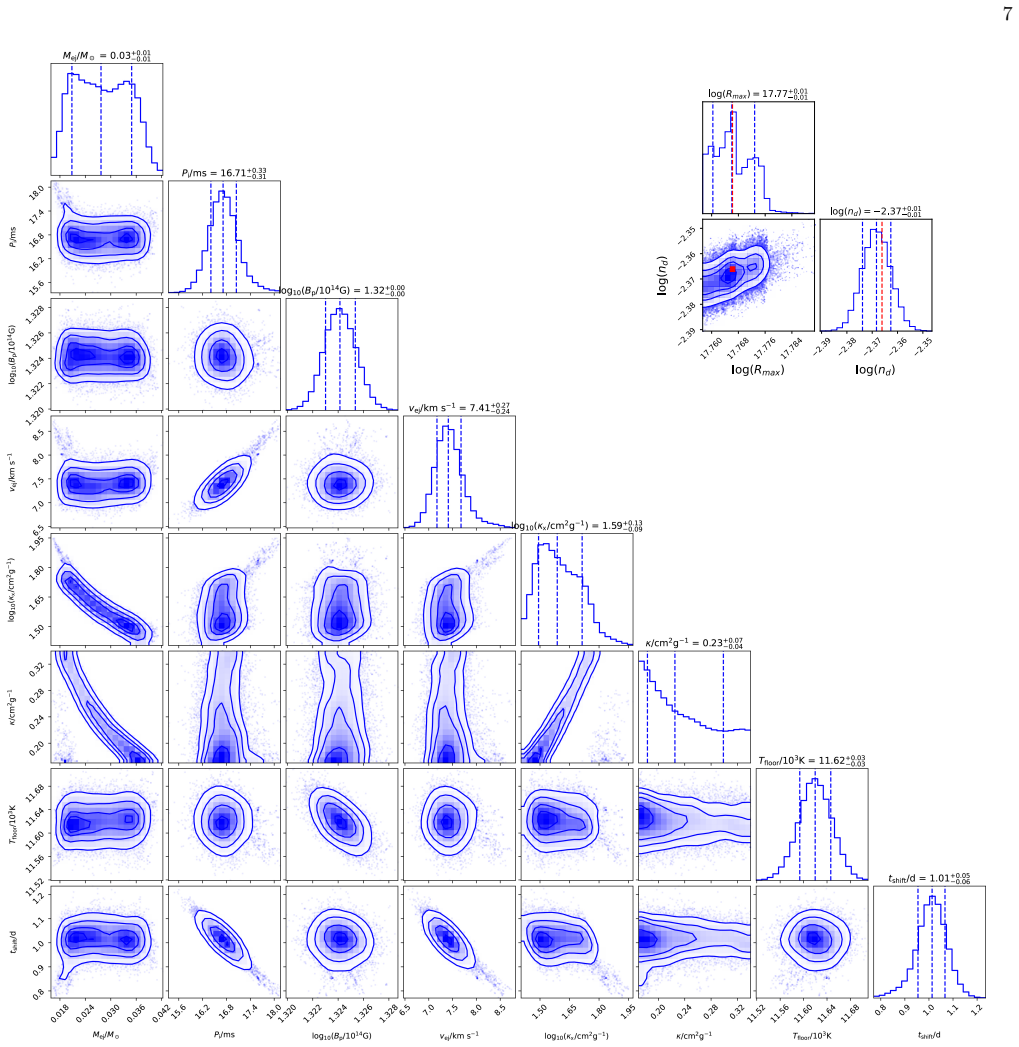
- [§3.3 and Table 1] The posterior uncertainties in Table 1 (log10 n_d = -2.37^{+0.00}_{-0.01}, log10 R_out = 17.77^{+0.01}_{-0.01}) are conditional on all the fixed profile and grain choices, and the NIR data set consists of only a few JHK epochs plus two private NEOWISE points, one of which is explicitly tentative. These errors should not be presented as constraints on the physical dust distribution; they measure only the narrowest part of the model uncertainty. The paper should either state this limitation prominently in the results, or preferably quote parameter ranges obtained from the sensitivity analysis requested above. In addition, the two-step fitting procedure (FBOT parameters fixed from optical bands before the dust echo is fit to z/JHK/W) means that the dust parameters inherit any bias in the optical-only FBOT fit; a simultaneous fit or a demonstration that the optical parameters are unchanged when the echo is included would remove this concern.
- [§3.4 and Fig. 7] The comparison with direct empirical fits is weakened by the fact that the comparison model is deliberately a single-temperature blackbody, so the time-varying T_dust, M_dust, and R_dust in Fig. 7 are a predicted artifact of using the wrong spectral model on a multi-temperature distribution. To make the claim that the evolutionary echo model gives larger mass and distance quantitative, I ask the authors to apply their single-temperature fitting procedure to mock spectra generated from their own best-fit model and demonstrate that it reproduces the same order-of-magnitude underestimates and time evolution shown in Fig. 7. This would isolate the effect of the fitting method from the effect of the assumed density profile and would strengthen the paper's main contrast.
minor comments (5)
- [Eq. (23)] In Eq. (23), the first integral's radial limits are printed as R_out and R_ev,min; the lower limit should be R_ev,min.
- [§3.3 and footnote 2] The W1 and W2 photometry come from private communication, and the W1 point is tentative; please publish these measurements in a machine-readable table, including exact epochs, uncertainties, and upper limits, so that the fit can be reproduced.
- [§3.4] The direct spectral fitting method is not fully specified; please state explicitly whether each spectrum is fit with a two-component model (a blue photospheric blackbody plus a single-temperature dust blackbody), and how the blue component is treated, so that the comparison with previous literature is reproducible.
- [§3.3 and Fig. 2] The z-band residual noted in the text is not quantified; a residual panel or a root-mean-square deviation for each band would help the reader judge the quality of the multi-band fit.
- [§2 and Eq. (8)] The text around Eq. (8) discusses the absorption depth of the dust shell before dust destruction; please clarify that this estimate applies to the unperturbed shell and that after evaporation the effective inner edge is R_ev, not the original R_in, which the model then treats as irrelevant.
Circularity Check
No circularity: the dust-echo model is a forward model fitted to the data; the derived mass and distance are model-dependent outputs, not inputs renamed as predictions.
full rationale
I found no circular step in the derivation chain. The dust shell density profile (Eq. 1) and grain size distribution (Eq. 2) are stated assumptions, and the fitted parameters n_d and R_out are converted into a dust mass through Eq. 23; this is a standard model-dependent inference, not an equivalence between input and output by construction. The abstract's comparison with single-temperature spectral fits is a physical argument that a multi-temperature, time-evolving echo can explain the data with constant dust parameters, not a renaming of fitted values as predictions. The phrase 'model-predicted spectra' in Section 3.3 refers to spectra computed from the same best-fit parameters used for the light-curve fit, so it is a fit diagnostic rather than an out-of-sample prediction; this is loose wording, but the central claim does not reduce to that comparison. The evaporation cavity and echo light curve follow from external microphysics (Waxman & Draine 2000 evaporation, Draine absorption coefficients) and are anchored to external data (Perley et al. 2019, NEOWISE). No load-bearing self-citation or imported uniqueness theorem is used. Model dependence on the assumed r^-3 profile and ISM grain properties is a correctness/systematic-uncertainty concern, not circularity.
Assumptions & free parameters
free parameters (10)
- M_ej =
0.03 M_sun
- P_i =
16.71 ms
- B_p =
10^1.32 x 10^14 G (~2.1e15 G)
- v_ej =
7.41e9 cm/s
- kappa_X =
10^1.59 cm2/g
- kappa =
0.23 cm2/g
- T_floor =
1.16e4 K
- t_shift =
1.01 days
- n_d =
10^-2.37 cm^-3
- R_out =
10^17.77 cm
assumptions (7)
- domain assumption The FBOT bolometric light curve follows the Arnett (1982) diffusion solution with magnetar spin-down power and X-ray absorption (Eqs. 9-12).
- domain assumption A pre-existing dust shell with number density n(r) = n_d (r/R*)^-3 between R_in and R_out (Eq. 1).
- domain assumption Dust grains are carbonaceous with an MRN-like size distribution alpha = 3.5 over 0.001 to 10 micron (Eq. 2).
- standard math Evaporation follows Waxman and Draine (2000) with zeta = 4.13e6 cm/s and binding energy E_b = 7.5 eV (Eq. 7).
- standard math The dust absorption coefficients Q_abs come from Draine's public opacity tables over 10^-3 to 10^3 micron (Eq. 3).
- domain assumption A canonical gas-to-dust mass ratio of 100:1 converts the dust mass to a CSM mass (Section 4).
- ad hoc to paper The FBOT spectrum is a blackbody at T_ph, with a floor temperature T_floor imposed at late times (Eq. 13).
Cite this review
Pith. "Pith review of The Dust Echo Emission of Fast Blue Optical Transients and Application to the Near-Infrared Excess of AT 2018cow." pith.science (2026). https://pith.science/paper/O4GRDY7B
@misc{pith2026250419897,
  author       = {Pith},
  title        = {Pith review of: The Dust Echo Emission of Fast Blue Optical Transients and Application to the Near-Infrared Excess of AT 2018cow},
  year         = {2026},
  howpublished = {\url{https://pith.science/paper/O4GRDY7B}},
  note         = {Machine review of arXiv:2504.19897}
}
read the original abstract
A near-infrared (NIR) excess has been discovered in the emission of the representative fast blue optical transient (FBOT): AT 2018cow. It was suggested that this NIR excess could be emitted by the dust surrounding the source and, thus, could provide a probe into the nature of its progenitor. We develop a model to describe the influence of the FBOT emission on the environmental dust and, as a result, a dust-free evaporation cavity can be formed on a timescale of one day. Outside this cavity, the surviving dust grains can have different size distributions at different distances to the source. With such a special dust environment, we fit the multi-wavelength light curves of AT 2018cow by taking into account the evolutionary dust echo of the FBOT emission. It is found that the dust temperature can vary with time along with the evolution of the irradiating FBOT emission. Even at a fixed time, the dust temperature can be distributed in a wide range rather than having only a unique value. Furthermore, both the mass of the dust shell and its distance to the FBOT are found to be much larger than those derived with a direct empirical fitting of the NIR spectra but without considering the evolutionary relationship between the spectra.
Figures


Figures from the paper (3 more)


Forward citations
Cited by 3 Pith papers
-
Luminous Fast Blue Optical Transients as "Failed" Gravitational-wave Sources: Helium Core$-$Black Hole Mergers Following Delayed Dynamical Instability
Luminous fast blue optical transients may be the aftermath of a black hole merging with a companion star's helium core after prolonged mass transfer, producing a super-Eddington accretion flare.
-
The Most Luminous Known Fast Blue Optical Transient AT 2024wpp: Unprecedented Evolution and Properties in the Ultraviolet to the Near-Infrared
AT 2024wpp radiated more than 10^51 erg in 45 days, showing persistent 20,000 K blackbody emission, two-velocity hydrogen and helium lines, and a near-infrared excess, indicating an accretion-powered compact object.
-
Implications of the UV/optical Plateau of AT2018cow
A wind-and-irradiation disk model fits the AT2018cow UV plateau with accretor masses from 1.4 to ~100 solar masses, removing the need for a >200 solar-mass black hole.
Reference graph
Works this paper leans on
-
[1]
Arnett, W. D. 1982, ApJ, 253, 785, doi: 10.1086/159681
doi:10.1086/159681 1982
-
[2]
S., Margutti, R., Matthews, D., et al
Bright, J. S., Margutti, R., Matthews, D., et al. 2022, The Astrophysical Journal, 926, 112
2022
-
[3]
2017, ApJ, 850, 127, doi: 10.3847/1538-4357/aa9568
Brooks, J., Schwab, J., Bildsten, L., et al. 2017, ApJ, 850, 127, doi: 10.3847/1538-4357/aa9568
-
[4]
2024, arXiv preprint arXiv:2411.18985
Chen, C., & Shen, R.-F. 2024, arXiv preprint arXiv:2411.18985
arXiv 2024
-
[5]
A., & Fransson, C
Chevalier, R. A., & Fransson, C. 2006, The Astrophysical Journal, 651, 381
2006
-
[6]
Chevalier, R. A., & Irwin, C. M. 2011, ApJL, 729, L6, doi: 10.1088/2041-8205/729/1/L6
-
[7]
2009, Monthly Notices of the Royal Astronomical Society, 400, 866
Chugai, N. 2009, Monthly Notices of the Royal Astronomical Society, 400, 866
2009
-
[8]
1998, Physical Review Letters, 81, 4301
Dai, Z., & Lu, T. 1998, Physical Review Letters, 81, 4301
1998
Show all 86 references
-
[9]
M., Ofek, E
De, K., Kasliwal, M. M., Ofek, E. O., et al. 2018, Science, 362, 201, doi: 10.1126/science.aas8693
2018 doi
-
[10]
Draine, B., & Lee, H. M. 1984, Astrophysical Journal, Part 1 (ISSN 0004-637X), vol. 285, Oct. 1, 1984, p. 89-108. Research supported by the Alfred P. Sloan Foundation., 285, 89
1984
-
[11]
A., Smith, L
Drissen, L., Crowther, P. A., Smith, L. J., et al. 2001, The Astrophysical Journal, 546, 484
2001
-
[12]
R., Chornock, R., Soderberg, A
Drout, M. R., Chornock, R., Soderberg, A. M., et al. 2014, The Astrophysical Journal, 794, 23
2014
-
[13]
R., Chornock, R., Soderberg, A
Drout, M. R., Chornock, R., Soderberg, A. M., et al. 2014, ApJ, 794, 23, doi: 10.1088/0004-637X/794/1/23
2014 doi
-
[14]
1983, Astrophysical Journal, Part 1 (ISSN 0004-637X), vol
Dwek, E. 1983, Astrophysical Journal, Part 1 (ISSN 0004-637X), vol. 274, Nov. 1, 1983, p. 175-183., 274, 175 —. 1985, Astrophysical Journal, Part 1 (ISSN 0004-637X), vol. 297, Oct. 15, 1985, p. 719-723. NASA-supported research., 297, 719
1983
-
[15]
W., Lang, D., & Goodman, J
Foreman-Mackey, D., Hogg, D. W., Lang, D., & Goodman, J. 2013, Publications of the Astronomical Society of the Pacific, 125, 306
2013
-
[16]
D., Chevalier, R
Fox, O. D., Chevalier, R. A., Dwek, E., et al. 2010, The Astrophysical Journal, 725, 1768
2010
- [17]
-
[18]
D., Chevalier, R
Fox, O. D., Chevalier, R. A., Skrutskie, M. F., et al. 2011, The Astrophysical Journal, 741, 7
2011
-
[19]
2019, Annual Review of Astronomy and Astrophysics, 57, 305
Gal-Yam, A. 2019, Annual Review of Astronomy and Astrophysics, 57, 305
2019
-
[20]
2009, Nature, 462, 624
Gal-Yam, A., Mazzali, P., Ofek, E., et al. 2009, Nature, 462, 624
2009
-
[21]
2014, Nature, 509, 471
Gal-Yam, A., Arcavi, I., Ofek, E., et al. 2014, Nature, 509, 471
2014
-
[22]
2014, Nature, 511, 326 11
Gall, C., Hjorth, J., Watson, D., et al. 2014, Nature, 511, 326 11
2014
-
[23]
2012, ApJ, 757, 178, doi: 10.1088/0004-637X/757/2/178 Gonz´ alez-Tor` a, G., Wittkowski, M., Davies, B., Plez, B., &
Ginzburg, S., & Balberg, S. 2012, ApJ, 757, 178, doi: 10.1088/0004-637X/757/2/178 Gonz´ alez-Tor` a, G., Wittkowski, M., Davies, B., Plez, B., &
2012 doi
-
[24]
2023, Astronomy & Astrophysics, 669, A76
Kravchenko, K. 2023, Astronomy & Astrophysics, 669, A76
2023
-
[25]
2022, MNRAS, doi: 10.1093/mnras/stac910
Gottlieb, O., Tchekhovskoy, A., & Margutti, R. 2022, MNRAS, doi: 10.1093/mnras/stac910
2022 doi
-
[26]
E., Nugent, P
Harris, C. E., Nugent, P. E., & Kasen, D. N. 2016, The Astrophysical Journal, 823, 100
2016
-
[27]
Ho, A. Y. 2022, in The Landscape of Relativistic Stellar Explosions (Springer), 217–258
2022
-
[28]
Y., Phinney, E
Ho, A. Y., Phinney, E. S., Ravi, V., et al. 2019, The Astrophysical Journal, 871, 73
2019
-
[29]
2017, ApJ, 850, 18, doi: 10.3847/1538-4357/aa8c7d
Hotokezaka, K., Kashiyama, K., & Murase, K. 2017, ApJ, 850, 18, doi: 10.3847/1538-4357/aa8c7d
2017 doi
- [30]
-
[31]
2019, Nature Astronomy, 3, 697
Inserra, C. 2019, Nature Astronomy, 3, 697
2019
-
[32]
2021, The Astrophysical Journal, 911, 31
Jiang, N., Wang, T., Hu, X., et al. 2021, The Astrophysical Journal, 911, 31
2021
-
[33]
2010, The Astrophysical Journal, 717, 245
Kasen, D., & Bildsten, L. 2010, The Astrophysical Journal, 717, 245
2010
-
[34]
M., Kulkarni, S
Kasliwal, M. M., Kulkarni, S. R., Gal-Yam, A., et al. 2010, ApJL, 723, L98, doi: 10.1088/2041-8205/723/1/L98
2010 doi
-
[35]
2011, The Astrophysical Journal, 743, 73
Kochanek, C. 2011, The Astrophysical Journal, 743, 73
2011
-
[36]
2005, The Astrophysical Journal, 628, L123
Mattila, S. 2005, The Astrophysical Journal, 628, L123
2005
-
[37]
Kuin, N. P. M., Wu, K., Oates, S., et al. 2019, Monthly Notices of the Royal Astronomical Society, 487, 2505
2019
-
[38]
Laor, A., & Draine, B. T. 1993, Astrophysical Journal, Part 1 (ISSN 0004-637X), vol. 402, no. 2, p. 441-468., 402, 441
1993
-
[39]
2020, ApJ, 903, 66, doi: 10.3847/1538-4357/abba33
Leung, S.-C., Blinnikov, S., Nomoto, K., et al. 2020, ApJ, 903, 66, doi: 10.3847/1538-4357/abba33
2020 doi
-
[40]
2022, The Astrophysical Journal, 928, 77
Li, J.-Y., Wang, S.-Q., Gan, W.-P., et al. 2022, The Astrophysical Journal, 928, 77
2022
-
[41]
2024, The Astrophysical Journal Letters, 963, L13
Li, L., Zhong, S.-Q., Xiao, D., et al. 2024, The Astrophysical Journal Letters, 963, L13
2024
-
[42]
2022, ApJL, 935, L34, doi: 10.3847/2041-8213/ac86d2
Liu, J.-F., Zhu, J.-P., Liu, L.-D., Yu, Y.-W., & Zhang, B. 2022, ApJL, 935, L34, doi: 10.3847/2041-8213/ac86d2
2022 doi
-
[43]
2022, The Astrophysical Journal Letters, 935, L34
Liu, J.-F., Zhu, J.-P., Liu, L.-D., Yu, Y.-W., & Zhang, B. 2022, The Astrophysical Journal Letters, 935, L34
2022
-
[44]
2020, Monthly Notices of the Royal Astronomical Society, 495, 992
Lyman, J., Galbany, L., S´ anchez, S., et al. 2020, Monthly Notices of the Royal Astronomical Society, 495, 992
2020
-
[45]
2014, The Astrophysical Journal, 792, 30
Mainzer, A., Bauer, J., Cutri, R., et al. 2014, The Astrophysical Journal, 792, 30
2014
-
[46]
2019, The Astrophysical Journal, 872, 18
Margutti, R., Metzger, B., Chornock, R., et al. 2019, The Astrophysical Journal, 872, 18
2019
-
[47]
S., Rumpl, W., & Nordsieck, K
Mathis, J. S., Rumpl, W., & Nordsieck, K. H. 1977, Astrophysical Journal, Part 1, vol. 217, Oct. 15, 1977, p. 425-433. NSF-supported research., 217, 425
1977
-
[48]
2018, The Astronomical Journal, 156, 69
Meisner, A., Lang, D., & Schlegel, D. 2018, The Astronomical Journal, 156, 69
2018
-
[49]
D., & Perley, D
Metzger, B. D., & Perley, D. A. 2023, The Astrophysical Journal, 944, 74 Micha lowski, M. J., Kamphuis, P., Hjorth, J., et al. 2019, Astronomy & Astrophysics, 627, A106
2023
-
[50]
2020, The Astrophysical Journal Letters, 888, L24
Mohan, P., An, T., & Yang, J. 2020, The Astrophysical Journal Letters, 888, L24
2020
-
[51]
2023, Monthly Notices of the Royal Astronomical Society, 518, 623
Mor, R., Livne, E., & Piran, T. 2023, Monthly Notices of the Royal Astronomical Society, 518, 623
2023
-
[52]
J., & Eldridge, J
Moriya, T. J., & Eldridge, J. J. 2016, MNRAS, 461, 2155, doi: 10.1093/mnras/stw1471
2016 doi
-
[53]
2021, The Astrophysical Journal Letters, 912, L9
Nayana, A., & Chandra, P. 2021, The Astrophysical Journal Letters, 912, L9
2021
-
[54]
2017, The Astrophysical Journal, 850, 55
Nicholl, M., Guillochon, J., & Berger, E. 2017, The Astrophysical Journal, 850, 55
2017
-
[55]
O., Cameron, P., Kasliwal, M., et al
Ofek, E. O., Cameron, P., Kasliwal, M., et al. 2007, The Astrophysical Journal, 659, L13
2007
-
[56]
R., Ho, W
Pasham, D. R., Ho, W. C., Alston, W., et al. 2022, Nature Astronomy, 6, 249
2022
-
[57]
1984, Astronomy and Astrophysics (ISSN 0004-6361), vol
Pearce, G., & Evans, A. 1984, Astronomy and Astrophysics (ISSN 0004-6361), vol. 136, no. 2, July 1984, p. 306-312., 136, 306
1984
-
[58]
A., Vink´ o, J., et al
Pellegrino, C., Howell, D. A., Vink´ o, J., et al. 2022, ApJ, 926, 125, doi: 10.3847/1538-4357/ac3e63
2022 doi
-
[59]
A., Mazzali, P
Perley, D. A., Mazzali, P. A., Yan, L., et al. 2019, Monthly Notices of the Royal Astronomical Society, 484, 1031
2019
-
[60]
2016, Monthly Notices of the Royal Astronomical Society, 460, 44
Petropoulou, M., Kamble, A., & Sironi, L. 2016, Monthly Notices of the Royal Astronomical Society, 460, 44
2016
-
[61]
2004, Monthly Notices of the Royal Astronomical Society, 352, 457
Pozzo, M., Meikle, W., Fassia, A., et al. 2004, Monthly Notices of the Royal Astronomical Society, 352, 457
2004
-
[62]
2018, The Astrophysical Journal Letters, 865, L3
Prentice, S., Maguire, K., Smartt, S., et al. 2018, The Astrophysical Journal Letters, 865, L3
2018
-
[63]
M., Aldering, G., Wheeler, J
Quimby, R. M., Aldering, G., Wheeler, J. C., et al. 2007, The Astrophysical Journal, 668, L99
2007
-
[64]
M., Khatami, D., et al
Rest, A., Garnavich, P. M., Khatami, D., et al. 2018, Nature Astronomy, 2, 307, doi: 10.1038/s41550-018-0423-2 Rivera Sandoval, L., Maccarone, T., Corsi, A., et al. 2018, Monthly Notices of the Royal Astronomical Society: Letters, 480, L146
2018 doi
-
[65]
2019, Monthly Notices of the Royal Astronomical Society: Letters, 485, L93
Roychowdhury, S., Arabsalmani, M., & Kanekar, N. 2019, Monthly Notices of the Royal Astronomical Society: Letters, 485, L93
2019
-
[66]
Sarangi, A., Dwek, E., & Arendt, R. G. 2018, The Astrophysical Journal, 859, 66
2018
-
[67]
2022, ApJ, 927, 223, doi: 10.3847/1538-4357/ac53ae 12
Sawada, R., Kashiyama, K., & Suwa, Y. 2022, ApJ, 927, 223, doi: 10.3847/1538-4357/ac53ae 12
2022 doi
-
[68]
L., & Teukolsky, S
Shapiro, S. L., & Teukolsky, S. A. 2024, Black holes, white dwarfs and neutron stars: the physics of compact objects (John Wiley & Sons)
2024
-
[69]
2008, The Astrophysical Journal, 686, 467
Smith, N., Chornock, R., Li, W., et al. 2008, The Astrophysical Journal, 686, 467
2008
-
[70]
J., et al
Smith, N., Li, W., Foley, R. J., et al. 2007, The Astrophysical Journal, 666, 1116
2007
-
[71]
2015, MNRAS, 454, 3073, doi: 10.1093/mnras/stv2195
Takahashi, K. 2015, MNRAS, 454, 3073, doi: 10.1093/mnras/stv2195
2015 doi
-
[72]
2013, Astronomy & Astrophysics, 549, A79
Szalai, T., & Vink´ o, J. 2013, Astronomy & Astrophysics, 549, A79
2013
-
[73]
2020, Astronomy & Astrophysics, 635, A39
Tartaglia, L., Pastorello, A., Sollerman, J., et al. 2020, Astronomy & Astrophysics, 635, A39
2020
-
[74]
M., Langer, N., Moriya, T
Tauris, T. M., Langer, N., Moriya, T. J., et al. 2013, ApJL, 778, L23, doi: 10.1088/2041-8205/778/2/L23
2013 doi
-
[75]
M., Langer, N., & Podsiadlowski, P
Tauris, T. M., Langer, N., & Podsiadlowski, P. 2015, MNRAS, 451, 2123, doi: 10.1093/mnras/stv990
2015 doi
-
[76]
M., Kramer, M., Freire, P
Tauris, T. M., Kramer, M., Freire, P. C. C., et al. 2017, ApJ, 846, 170, doi: 10.3847/1538-4357/aa7e89
2017 doi
-
[77]
D., Jiang, Y.-F., & White, C
Tuna, S., Metzger, B. D., Jiang, Y.-F., & White, C. J. 2025, Time-Dependent Radiation Transport Simulations of Infrared Echoes from Dust-Shrouded Luminous Transients. https://arxiv.org/abs/2501.13157
2025 arXiv
-
[78]
2000, The Astrophysical Journal, 537, 796
Waxman, E., & Draine, B. 2000, The Astrophysical Journal, 537, 796
2000
-
[79]
L., Eisenhardt, P
Wright, E. L., Eisenhardt, P. R., Mainzer, A. K., et al. 2010, The Astronomical Journal, 140, 1868
2010
-
[80]
2021, ApJ, 910, 42, doi: 10.3847/1538-4357/abdeba
Xiang, D., Wang, X., Lin, W., et al. 2021, ApJ, 910, 42, doi: 10.3847/1538-4357/abdeba
2021 doi
-
[81]
2019a, ApJL, 877, L21, doi: 10.3847/2041-8213/ab1f85
Yu, Y.-W., Chen, A., & Li, X.-D. 2019a, ApJL, 877, L21, doi: 10.3847/2041-8213/ab1f85
-
[82]
2019b, ApJL, 870, L23, doi: 10.3847/2041-8213/aaf960
Yu, Y.-W., Chen, A., & Wang, B. 2019b, ApJL, 870, L23, doi: 10.3847/2041-8213/aaf960
-
[83]
2015, ApJL, 806, L6, doi: 10.1088/2041-8205/806/1/L6
Yu, Y.-W., Li, S.-Z., & Dai, Z.-G. 2015, ApJL, 806, L6, doi: 10.1088/2041-8205/806/1/L6
2015 doi
-
[84]
2013, ApJL, 776, L40, doi: 10.1088/2041-8205/776/2/L40
Yu, Y.-W., Zhang, B., & Gao, H. 2013, ApJL, 776, L40, doi: 10.1088/2041-8205/776/2/L40
2013 doi
-
[85]
2017, ApJ, 840, 12, doi: 10.3847/1538-4357/aa6c27
Yu, Y.-W., Zhu, J.-P., Li, S.-Z., L¨ u, H.-J., & Zou, Y.-C. 2017, ApJ, 840, 12, doi: 10.3847/1538-4357/aa6c27
2017 doi
-
[86]
B., & Toonen, S
Zenati, Y., Perets, H. B., & Toonen, S. 2019, MNRAS, 486, 1805, doi: 10.1093/mnras/stz316
2019 doi
Reviewed August 16, 2026 · model on record in the stance chip above.
Discussion (0). Continue with ORCID to comment.