Pseudo-value Based Mean Cumulative Count Regression
Pith reviewed 2026-06-25 23:25 UTC · model grok-4.3
The pith
Pseudo-value regression estimates covariate effects on recurrent event accumulation using standard tools.
A machine-rendered reading of the paper's core claim, the machinery that carries it, and where it could break.
Core claim
Influence-function-based pseudo-values can be used as regression outcomes to estimate covariate effects on the mean cumulative function and the area under the mean cumulative function at a fixed truncation time, with estimation performed via standard generalized estimating equation machinery or ordinary least squares under an identity link.
What carries the argument
Influence-function-based pseudo-values constructed for the MCF and AUMCF, used directly as outcomes in a regression model.
If this is right
- Standard regression software can be applied to recurrent event data without custom implementations.
- Covariate effects on cumulative event burden can be estimated at any fixed time horizon.
- Both the mean cumulative count and its integrated area can be modeled in the same framework.
- Type I error and coverage properties hold under the assumed censoring conditions in simulations.
Where Pith is reading between the lines
- The method may extend naturally to time-varying covariates if the pseudo-value construction can be adapted.
- Similar pseudo-value approaches could apply to other recurrent event summaries beyond the MCF.
- Applications in other fields with recurrent events, such as reliability engineering, become more accessible with standard tools.
Load-bearing premise
The influence function used to create the pseudo-values assumes censoring and terminal events are independent of the event process conditional on the covariates.
What would settle it
Observing bias in the regression coefficients when the censoring mechanism depends on unobserved factors that also affect the event rate.
Figures


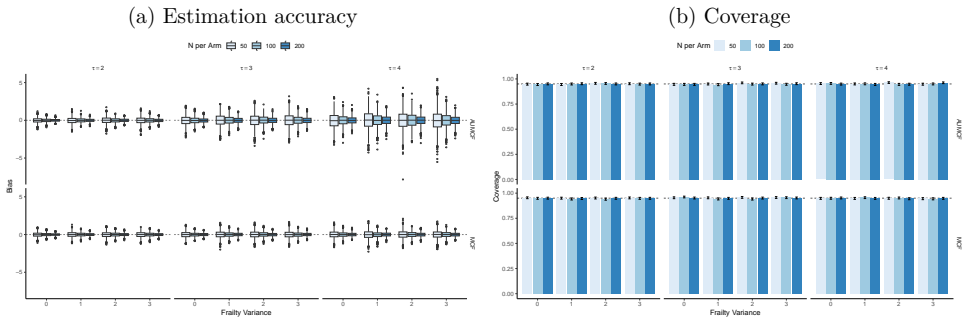


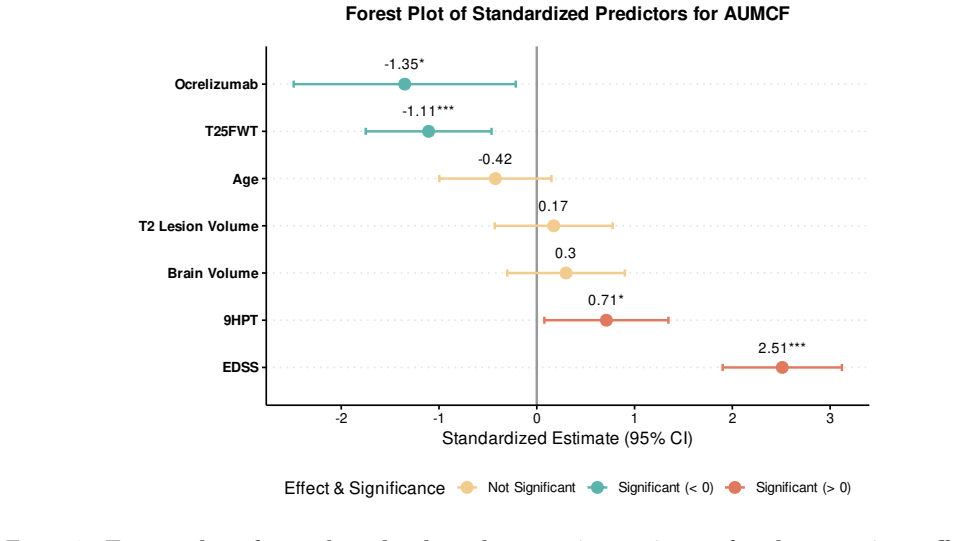
read the original abstract
The mean cumulative function (MCF) summarizes how events accumulate over time for a recurrent or multi-component endpoint. The MCF, and its integral over a given time horizon, the area under the MCF (AUMCF), provide interpretable summaries of recurrent-event burden in the presence of right-censoring and terminal events. Existing approaches for these estimands have focused primarily on nonparametric treatment comparisons, covariate-adjusted augmentation, and linearized test statistics. Herein, we propose a pseudo-value-based regression approach for estimating covariate effects on the MCF and AUMCF at a fixed truncation time. The proposed method uses influence-function-based pseudo-values as regression outcomes, allowing estimation with standard generalized estimating equation machinery and, under an identity link, ordinary least squares. Through simulation studies, we evaluate estimation accuracy, confidence interval coverage, type I error control, and power across a range of recurrent-event settings. We demonstrate the utility of the proposed covariate adjustment procedure through an application to the ORATORIO clinical trial, evaluating the safety and efficacy of ocrelizumab for the treatment of primary progressive multiple sclerosis. Overall, pseudo-value-based regression provides a simple and interpretable framework for modeling covariate effects on cumulative recurrent-event burden over time.
Editorial analysis
A structured set of objections, weighed in public.
Referee Report
Summary. The manuscript proposes a pseudo-value-based regression approach for estimating covariate effects on the mean cumulative function (MCF) and area under the MCF (AUMCF) at a fixed truncation time. Influence-function-based pseudo-values are constructed from the nonparametric MCF estimator and used as regression outcomes in GEE machinery (or OLS under identity link), with performance evaluated in simulations for accuracy, coverage, type I error, and power, plus an application to the ORATORIO trial.
Significance. If the central consistency result holds, the approach supplies a straightforward, software-friendly route to covariate-adjusted inference on recurrent-event burden summaries. Credit is due for the simulation battery (accuracy, coverage, type I error, power) and the real-data demonstration on a phase-III multiple-sclerosis trial; these elements make the practical contribution concrete.
major comments (2)
- [Pseudo-value construction and consistency argument] The consistency claim for the OLS/GEE estimator rests on E[pseudo-value_i | X_i] equaling the true conditional MCF given X_i. This equality holds only when the influence function is derived under censoring and terminal-event mechanisms that are independent of the recurrent process conditional on the covariates entering the regression (see abstract description of pseudo-value construction and its direct use as outcomes). The manuscript does not state this conditional-independence requirement explicitly or provide a proof/relaxation.
- [Simulation studies section] Simulation design evaluates performance only under data-generating processes that satisfy the independent-censoring assumption implicit in the influence-function derivation. Scenarios with covariate-dependent censoring or omitted censoring covariates would directly test whether bias appears in the regression coefficients when the weakest assumption is violated.
minor comments (2)
- [Notation and definitions] Define AUMCF explicitly as the integral of the MCF up to the fixed truncation time and state whether the pseudo-value construction is applied directly to the integrated functional or obtained by integrating the MCF pseudo-values.
- [Simulation result tables] In tables reporting simulation results, add a column or footnote indicating the link function and whether GEE or OLS was used for each row.
Simulated Author's Rebuttal
We thank the referee for the constructive comments. We address each major comment below, indicating where we will revise the manuscript to improve clarity and completeness.
read point-by-point responses
-
Referee: [Pseudo-value construction and consistency argument] The consistency claim for the OLS/GEE estimator rests on E[pseudo-value_i | X_i] equaling the true conditional MCF given X_i. This equality holds only when the influence function is derived under censoring and terminal-event mechanisms that are independent of the recurrent process conditional on the covariates entering the regression (see abstract description of pseudo-value construction and its direct use as outcomes). The manuscript does not state this conditional-independence requirement explicitly or provide a proof/relaxation.
Authors: We agree that the conditional independence of censoring and terminal events given the covariates must be stated explicitly for the consistency result to hold. In the revised manuscript we will add a dedicated paragraph in the Methods section stating this assumption and its role in ensuring E[pseudo-value_i | X_i] equals the target conditional MCF. While we do not provide a self-contained proof (as the result follows from standard properties of influence-function pseudo-values under independent censoring, as in the cited pseudo-value literature), we will include a brief justification with references to the relevant theory and note that the GEE/OLS step inherits consistency from the unbiased pseudo-values. revision: partial
-
Referee: [Simulation studies section] Simulation design evaluates performance only under data-generating processes that satisfy the independent-censoring assumption implicit in the influence-function derivation. Scenarios with covariate-dependent censoring or omitted censoring covariates would directly test whether bias appears in the regression coefficients when the weakest assumption is violated.
Authors: The referee correctly identifies that our current simulations maintain the independent-censoring assumption. We will add a new simulation scenario in which censoring depends on covariates (and an additional scenario with an omitted censoring covariate) to quantify the resulting bias in the regression coefficients. These results will be reported in a revised Table or supplementary figure, together with a short discussion of when the method remains reliable versus when the assumption is critical. revision: yes
Circularity Check
No circularity; standard application of influence-function pseudo-values to GEE/OLS
full rationale
The paper derives its estimator by first obtaining influence-function pseudo-values from the nonparametric MCF estimator at a fixed truncation time (standard construction under independent censoring), then treating those pseudo-values as outcomes in off-the-shelf GEE or OLS regression. No equation reduces the target regression parameters to a fitted quantity by construction, no self-citation chain is load-bearing for the central claim, and the method does not rename or smuggle an ansatz. The derivation is self-contained against external benchmarks of influence-function theory and GEE consistency.
Axiom & Free-Parameter Ledger
axioms (1)
- domain assumption Influence function for the MCF yields unbiased pseudo-values when censoring is independent conditional on covariates.
Reference graph
Works this paper leans on
-
[1]
Solomon, S., McMurray, J., Vaduganathan, M.,et al.Finerenone in Heart Failure with Mildly Reduced or Preserved Ejection Fraction.The New England Journal of Medicine391,1475– 1485 (2024)
2024
-
[2]
Anker,S., Friede,T.,vonBardeleben, R.-S.,et al.TranscatheterValveRepairinHeartFailure with Moderate to Severe Mitral Regurgitation.The New England Journal of Medicine391, 1799–1809 (2024)
2024
-
[3]
Bhatt, S., Rabe, K., Hanania, N.,et al.Dupilumab for COPD with Type 2 Inflammation Indicated by Eosinophil Counts.The New England Journal of Medicine389,205–214 (2023)
2023
-
[4]
Feuerstadt, P., Louie, T., Lashner, B.,et al.SER-109, an Oral Microbiome Therapy for Recurrent Clostridioides difficile Infection.The New England Journal of Medicine386,220– 229 (2022)
2022
-
[5]
Lamas, G., Anstrom, K., Navas-Acien, A.,et al.Edetate Disodium-Based Chelation for Pa- tients With a Previous Myocardial Infarction and Diabetes: TACT2 Randomized Clinical Trial.JAMA332,794–803 (2024)
2024
-
[6]
C., Lee, D
Austin, P. C., Lee, D. S. & Fine, J. P. Introduction to the Analysis of Survival Data in the Presence of Competing Risks.Circulation133,601–609 (2016)
2016
-
[7]
R.et al.Practical Recommendations on Quantifying and Interpreting Treatment Effects in the Presence of Terminal Competing Risks: A Review.JAMA Cardiology7,450– 456 (2022)
McCaw, Z. R.et al.Practical Recommendations on Quantifying and Interpreting Treatment Effects in the Presence of Terminal Competing Risks: A Review.JAMA Cardiology7,450– 456 (2022)
2022
-
[8]
L., Williams, B
Prentice, R. L., Williams, B. J. & Peterson, A. V. On the regression analysis of multivariate failure time data.Biometrika68,373–379 (1981)
1981
-
[9]
Andersen, P. K. & Gill, R. D. Cox’s regression model for counting processes: a large sample study.The Annals of Statistics,1100–1120 (1982)
1982
-
[10]
Wei, L.-J., Lin, D. Y. & Weissfeld, L. Regression analysis of multivariate incomplete failure time data by modeling marginal distributions.Journal of the American Statistical Association 84,1065–1073 (1989)
1989
-
[11]
Y., Wei, L.-J., Yang, I
Lin, D. Y., Wei, L.-J., Yang, I. & Ying, Z. Semiparametric regression for the mean and rate functions of recurrent events.Journal of the Royal Statistical Society: Series B (Statistical Methodology)62,711–730 (2000)
2000
-
[12]
& Lin, D
Ghosh, D. & Lin, D. Y. Marginal regression models for recurrent and terminal events.Sta- tistica Sinica,663–688 (2002)
2002
-
[13]
& Lin, D
Ghosh, D. & Lin, D. Nonparametric analysis of recurrent events and death.Biometrics56, 554–562 (2000)
2000
-
[14]
Claggett, B. L.et al.Quantifying Treatment Effects in Trials with Multiple Event-Time Outcomes.NEJM Evidence1,10.1056/evidoa2200047 (2022)
-
[15]
Gronsbell, J.et al.Nonparametric estimation of the total treatment effect with multiple outcomes in the presence of terminal events.Biometrics(2026)
2026
-
[16]
Sun, J., Wang, T., Yi, Y.,et al.Improve the Precision of Area Under the Curve Estimation for Recurrent Events Through Covariate Adjustment.Statistics in Medicine44,e70187 (2025). 18
2025
-
[17]
Andersen,P.,Klein,J.&Rosthoj,S.Generalisedlinearmodelsforcorrelatedpseudo-observations, with applications to multi-state models.Biometrika90,15–27 (2003)
2003
-
[18]
& Perme, M
Andersen, P. & Perme, M. Pseudo-observations in survival analysis.Stat Methods Med Res 19,71–99 (2010)
2010
-
[19]
Efron, B.The Jackknife, the Bootstrap and Other Resampling Plans(Society for Industrial and Applied Mathematics, Philadelphia, PA, 1982)
1982
-
[20]
Ocampo, A.et al.Simplifying Causal Mediation Analysis for Time-to-Event Outcomes using Pseudo-Values.arXiv(2024)
2024
-
[21]
& Ervin, L
Long, J. & Ervin, L. Using heteroscedasticity consistent standard errors in the linear regres- sion model.The American Statistician54,217–224 (2000)
2000
-
[22]
Montalban, X.et al.Efficacy and safety of ocrelizumab in primary progressive multiple scle- rosis: results of the Phase III double-blind, placebo-controlled ORATORIO Study (S49. 001). Neurology86,S49–001 (2016)
2016
-
[23]
Wolbers, M., Gómez, M. P., Ocampo, A. & Gravestock, I. Unified implementation and com- parison of Bayesian shrinkage methods for treatment effect estimation in subgroups.arXiv preprint arXiv:2603.21967(2026). 19
discussion (0)
Sign in with ORCID, Apple, or X to comment. Anyone can read and Pith papers without signing in.