REVIEW 4 major objections 5 minor 58 references
Spectroscopic Quasar Anomaly Detection (SQuAD) I: Rest-Frame UV Spectra from SDSS DR16
T0 review · 4 major / 5 minor · reviewed 2026-08-12 · deepseek-v4-flash
Pith's one-line read This paper claims that an automated spectral-clustering pipeline applied to rest-frame ultraviolet quasar spectra identifies 1,888 anomalous quasars in ten distinct groups, with physical causes tied to Eddington ratio and…
desk verdict A useful rare-quasar catalog that is undermined by unresolved count inconsistencies and threshold choices; worth refereeing after fixes. read the letter →
The pith
A machine-rendered reading of the paper's core claim, the machinery that carries it, and where it could break.
The reading
What carries the argument
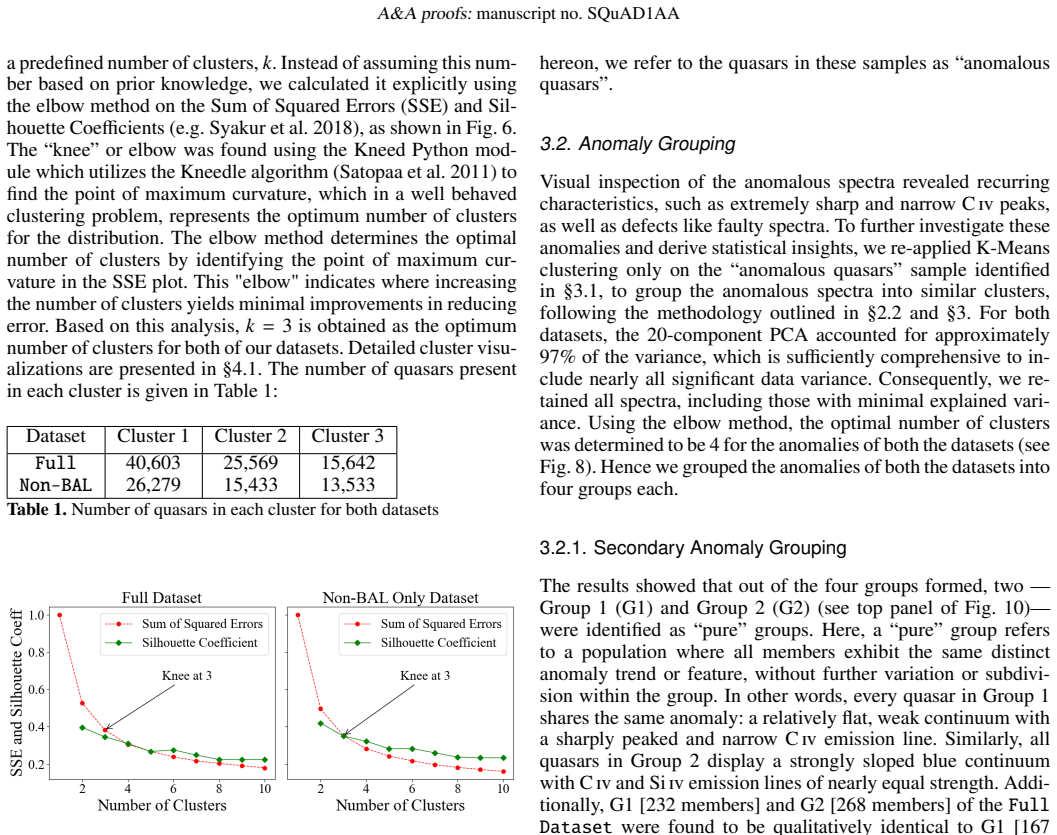
The load-bearing object is a 20-dimensional PCA coefficient space built from max-normalized, smoothed, resampled, and padded rest-frame spectra spanning 1250–3000 Å. Quasars are clustered with K-Means into three main clusters in that space; the cluster centroids encode mean spectral shapes, and the second PCA eigenvector carries most of the reddening information, so high PCA 2 coefficients mean redder spectra. Anomalies are declared as spectra whose Euclidean distance from their cluster centroid exceeds 5σ for clusters 1 and 2 and 4σ for cluster 3, thresholds chosen by visual inspection of the tail of the distance histograms. The flagged spectra are re-clustered, split by BAL probability, and re-clustered again to yield the ten final anomaly categories. The top 8% of spectra with the largest PCA reconstruction residuals are removed before the main clustering and handled separately.
What would settle it
Re-run the same pipeline on the same quasar sample while varying the sigma thresholds (e.g., 4σ versus 5σ for all clusters, or a fixed-percentile cut) and check whether the same ten groups emerge with stable memberships; if group membership shifts substantially, the anomaly classes are artifacts of the cut. Independently, measure Eddington ratios and broad-line-region metallicities for the flagged C IV Peakers and Excess Si IV emitters from X-ray and virial-mass data; if they match normal quasars, the paper's physical explanations fail.
Extended reading notes
Core claim
The central discovery is that unsupervised clustering in a 20-dimensional PCA coefficient space built from rest-frame 1250–3000 Å spectra separates quasar spectra into three main populations, and that objects far from their cluster centroids are not random noise but recurrent spectral types. Using a 5σ distance cut for two clusters and a 4σ cut for the third, the pipeline flags 1,994 outlier spectra in the full dataset and 1,270 in a BAL-free subset; the final catalog contains 1,888 anomalous quasars in ten groups. These are C IV Peakers, Excess Si IV emitters, Si IV Deficient objects, four broad-absorption-line subtypes (Blue BALs, Flat BALs, Reddened BALs, FeLoBALs), and three reddened non-BAL subtypes (Heavily Reddened, Moderately Reddened, and Plateau-shaped spectrum quasars). The paper attributes the C IV Peaker anomaly to lower Eddington ratios, the Excess Si IV group to super-solar broad-line-region metallicity, and the Si IV Deficient group to sub-solar metallicity, using line-ratio diagnostics and comparisons with a published quasar line catalog.
Load-bearing premise
The catalog's membership rests on the chosen sigma thresholds (5σ for two clusters, 4σ for the third) and on dropping the 8% of spectra that the model reproduces worst before clustering; if those choices shift, every group's size and composition changes.
Editorial extensions
If this is right
- The value-added catalog gives researchers a large, homogeneous sample of rare quasar spectra—1,888 objects in ten groups—for statistical studies of extreme line emission, BAL outflows, and dust reddening, instead of relying on single-object case studies.
- If the physical attributions are right, C IV Peakers bracket Weak-Line Quasars as the opposite end of an Eddington-ratio sequence, giving a target population for testing accretion-disk and ionizing-continuum models.
- The Excess Si IV and Si IV Deficient groups supply two broad-line-region metallicity extremes that can be used to map chemical enrichment across quasar populations.
- The deliberate separation of BAL and non-BAL samples demonstrates that removing a dominant outlier class before clustering exposes rarer anomaly types, a strategy that transfers to other large spectroscopic surveys.
- The pipeline's detection of BAL quasars missed by an existing BAL_PROB flag suggests anomaly screening can reveal incompleteness in standard BAL catalogs.
Reading between the lines
- Beyond the paper: the group boundaries probably depend on the chosen sigma thresholds and on the 8% reconstruction-residual cut, so a stability analysis across thresholds would tell whether the ten categories are robust or survey-specific.
- Beyond the paper: the physical explanations for C IV Peakers and Si IV anomalies are inferred from line-ratio arguments; direct X-ray, multi-epoch, or virial-mass measurements of flagged objects would test them.
- Beyond the paper: the same PCA-plus-K-Means recipe should transfer to optical spectra and to future surveys, where redshift windows and signal-to-noise distributions will require re-calibrating the anomaly thresholds.
Editorial analysis
A structured set of objections, weighed in public.
Referee Report
Summary. The manuscript applies PCA dimensionality reduction followed by hierarchical k-means clustering to 81,814 SDSS DR16 quasar spectra in the rest-frame 1250–3000 Å window, with and without BAL quasars. Objects at 5σ (clusters 1 and 2) or 4σ (cluster 3) from their cluster centroids are labeled anomalous, and a second k-means pass groups them into what the authors condense into ten anomaly classes: C IV Peakers, Excess Si IV emitters, Si IV Deficient anomalies, four BAL subtypes, and three reddened non-BAL subtypes. The physical discussion uses line measures from Wu & Shen (2022) and literature diagnostics to attribute the anomalies to low Eddington ratios, super-solar or sub-solar BLR metallicities, and dust reddening. The paper claims 1,888 anomalous quasars and presents them as a value-added catalog.
Significance. If the catalog is reproducible, this would be a genuinely useful resource: it is one of the largest classified collections of spectroscopically rare quasars, and the grouping into physically interpretable classes is a helpful starting point for follow-up. The pipeline is clearly described in broad strokes, the two-dataset strategy is sensible, and the comparisons to the Wu & Shen (2022) measurements and external calibrations (e.g., Fu et al. 2022; Hamann et al. 2002) are appropriate. The main risk is not circularity—the anomaly detection is unsupervised—but traceability: the catalog counts and membership depend on threshold choices, manual reassignments, and an incompletely documented reconstruction-outlier path. Those issues are correctable but must be addressed before the catalog can be used.
major comments (4)
- [§3.1, §6, Tables 2–4] The headline count of 1,888 anomalous quasars cannot be reproduced from the paper. Section 3.1 reports 1,994 anomalies in the Full Dataset and 1,270 in the Non-BAL Only Dataset. Table 2 gives per-cluster anomaly counts that sum to 1,479 (Full) and 978 (Non-BAL), while Table 3 gives anomaly-group counts that sum to 1,542 (Full) and 916 (Non-BAL); neither matches the anomaly totals. The final group counts listed in §6 sum to 1,653 (65 + 227 + 328 + 64 + 306 + 213 + 109 + 165 + 93 + 83), and §4.2.3 states that the BAL anomaly group has 672 members although Table 4 sums to 692. The percentages quoted in §4.2.1, §4.2.2, and §4.2.4 (3.4%, 11.3%, 16.4%) imply yet another total, close to 1,994. The central catalog claim therefore lacks a defined reconciliation. Please provide a membership-flow table with counts at every step—initial anomalies, reconstruction outliers, manual removals, manual reassignments, duplicates across the two datasets, and final group assignments—and use it to derive the number 1,888 explicitly.
- [§3.1, Fig. 7] The anomaly definition depends on sigma thresholds that were selected by visual inspection: 5σ for clusters 1 and 2 and 4σ for cluster 3, chosen because the tails look tapering or diffuse. No stability analysis is reported. Because every group count and the final catalog membership change if these thresholds are moved, the paper needs a quantitative robustness test—for example, a scan over thresholds with reported membership overlap or rank correlation, or an objective model for the tail of the distance distribution. This is not a cosmetic issue; it determines who is in the catalog.
- [§2.2–2.3, Eq. (2)] The reconstruction-outlier path is load-bearing but under-specified. The top 8th percentile of the residual-error distribution from Eq. (2) is removed before clustering; then a “simple algorithm” flags spectra with large flat regions; the remaining reconstruction outliers are clustered into three classes and “assigned to their appropriate classifications.” The paper never defines the flat-region algorithm, states how many spectra were discarded versus kept, or explains how this path contributes to the final 1,888 count. Since the preprocessing in §2.1 pads spectra with the trailing flux value, which can create flat sections, the boundary between genuine reddened/BAL anomalies and padding artifacts must be quantified. Please specify the algorithm, give the counts at each substep, and show where these objects appear in the final catalog.
- [§5.7, §4.2.2, §4.2.4] Several membership decisions are manual and undocumented. The C IV Peakers group is said to contain roughly 350 cosmic-ray contaminants that are removed by an unspecified equivalent-width/flux cut; §4.2.2 describes quasars that were “manually identified and reassigned” from the Excess Si IV group to BAL subgroups; §4.2.4 reports 18 leaked BALs that were “manually picked out”; and §5.7 states that other machine-error anomalies were “visually identified and discarded.” Each of these decisions changes the final group counts, yet no criteria, lists, or per-step counts are provided. The paper should make these steps reproducible, including a precise definition of the C IV EW/flux cut and the number of objects removed or reassigned at each stage. As written, a user cannot tell whether the 1,888 number includes or excludes any of these manually handled objects.
minor comments (5)
- [Table 5] The sample catalog row for SDSS J123015.99+062056.7 lists redshift z = 1.8512, which is outside the declared sample range 1.88 ≤ z ≤ 2.47. Please verify this entry and the redshift cut used in the catalog; if this is not a typo, the selection criterion needs correction.
- [§5.3] The statement that a Z/Z⊙ ≈ 0.4 metallicity is “nearly 40 times lower” than that of the Excess Si IV quasars is not supported by the preceding text, since the Excess Si IV group is described only as super-solar. Please state the assumed metallicities or calibrations used to derive this factor.
- [§4.2.1, Table 3] The text says the C IV Peaker group contains roughly 350 contaminant spectra, but Table 3 lists only 232 members in the Full Dataset group and 167 in the Non-BAL group. Please clarify whether the 350 refers to the pooled group before cuts, and state whether those contaminants are excluded from the final catalog or only from the physical interpretation.
- [§4.2.3] The BAL anomaly group is described as comprising 672 objects, while Table 4 lists 692 members across the four subtypes. Please correct this internal inconsistency and verify the associated percentage of all anomalies.
- [§6, throughout] There are several minor presentation issues: “Plateu” should be “Plateau” in the conclusion list; the element C IV is typeset inconsistently (C iv, Civ, CIV); and the abstract says the redshift range is 1.88 < z < 2.47 while §2 uses 1.88 ≤ z ≤ 2.47. These should be harmonized in the final version.
Circularity Check
No significant circularity: the anomaly detection is unsupervised and physical attributions rely on external calibrations; only minor non-load-bearing self-citations and a definitional reddening label are noted, plus an unreconciled headline count that is a transparency flaw rather than circularity.
full rationale
Score 2 reflects the absence of load-bearing circularity. The pipeline is unsupervised: PCA is fit to the full and non-BAL samples, K-means clusters the PCA coefficients, and anomalies are points beyond 5 sigma (4 sigma for cluster 3) from cluster centroids; no parameter is fitted to the anomaly sample and then renamed as a prediction. The group labels (C IV Peakers, Excess Si IV emitters, Si IV Deficient, BAL sub-types, reddened sub-types) are assigned after visual inspection of composite spectra, and the physical attributions rest on external diagnostics: Fu et al. (2022) for high C IV EW and Eddington ratio, Nagao et al. (2006) and Hamann et al. (2002) for Si IV/C IV metallicity, and Wu & Shen (2022) for EW/FWHM distributions. These are independent of the PCA/clustering inputs, so the central physical claims do not reduce to the paper's own construction. The only self-citations (Vivek et al. 2012a,b; Vivek et al. 2014) appear in introductory or contextual statements about quasar variability and LoBAL outflows and are not load-bearing. A minor definitional note: Section 2.2 states that the PCA 2 coefficient is directly proportional to reddening, and later sections describe subgroups as separated by degree of reddening via PCA 2 placement; this is partly labeling with the same feature, though the authors also compare against external reddening composites and observed spectral slopes. Per the review rule on flagged limitations, a separate transparency flaw is noted: the abstract's headline '1,888 anomalous quasars' is not reconciled with the body's '1994 and 1270 anomalies' in Section 3.1 or with the Section 6 group counts summing to 1,653; the omitted reconciliation prevents independent reproduction of the headline number but is not a circular argument.
Assumptions & free parameters
free parameters (7)
- sigma threshold for clusters 1 and 2 =
5 sigma
- sigma threshold for cluster 3 =
4 sigma
- reconstruction outlier percentile =
top 8th percentile
- primary cluster count k =
3
- anomaly group cluster count k =
4
- Savitzky-Golay smoothing window =
5 pixels
- BAL_PROB threshold =
0.5
assumptions (5)
- domain assumption Euclidean distance in 20-dimensional PCA space is a meaningful measure of spectral dissimilarity.
- domain assumption The elbow method identifies the true number of clusters.
- domain assumption SDSS DR16 redshifts are accurate enough for rest-frame alignment.
- domain assumption External line diagnostics calibrated on typical quasars transfer to these extreme objects.
- ad hoc to paper Padding spectra with the trailing flux value does not create clusters dominated by artifacts.
Cite this review
Pith. "Pith review of Spectroscopic Quasar Anomaly Detection (SQuAD) I: Rest-Frame UV Spectra from SDSS DR16." pith.science (2026). https://pith.science/paper/OCBHMKNH
@misc{pith2026241116858,
  author       = {Pith},
  title        = {Pith review of: Spectroscopic Quasar Anomaly Detection (SQuAD) I: Rest-Frame UV Spectra from SDSS DR16},
  year         = {2026},
  howpublished = {\url{https://pith.science/paper/OCBHMKNH}},
  note         = {Machine review of arXiv:2411.16858}
}
read the original abstract
We present the results of applying anomaly detection algorithms to a quasar spectroscopic sub-sample from the SDSS DR16 Quasar Catalog, covering the redshift range 1.88 < z < 2.47. Principal Component Analysis (PCA) was employed for dimensionality reduction of the quasar spectra, followed by hierarchical K-Means clustering in a 20-dimensional PCA eigenvector hyperspace. To prevent broad absorption line (BAL) quasars from being identified as the primary anomaly group, we conducted the analysis with and without them, comparing both datasets for a clearer identification of other anomalous quasar types. We identified 1,888 anomalous quasars, categorized into 10 broad groups. The anomalous groups include C IV Peakers-quasars with extremely strong and narrow C IV emission lines; Excess Si IV emitters-quasars where the Si IV line is as strong as the C IV line; and Si IV Deficient anomalies, which exhibit significantly weaker Si IV emission compared to typical quasars. The anomalous nature of these quasars is attributed to lower Eddington ratios for C IV Peakers, super-solar metallicity for Excess Si IV emitters, and sub-solar metallicity for Si IV Deficient anomalies. Additionally, we identified four groups of BAL anomalies: Blue BALs, Flat BALs, Reddened BALs, and FeLoBALs, distinguished primarily by the strength of reddening in these sources. Further, among the non-BAL quasars, we identified three types of reddened anomaly groups classified as heavily reddened, moderately reddened, and plateau-shaped spectrum quasars, each exhibiting varying degrees of reddening. The detected anomalies are presented as a value-added catalog.
Figures


Figures from the paper (11 more)




Reference graph
Works this paper leans on
-
[1]
Andonie, C., Alexander, D. M., Rosario, D., et al. 2022, Monthly Notices of the Royal Astronomical Society, 517, 2577
work page 2022
-
[2]
1993, Publications of the Astronomical Society of the Pacific, 105, 1032
Artymowicz, P. 1993, Publications of the Astronomical Society of the Pacific, 105, 1032
work page 1993
-
[3]
Becker, R. H., White, R. L., Gregg, M. D., et al. 2000, The Astrophysical Journal, 538, 72
work page 2000
-
[4]
Begelman, M. C., Blandford, R. D., & Rees, M. J. 1984, Rev. Mod. Phys., 56, 255
work page 1984
-
[5]
Bradley, P. S. & Fayyad, U. M. 1998, in International Conference on Machine Learning
work page 1998
-
[6]
Branch, D., Leighly, K. M., Thomas, R., & Baron, E. 2002, The Astrophysical Journal, 578, L37
work page 2002
-
[7]
Brotherton, M., Tran, H. D., Becker, R., et al. 2001, The Astrophysical Journal, 546, 775
work page 2001
-
[8]
Carnall, A. C. 2017, SpectRes: A Fast Spectral Resampling Tool in Python
work page 2017
Show all 58 references
-
[9]
M., Terndrup, D
Choi, H., Leighly, K. M., Terndrup, D. M., et al. 2022, ApJ, 937, 74
2022
-
[10]
2002, Astronomy & Astrophysics, 388, 771
Collin, S., Boisson, C., Mouchet, M., et al. 2002, Astronomy & Astrophysics, 388, 771
2002
-
[11]
M., Fan, X., Brandt, W., et al
Diamond-Stanic, A. M., Fan, X., Brandt, W., et al. 2009, The Astrophysical Jour- nal, 699, 782 D.Napoleon, S. 2011, International Journal of Computer Applications, 13, 41
2009
-
[12]
2010, The Astrophysical Journal, 717, 868
Farrah, D., Urrutia, T., Lacy, M., et al. 2010, The Astrophysical Journal, 717, 868
2010
-
[13]
J., Baldwin, J
Ferland, G. J., Baldwin, J. A., Korista, K. T., et al. 1996, The Astrophysical Journal
1996
-
[14]
2022, The Astrophysical Journal, 934, 97
Fu, S., Brandt, W., Zou, F., et al. 2022, The Astrophysical Journal, 934, 97
2022
-
[15]
J., Pulgarin-Duque, L., Anderson, S
Green, P. J., Pulgarin-Duque, L., Anderson, S. F., et al. 2022, The Astrophysical Journal, 933, 180
2022
-
[16]
D., Lacy, M., White, R
Gregg, M. D., Lacy, M., White, R. L., et al. 2002, The Astrophysical Journal, 564, 133
2002
-
[17]
& Martini, P
Guo, Z. & Martini, P. 2019, The Astrophysical Journal, 879, 72
2019
-
[18]
& Maraschi, L
Haardt, F. & Maraschi, L. 1991, ApJ, 380, L51
1991
-
[19]
B., Anderson, S
Hall, P. B., Anderson, S. F., Strauss, M. A., et al. 2002, The Astrophysical Journal Supplement Series, 141, 267
2002
-
[20]
J., Warner, C., & Baldwin, J
Hamann, F., Korista, K., Ferland, G. J., Warner, C., & Baldwin, J. 2002, The Astrophysical Journal, 564, 592
2002
-
[21]
L., Ross, N., et al
Hamann, F., Zakamska, N. L., Ross, N., et al. 2017, Monthly Notices of the Royal Astronomical Society, 464, 3431
2017
-
[22]
W., Jensen, T
Harris, D. W., Jensen, T. W., Suzuki, N., et al. 2016, AJ, 151, 155
2016
-
[23]
J., Gandy, A., & Mortlock, D
Henrion, M., Hand, D. J., Gandy, A., & Mortlock, D. J. 2013, Statistical Analysis and Data Mining: The ASA Data Science Journal, 6, 53
2013
-
[24]
C., Schmidt, G
Hines, D. C., Schmidt, G. D., Gordon, K. D., et al. 2001, The Astrophysical Journal, 563, 512
2001
-
[25]
F., Strauss, M
Hopkins, P. F., Strauss, M. A., Hall, P. B., et al. 2004, The Astronomical Journal, 128, 1112
2004
-
[26]
& Blaes, O
Koratkar, A. & Blaes, O. 1999, PASP, 111, 1
1999
-
[27]
M., Cales, S., Moran, E
LaMassa, S. M., Cales, S., Moran, E. C., et al. 2015, ApJ, 800, 144
2015
-
[28]
Liu, Z. et al. 2011, Procedia Environmental Sciences, 11, 256
2011
-
[29]
W., Higley, A
Lyke, B. W., Higley, A. N., McLane, J. N., et al. 2020, The Astrophysical Journal Supplement Series, 250, 8
2020
-
[30]
1996, Astrophysical Journal Supplement v
Marziani, P., Sulentic, J., Dultzin-Hacyan, D., Calvani, M., & Moles, M. 1996, Astrophysical Journal Supplement v. 104, p. 37, 104, 37
1996
-
[31]
Menou, K., Berk, D. E. V ., Ivezi ´c, Ž., et al. 2001, The Astrophysical Journal, 561, 645
2001
-
[32]
2012, Astronomy & Astro- physics, 541, A77
Meusinger, H., Schalldach, P., Scholz, R.-D., et al. 2012, Astronomy & Astro- physics, 541, A77
2012
-
[33]
2006, Astronomy & Astrophysics, 447, 157
Nagao, T., Marconi, A., & Maiolino, R. 2006, Astronomy & Astrophysics, 447, 157
2006
-
[34]
R., Long, D
Newman, P. R., Long, D. C., Snedden, S. A., et al. 2004, in Ground-based In- strumentation for Astronomy, V ol. 5492, SPIE, 533–544
2004
-
[35]
2022, Monthly Notices of the Royal Astro- nomical Society, 511, 5251
Ni, Q., Brandt, W., Luo, B., et al. 2022, Monthly Notices of the Royal Astro- nomical Society, 511, 5251
2022
-
[36]
2018, Monthly Notices of the Royal Astro- nomical Society, 480, 5184
Ni, Q., Brandt, W., Luo, B., et al. 2018, Monthly Notices of the Royal Astro- nomical Society, 480, 5184
2018
-
[37]
Peterson, B. M. 1997, Taxonomy of Active Galactic Nuclei (Cambridge Univer- sity Press), 21–31
1997
-
[38]
M., Anderson, S
Plotkin, R. M., Anderson, S. F., Hall, P. B., et al. 2008, The Astronomical Journal, 135, 2453
2008
-
[39]
2021, The Astrophysical Journal Supplement Series, 253, 28
Rakshit, S., Stalin, C., Kotilainen, J., & Shin, J. 2021, The Astrophysical Journal Supplement Series, 253, 28
2021
-
[40]
2021, Astronomy and Computing, 34, 100437
Reis, I., Rotman, M., Poznanski, D., Prochaska, J., & Wolf, L. 2021, Astronomy and Computing, 34, 100437
2021
-
[41]
T., Hall, P
Richards, G. T., Hall, P. B., Berk, D. E. V ., et al. 2003, The Astronomical Journal, 126, 1131
2003
-
[42]
P., Hamann, F., Zakamska, N
Ross, N. P., Hamann, F., Zakamska, N. L., et al. 2015, MNRAS, 453, 3932 Sánchez Almeida, J., Aguerri, J. A. L., Muñoz-Tuñón, C., & de Vicente, A. 2010, ApJ, 714, 487 Article number, page 17 of 20 A&A proofs: manuscript no. SQuAD1AA
2015
-
[43]
2011, in 2011 31st interna- tional conference on distributed computing systems workshops, IEEE, 166– 171
Satopaa, V ., Albrecht, J., Irwin, D., & Raghavan, B. 2011, in 2011 31st interna- tional conference on distributed computing systems workshops, IEEE, 166– 171
2011
-
[44]
& Golay, M
Savitzky, A. & Golay, M. J. E. 1964, Analytical Chemistry, 36, 1627
1964
-
[45]
Shakura, N. I. & Sunyaev, R. A. 1973, A&A, 24, 337
1973
-
[46]
2022, Astronomy & Astrophysics, 668, A121
Shao, Y ., Wang, R., Weiss, A., et al. 2022, Astronomy & Astrophysics, 668, A121
2022
-
[47]
Shen, Y . & Ho, L. C. 2014, Nature, 513, 210
2014
-
[48]
A., Gunn, J
Smee, S. A., Gunn, J. E., Uomoto, A., et al. 2013, The Astronomical Journal, 146, 32
2013
-
[49]
M., et al
Solarz, A., Thomas, R., Montenegro-Montes, F. M., et al. 2020, A&A, 642, A103
2020
-
[50]
K., Rochman, E., & Satoto, B
Syakur, M., Khotimah, B. K., Rochman, E., & Satoto, B. D. 2018, in IOP con- ference series: materials science and engineering, V ol. 336, IOP Publishing, 012017
2018
-
[51]
R., Hall, P
Trump, J. R., Hall, P. B., Reichard, T. A., et al. 2006, The Astrophysical Journal Supplement Series, 165, 1 Vanden Berk, D. E., Richards, G. T., Bauer, A., et al. 2001, AJ, 122, 549
2006
-
[52]
2014, MNRAS, 440, 799
Vivek, M., Srianand, R., Petitjean, P., et al. 2014, MNRAS, 440, 799
2014
-
[53]
2019, Proceedings of the International Astronomical Union, 15, 285
Wethers, C., Kotilainen, J., Schramm, M., & Schulze, A. 2019, Proceedings of the International Astronomical Union, 15, 285
2019
-
[54]
& Combes, F
Wiklind, T. & Combes, F. 1996, Nature, 379, 139
1996
-
[55]
C., Vanden Berk, D
Wilhite, B. C., Vanden Berk, D. E., Kron, R. G., et al. 2005, ApJ, 633, 638
2005
-
[56]
& Shen, Y
Wu, Q. & Shen, Y . 2022, The Astrophysical Journal Supplement Series, 263, 42
2022
-
[57]
Xiong, L., Poczos, B., Connolly, A., & Schneider, J. 2018
2018
-
[58]
A., Telfer, R
Zheng, W., Kriss, G. A., Telfer, R. C., Grimes, J. P., & Davidsen, A. F. 1997, The Astrophysical Journal, 475, 469 Article number, page 18 of 20 Arihant Tiwari and M. Vivek: Spectroscopic Quasar Anomaly Detection (SQuAD) The PCA Eigenvectors for the primary K-Means clustering ...
2001
Reviewed August 12, 2026 · model on record in the stance chip above.
Discussion (0). Continue with ORCID to comment.