REVIEW 3 major objections 3 minor 39 references
Merging galaxies and clusters: Insights into the role of magnetic fields and the physics of radio relics
T0 review · 3 major / 3 minor · reviewed 2026-08-02 · deepseek-v4-flash
Pith's one-line read This dissertation argues that magnetic fields are essential for realistic cosmological simulations of disc-galaxy mergers, and that a shock-collision mechanism can explain four of the seven outstanding puzzles about radio relics in galaxy c
desk verdict Solid, novel merger MHD results; the radio-relic 'solutions' rest on injected turbulence parameters that need independent grounding before the claims carry weight. read the letter →
The pith
A machine-rendered reading of the paper's core claim, the machinery that carries it, and where it could break.
The reading
What carries the argument
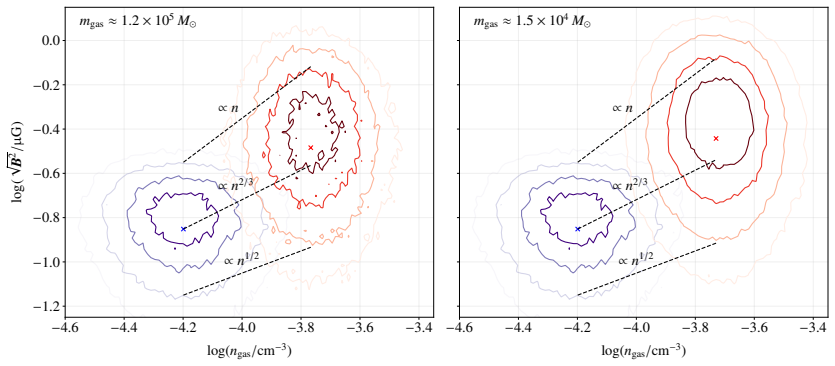
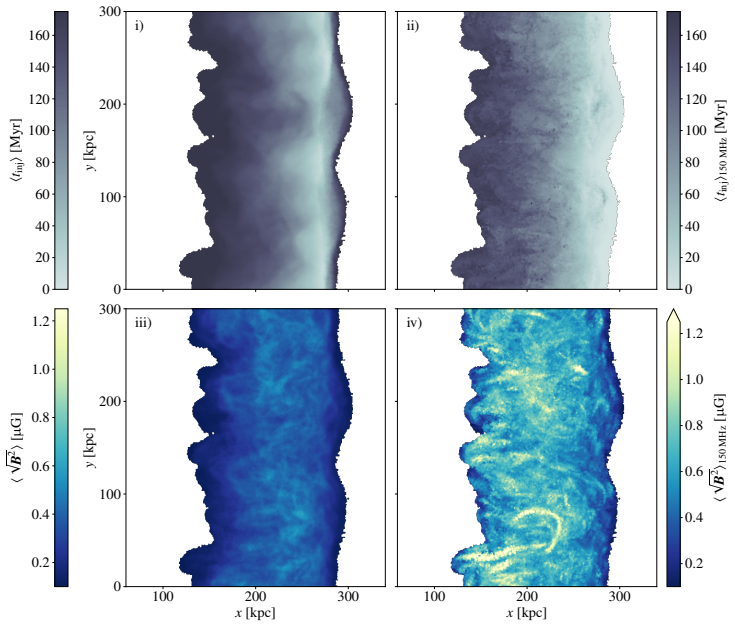
Small-scale dynamo: turbulent stretching, twisting, and folding of magnetic field lines amplifies a weak seed field exponentially, but only if the simulation resolves the turbulent eddies; this is the mechanism that turns magnetic fields from a passive tracer into a dynamically important component in merger remnants. Shock-collision sheet: a merger shock hitting an accretion shock produces a thin, dense, shock-compressed sheet; as it propagates into upstream density fluctuations, it generates a distribution of Mach numbers, corrugates the shock front, and drives a Rayleigh-Taylor instability. This sheet scenario is the device through which the work connects upstream ICM turbulence to the obs
What would settle it
Measure the density fluctuation statistics in the ICM immediately upstream of a radio relic in X-ray observations; if the relative variance, spectral slope, and injection scale differ substantially from the values used in the shock-tube runs, the predicted Mach-number distribution and spectral flattening would not reproduce relic observations. On the galaxy side, re-running the highest-resolution merger simulations with a more diffusive MHD scheme (or with a different divergence-control treatment) would test whether the morphology divergence depends on the dynamo's numerical amplification rath
Extended reading notes
Core claim
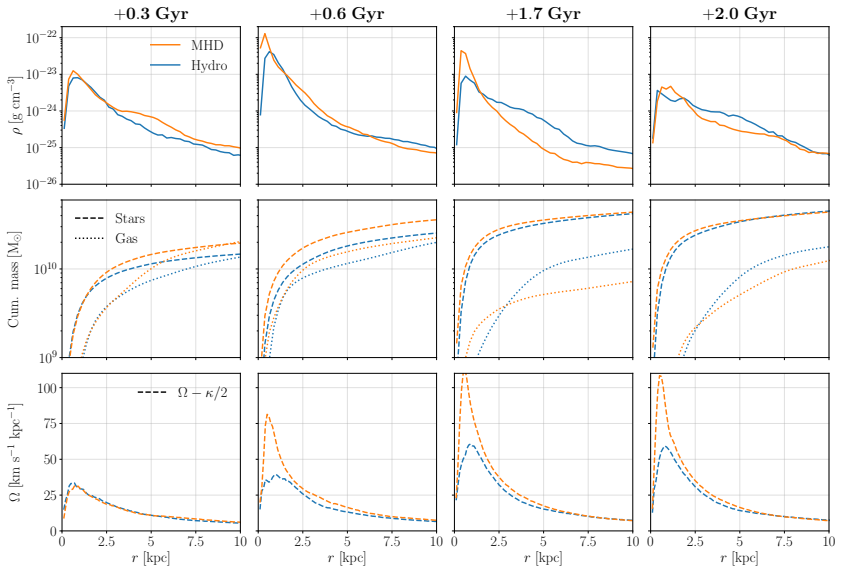
In cosmologically consistent zoom-in simulations of gas-rich major galaxy mergers, including ideal magnetohydrodynamics changes the outcome: MHD remnants form extended discs with flocculent spiral structure, whereas hydrodynamic twins form compact remnants with bar-and-ring morphologies rarely seen in observations. The divergence appears only at the highest resolution studied, which the author attributes to a small-scale dynamo that amplifies the magnetic field enough to modify angular-momentum transport, resonances, stellar feedback, and subsequent gas accretion. For radio relics, the thesis claims that when a merger shock collides with an accretion shock it creates a thin dense sheet that
Load-bearing premise
The radio-relic solution rests on the assumption that the unresolved upstream density fluctuations injected into the idealised shock-tube runs faithfully represent the density fluctuations that real merger shocks encounter in the intracluster medium; the galaxy-merger conclusion, meanwhile, leans on attributing the resolution-dependent morphology divergence to a physical small-scale dynamo rather than a resolution-dependent numerical artifact.
Editorial extensions
If this is right
- Galaxy merger simulations that ignore magnetic fields or run at insufficient resolution will systematically mispredict remnant morphology, producing bar-and-ring systems that are rare among observed galaxies.
- The resolution threshold for the small-scale dynamo explains why previous idealised merger simulations saw little magnetic effect: the dynamo must be resolved to become dynamically relevant.
- Radio relics should be expected to show a distribution of Mach numbers and a corrugated shock front, with upstream density fluctuations as a key controlling parameter of their morphology.
- Radio-derived Mach numbers of relics are systematically biased high relative to X-ray-derived values because the two probes track different parts of the Mach-number distribution.
- The high-Mach tail, not the mean, dominates radio emission, so relics can be observed in shocks with mean X-ray Mach numbers below the critical value near 2.3.
Reading between the lines
- If upstream density fluctuation statistics (relative variance, power-law slope, injection scale) are themselves set by cluster accretion and turbulence, then relic morphology becomes a diagnostic of ICM turbulence rather than a free parameter; the shock-tube runs place the weight of the explanation on those inputs.
- The merger result implies that magnetic fields could be a hidden variable in galaxy evolution studies generally, potentially affecting the disc-rebuilding histories of galaxies with quiescent as well as violent merger histories.
- The sheet-collision scenario predicts testable relations between spectral-index variations in relics and the density fluctuation spectrum of the ICM, which high-resolution spectral-index maps could confirm or reject.
- If laminar cooling models are invalid behind the shock, existing estimates of electron cooling times and re-acceleration scenarios for relics may need revision.
Editorial analysis
A structured set of objections, weighed in public.
Referee Report
Summary. This dissertation presents two related but largely independent studies. The first (Chs. 3-4) uses AREPO/Auriga cosmological zoom-in simulations to compare hydrodynamical and MHD realizations of four major disc-galaxy mergers. The central claim is that magnetic fields qualitatively change the merger remnant: MHD remnants regrow extended, flocculent discs, while hydro-only twins form compact bar-and-ring remnants. The authors argue that this is due to a small-scale dynamo that can develop only at sufficient resolution, and that magnetic fields alter angular-momentum transport, subsequent resonances, and feedback. The second study (Chs. 5-6) addresses radio relics. Using cluster zoom-in simulations to identify merger-shock/accretion-shock collisions, the authors build idealized shock-tube runs with injected upstream density fluctuations. They report that this produces a distribution of Mach numbers, shock corrugation, and a Rayleigh-Taylor instability, which they argue flattens cosmic-ray electron spectra, biases radio-derived Mach numbers high, compresses fields to microgauss strengths, breaks laminar cooling assumptions, and makes the high-Mach tail dominate emission. The abstract and conclusions claim that this solves four of seven outstanding problems in radio-relic physics.
Significance. If the merger result holds, it is a substantial step: it would imply that magnetic fields are not a passive tracer but a required ingredient for realistic simulations of gas-rich galaxy mergers, with observable morphological consequences. The controlled comparison of hydro and MHD runs from identical initial conditions, the resolution study, the divergence-error monitoring, and the use of a cosmologically consistent galaxy formation model are genuine strengths. The radio-relic study is also significant in proposing a unified physical scenario - merger shocks colliding with accretion shocks and propagating into upstream turbulence - that could explain several observed relic properties. The use of cosmological simulations to set shock conditions and of CREST/CRAYON+ to make mock observables is a methodological advance. However, the radio-relic conclusions are conditional on an imposed, not measured, upstream fluctuation spectrum, and the merger conclusions rest on four single realizations with the morphological divergence appearing only at the highest resolution. Both parts contain interesting, plausible physics, but the strength of the claims currently exceeds what the evidence esta
major comments (3)
- [§1.2, §5.2.3, Ch. 6] The radio-relic results are steered by the injected upstream density fluctuation spectrum. §1.2 states that the shock-tube runs include 'unresolved upstream density fluctuations', and §5.2.3 constructs them from a chosen relative variance, power-law slope, and injection scale. Chapter 6 then shows that the relative variance primarily sets the Mach-number distribution and relic morphology. Because the four claimed 'solved' problems (radio/X-ray Mach mismatch, microgauss fields, laminar-cooling failure, high-Mach-tail dominance) are all governed by this distribution and the resulting corrugation/RT instability, the conclusions are conditional on an input that is neither measured in the cluster zoom-ins nor pinned by ICM observations. The word 'unresolved' in the abstract highlights that the fluctuations are imposed, not resolved. I ask the authors to either calibrate the variance/slope/inj
- [§3.3.3, Table 3.2] The claim that 'magnetic fields are thus essential for the accurate simulation of disc galaxies' rests on four major-merger scenarios, each run once. The morphological divergence appears only at the highest resolution; at lower resolution hydro and MHD look similar. While a resolution study is present, it does not by itself establish that the divergence is caused by a physical small-scale dynamo rather than a resolution-dependent numerical artifact: the highest-resolution point is the only one showing the effect, with no convergence test across multiple resolutions in the divergence regime. Moreover, a single realization per scenario cannot exclude merger-orbit stochasticity as the cause. I recommend adding or reporting at least one additional independent initial condition per scenario, or explicit convergence/dynamo evidence at the highest resolution, before drawing the general conclusi
- [§5.4, §8.2] The manuscript states that the model 'solves four of the seven outstanding problems' (abstract; Ch. 8). The simulations demonstrate a plausible mechanism, but the comparison to observations is qualitative: no quantitative fit or statistical test is shown between the predicted radio/X-ray Mach distribution, spectral-index variation, or relic morphology and a specific observed relic sample. In addition, the CREST/CRAYON+ post-processing prescriptions (electron injection, critical Mach number) enter the emission maps, so the 'solution' is not derived from first principles. I ask the authors to state explicitly what is demonstrated - a mechanism consistent with existing observations - and what additional evidence would be required to claim a solution, or to provide such a quantitative comparison.
minor comments (3)
- [General] The thesis is a compilation of published/submitted papers, and the two parts are not strongly integrated. A short unified discussion of systematics - especially how the unresolved ICM turbulence injected in the shock tubes relates to the cosmological simulations used elsewhere - would improve cohesion.
- [Abstract / Ch. 6] The notation 'MX-ray = 2' and 'Mcrit = 2, 3' in the abstract is garbled; please use consistent symbols (e.g., M_X-ray, M_crit) and correct the rendering.
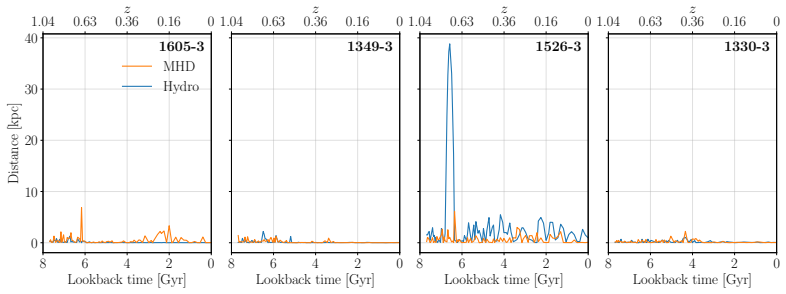
- [Figures 3.3-3.4] The relative divergence error is defined only in the text loosely; please define it explicitly in the figure captions or text, including the normalization used for the plotted quantity.
Circularity Check
Radio-relic 'solved problems' reduce to the injected upstream density-fluctuation spectrum: the Mach number distribution is set by the chosen relative variance.
-
fitted input called prediction
[§1.2 Structure of the thesis (description of Ch. 6); see also Ch. 6 and Abstract's 'We hence solve four of the seven outstanding problems']
"varying the relative variance, power law slope, and the injection scale of the upstream density turbulence. In doing so, we are able to show that it is primarily the relative variance that sets the Mach number distribution and impacts the radio relic morphology."
The thesis's headline radio-relic results—the Mach-number distribution, the radio/X-ray Mach bias, microgauss fields, the breakdown of laminar cooling, and the high-Mach-tail dominance—are presented as solving four outstanding problems. But the upstream density fluctuation spectrum is an injected input to the shock-tube runs, not a measured quantity. The text states that the relative variance of the injected turbulence 'sets the Mach number distribution.' Because the fluctuations are described as 'unresolved,' they are imposed rather than resolved from the cluster zoom-in simulations or pinned by ICM observations. Unless that variance, slope, and injection scale are independently constrained, the predicted Mach distribution—and hence the radio/X-ray discrepancy 'explanation' and the other
full rationale
The galaxy-merger half of the thesis is not circular: it is a controlled numerical experiment comparing MHD and hydrodynamic zoom-ins from identical initial conditions, with the morphological outcome tested against observed galaxy properties and a resolution study. The radio-relic half, however, contains a partial circularity. The shock-tube simulations are set up by injecting upstream density fluctuations with a chosen relative variance, power-law slope, and injection scale. Chapter 6 explicitly says the relative variance 'sets the Mach number distribution,' and the Mach-number distribution is the physical quantity that drives the radio/X-ray discrepancy, the dominance of the high-Mach tail, and the other claimed solved problems. Since the fluctuations are called 'unresolved,' they are not measured from the cosmological simulations; they are free inputs. Thus the central radio-relic 'predictions' are consequences of the chosen input spectrum rather than independently derived results. This is a conditional circularity: if the fluctuation parameters were later fixed by observations or resolved simulations, the explanation would become a genuine prediction. As it stands, the radio-relic claims are partially circular, while the galaxy-merger claims are self-contained. Score 6 reflects this partial, input-driven circularity in one of the two central theses.
Assumptions & free parameters
free parameters (4)
- Seed magnetic field strength and orientation =
1e-14 G (comoving), z-aligned
- Upstream density fluctuation properties in shock-tube runs (relative variance, power-law slope, injection scale) =
Not stated in available text; varied in Ch. 6
- Auriga subgrid parameters (n_SF = 0.13 cm^-3, wind normalization, feedback coupling) =
Inherited from Grand et al. (2017), not retuned
- CREST/CRAYON+ spectral and emission prescriptions =
Not stated in available text
assumptions (6)
- domain assumption Lambda-CDM cosmology with WMAP-9/Planck parameters underlies the initial conditions
- domain assumption Ideal MHD with Powell 8-wave divergence control adequately captures galactic/cluster field dynamics
- domain assumption The Auriga subgrid model (Springel-Hernquist ISM, stochastic star formation, wind and BH feedback) is adequate for merger-remnant morphology
- ad hoc to paper Shock-tube runs with injected unresolved density fluctuations reproduce the essential physics of merger-shock/accretion-shock collisions at relic radii
- domain assumption The critical Mach number M_crit ≈ 2.3 below which cosmic-ray electron acceleration is inefficient (Kang et al. 2019) is correct
- ad hoc to paper The resolution at which morphological divergence appears corresponds to the physical small-scale dynamo, not a numerical artifact
Cite this review
Pith. "Pith review of Merging galaxies and clusters: Insights into the role of magnetic fields and the physics of radio relics." pith.science (2026). https://pith.science/paper/OKJVE5CK
@misc{pith2026260714426,
  author       = {Pith},
  title        = {Pith review of: Merging galaxies and clusters: Insights into the role of magnetic fields and the physics of radio relics},
  year         = {2026},
  howpublished = {\url{https://pith.science/paper/OKJVE5CK}},
  note         = {Machine review of arXiv:2607.14426}
}
abstract
Mergers have long been understood to be a driver of galaxy and galaxy cluster evolution. They release tremendous amounts of gravitational potential energy - ~$10^{59}$ and ~$10^{64}$ ergs in galaxies and clusters, respectively - which is dissipated in powerful shock waves. In galaxies especially, the strong tidal effects can have profound effects on the remnant morphology. Although the modelling of mergers has a long history, it is only recently that it has been fully appreciated just how sensitive they are to a range of factors, including the existence of circumgalactic media (CGM), accretion along filaments, and pre-existing magnetic fields. Modelling these aspects in a cosmologically-consistent manner necessitates the use of high-resolution cosmological magnetohydrodynamic (MHD) simulations. In this work, we use such simulations to investigate two distinct merger-related phenomena: i) magnetic fields in galaxy mergers, and ii) the origin of radio relics in galaxy clusters.
Figures


Figures from the paper (76 more)








Reference graph
Works this paper leans on
-
[1]
Abadi, M. G., Navarro, J. F., Steinmetz, M., and Eke, V. R. (2003). Simulations of Galaxy Formation in aΛ Cold Dark MatterUniverse.II.TheFineStructureofSimulatedGalactic Disks.ApJ, , 597(1):21–34. Abbott, B. P., Abbott, R., Abbott, T. D., et al. (2016). Ob- servation of Gravitational Waves from a Binary Black Hole Merger.Phys. Rev. Lett., , 116(6):061102....
arXiv 2003
-
[5]
Thomas, T., Pfrommer, C., and Enßlin, T. (2020). Probing Cosmic-Ray Transport with Radio Synchrotron Harps in the Galactic Center.ApJ, , 890(2):L18. Thomas, T., Pfrommer, C., and Pakmor, R. (2023).Cosmic-ray- driven galactic winds: transport modes of cosmic rays and Alfvén-wave dark regions.MNRAS, , 521(2):3023–3042. Thomas, T., Pfrommer, C., and Pakmor, ...
2020
-
[9]
Lee, W., Pillepich, A., ZuHone, J., et al
AJ, , 145(3):69. Lee, W., Pillepich, A., ZuHone, J., et al. (2024).Radio relics in massive galaxy cluster mergers in the TNG-Cluster simula- tion.A&A, , 686:A55. 216 Leite, N., Evoli, C., D’Angelo, M., et al. (2017).Do cosmic rays heat the early intergalactic medium?MNRAS, , 469(1):416–
2024
-
[18]
Zeldovich, Y. B. (1972).Ahypothesis,unifyingthestructureand the entropy of the Universe.MNRAS, , 160:1P. Zhang, C., Churazov, E., Dolag, K., Forman, W. R., and Zhu- ravleva, I. (2020a).Collision of mergerand accretion shocks: formation of Mpc-scale contact discontinuity in the Perseus cluster.MNRAS, , 498(1):L130–L134. Zhang, C., Churazov, E., Forman, W. ...
1972
-
[32]
Steenbeck, M., Krause, F., and Rädler, K
MNRAS, , 328(3):726–750. Steenbeck, M., Krause, F., and Rädler, K. H. (1966).Berech- nung der mittleren Lorentz-Feldstärke für ein elektrisch lei- tendes Medium in turbulenter, durch Coriolis-Kräfte beein- flußterBewegung.ZeitschriftNaturforschungTeilA ,,21:369. Stein, Y., Dettmar, R. J., Beck, R., et al. (2020).CHANG-ES. XXI. Transport processes and the ...
1966
-
[132]
K., Werner, N., et al
Bagchi, J., Sirothia, S. K., Werner, N., et al. (2011).Discov- ery of the First Giant Double Radio Relic in a Galaxy Clus- ter Found in the Planck Sunyaev-Zel’dovich Cluster Survey: PLCK G287.0+32.9.ApJ, , 736(1):L8. Balbus, S. A. and Hawley, J. F. (1991).A Powerful Local Shear Instability in Weakly Magnetized Disks. I. Linear Analysis. ApJ, , 376:214. Ba...
2011
-
[142]
Schleicher, D. R. G., Schober, J., Federrath, C., Bovino, S., and Schmidt, W. (2013).The small-scale dynamo: breaking uni- versality at high Mach numbers. New Journal of Physics, , 15(2):023017. Schlickeiser,R.(1989). Cosmic-RayTransportandAcceleration. I.DerivationoftheKineticEquationandApplicationtoCos- mic Rays in Static Cold Media.ApJ, , 336:243. Schl...
2013
-
[194]
The Power of Faraday Tomography
The intra-cluster mag- netic field power spectrum.A&A, , 603:A122. Grand, R. J. J., Bustamante, S., Gómez, F. A., et al. (2018).Ori- gin of chemically distinct discs in the Auriga cosmological simulations.MNRAS, , 474(3):3629–3639. Grand, R. J. J., Gómez, F. A., Marinacci, F., et al. (2017).The Auriga Project: the properties and formation mechanisms of di...
2018
Show all 39 references
-
[220]
McCourt, M., O’Leary, R
MN- RAS, , 447(2):1103–1111. McCourt, M., O’Leary, R. M., Madigan, A.-M., and Quataert, E. (2015).Magnetizedgascloudscansurviveaccelerationby a hot wind.MNRAS, , 449(1):2–7. 217 McDonald, M., Allen, S. W., Bayliss, M., et al. (2017).The Re- markableSimilarityofMassiveGalaxyClu...
2015
-
[267]
A MultifrequencyViewoftheRadioPhoenixintheA85Cluster
Raja,R.,Rahaman,M.,Datta,A.,andSmirnov,O.M.(2024a). A MultifrequencyViewoftheRadioPhoenixintheA85Cluster . ApJ, , 975(1):125. Raja, R., Smirnov, O. M., Venturi, T., Rahaman, M., and Yang, H.Y.K.(2024b). uGMRTSub-GHzViewoftheSausageClus- ter Diffuse Radio Sources.ApJ, , 977(1):...
2018
-
[305]
Attia,O.,Teyssier,R.,Katz,H.,etal.(2021)
Cambridge University Press. Attia,O.,Teyssier,R.,Katz,H.,etal.(2021). Cosmologicalmag- netogenesis: theBiermannbatteryduringtheEpochofreion- ization.MNRAS, , 504(2):2346–2359. Axford,W.I.,Leer,E.,andSkadron,G.(1977). TheAcceleration ofCosmicRaysbyShockWaves .In InternationalCo...
2021
-
[315]
Krymskii, G. F. (1977). A regular mechanism for the accel- eration of charged particles on the front of a shock wave. Akademiia Nauk SSSR Doklady,, 234:1306–1308. Kuhn, V., Guo, Y., Martin, A., et al. (2024).JWST Reveals a Surprisingly High Fraction of Galaxies Being Spiral-li...
1977
-
[333]
Feretti, L., Giovannini, G., Govoni, F., and Murgia, M. (2012). Clusters of galaxies: observational properties of the diffuse radio emission.A&A Rev., , 20:54. Ferland, G. J., Korista, K. T., Verner, D. A., et al. (1998). CLOUDY 90: Numerical Simulation of Plasmas and Their Sp...
2012
-
[335]
(1998).TheGlobalSchmidtLawinStar- forming Galaxies.ApJ, , 498(2):541–552
Kennicutt, Robert C., J. (1998).TheGlobalSchmidtLawinStar- forming Galaxies.ApJ, , 498(2):541–552. Kennicutt, Robert C., J. and De Los Reyes, M. A. C. (2021).Re- visitingtheIntegratedStarFormationLaw.II.Starburstsand the Combined Global Schmidt Law.ApJ, , 908(1):61. Kereš, D.,...
1998
-
[401]
and Toomre, J
Toomre, A. and Toomre, J. (1972).Galactic Bridges and Tails. ApJ, , 178:623–666. Torrey, P., Cox, T. J., Kewley, L., and Hernquist, L. (2012). The Metallicity Evolution of Interacting Galaxies. ApJ, , 746(1):108. Tóth, G. (2000). The r· B=0 Constraint in Shock-Capturing Magnet...
1972
-
[424]
M., White, S
Li, C., Kauffmann, G., Heckman, T. M., White, S. D. M., and Jing, Y. P. (2008).Interactions, star formation and AGN ac- tivity.MNRAS, , 385(4):1915–1922. Li, H., Vogelsberger, M., Bryan, G. L., et al. (2022).Formation and evolution of young massive clusters in galaxy mergers: ...
2008
-
[526]
and Jones, T
Pfrommer, C. and Jones, T. W. (2011).Radio Galaxy NGC 1265 UnveilstheAccretionShockOntothePerseusGalaxyCluster . ApJ, , 730(1):22. 219 Pfrommer, C., Pakmor, R., Schaal, K., Simpson, C. M., and Springel,V.(2017a). Simulatingcosmicrayphysicsonamov- ing mesh.MNRAS, , 465(4):4500–...
2011
-
[641]
Beduzzi, L., Vazza, F., Cuciti, V., et al
Springer Science. Beduzzi, L., Vazza, F., Cuciti, V., et al. (2024).Cosmological simulations of the generation of cluster-scale radio emission from turbulent re-acceleration.A&A, , 690:A67. Bell, A. R. (1978a).The acceleration of cosmic rays in shock fronts - I.MNRAS, , 182:14...
2024
-
[930]
S., Niemiec, J., Amano, T., and Kobzar, O
Boula, S. S., Niemiec, J., Amano, T., and Kobzar, O. (2024). Quasi-perpendicular shocks of galaxy clusters in hybrid ki- netic simulations. The structure of the shocks . A&A, , 684:A129. Boulares, A. and Cox, D. P. (1990).Galactic Hydrostatic Equi- librium with Magnetic Tensio...
2024 arXiv
-
[1006]
Wittor, D., Brüggen, M., Grete, P., and Rajpurohit, K
MNRAS, , 499(2):2785–2802. Wittor, D., Brüggen, M., Grete, P., and Rajpurohit, K. (2023). Amorphologicalanalysisofthesubstructuresinradiorelics . MNRAS, , 523(1):701–719. Wittor, D., Ettori, S., Vazza, F., et al. (2021a).Exploring the spectral properties of radio relics - I: i...
2023
-
[1012]
Butcher-Oemler
Burns, J. O., Hallman, E. J., Gantner, B., Motl, P. M., and Nor- man, M. L. (2008).WhyDoOnlySomeGalaxyClustersHave Cool Cores?ApJ, , 675(2):1125–1140. Bustamante, S., Ellison, S. L., Patton, D. R., and Sparre, M. (2020). Galaxy pairs in the Sloan Digital Sky Survey - XIV. Gala...
2008
-
[1027]
T., Chyży, K
Drzazga, R. T., Chyży, K. T., Jurusik, W., and Wiórkiewicz, K. (2011).Magneticfieldevolutionininteractinggalaxies .A&A, , 533:A22. Dubois, Y. and Teyssier, R. (2010).Magnetised winds in dwarf galaxies.A&A, , 523:A72. Dumke, M., Krause, M., Wielebinski, R., and Klein, U. (1995)...
2011
-
[1068]
Luo, W., Yang, X., and Zhang, Y
ApJ, , 888(2):66. Luo, W., Yang, X., and Zhang, Y. (2014).Connections between GalaxyMergersandStarburst: EvidencefromtheLocalUni- verse.ApJ, , 789(1):L16. Lupton, R., Blanton, M. R., Fekete, G., et al. (2004).Prepar- ing Red-Green-Blue Images from CCD Data . PASP, , 116(816):1...
2014
-
[1144]
and Hernquist, L
Springel, V. and Hernquist, L. (2003).Cosmological smoothed particle hydrodynamics simulations: a hybrid multiphase model for star formation.MNRAS, , 339(2):289–311. Springel, V., Pakmor, R., Pillepich, A., et al. (2018).First re- sults from the IllustrisTNG simulations: matte...
2003
-
[1452]
(2011).Galactic mé- nageàtrois: simulatingmagneticfieldsincollidinggalaxies
Kotarba, H., Lesch, H., Dolag, K., et al. (2011).Galactic mé- nageàtrois: simulatingmagneticfieldsincollidinggalaxies . MNRAS, , 415(4):3189–3218. Krause,M.(2009). MagneticFieldsandStarFormationinSpiral Galaxies. In Revista Mexicana de Astronomia y Astrofisica Conference Serie...
2011
-
[1526]
E., Gottlöber, S., et al
Hoeft, M., Nuza, S. E., Gottlöber, S., et al. (2011).Radio Relics inCosmologicalSimulations .JournalofAstrophysicsandAs- tronomy, , 32:509–517. Hoeft, M., Rajpurohit, K., Wittor, D., di Gennaro, G., and Domínguez-Fernández, P. (2022).On the Polarisation of Ra- dio Relics.Galax...
2011
-
[2209]
de Gasperin, F., Rudnick, L., Finoguenov, A., et al. (2022). MeerKATviewofthediffuseradiosourcesinAbell3667and theirinteractionswiththethermalplasma .A&A,, 659:A146. 210 de Gasperin, F., van Weeren, R. J., Brüggen, M., et al. (2014).A new double radio relic in PSZ1 G096.89+24....
2022
-
[2256]
Vaĭnshteĭn, S
A&A, , 543:A43. Vaĭnshteĭn, S. I. and Zel’dovich, Y. B. (1972).Review of Topical Problems: Origin of Magnetic Fields in Astrophysics (Tur- bulent “Dynamo” Mechanisms). Soviet Physics Uspekhi, , 15(2):159–172. Vazza, F. and Brüggen, M. (2014).Doradiorelicschallengedif- fusive s...
1972
-
[2319]
Ghosh, S
A&A, , 614:A7. Ghosh, S. and Bhat, P. (2025).Magnetic Reconnection: An Al- ternative Explanation of Radio Emission in Galaxy Clusters. ApJ, , 979(1):L15. Giacintucci, S., Markevitch, M., Cassano, R., et al. (2019).Ex- panding the Sample of Radio Minihalos in Galaxy Clusters. A...
2025
-
[2325]
A., Grand , R
Pakmor, R., Gómez, F. A., Grand , R. J. J., et al. (2017).Mag- neticfieldformationintheMilkyWaylikediscgalaxiesofthe Auriga project.MNRAS, , 469(3):3185–3199. Pakmor, R., Guillet, T., Pfrommer, C., et al. (2018).Faraday ro- tation maps of disc galaxies.MNRAS, , 481(4):4410–441...
2017
-
[2481]
Biermann, L. (1950). Über den Ursprung der Magnetfelder auf Sternen und im interstellaren Raum. Zeitschrift Natur- forschung Teil A,, 5:65. Binney, J. and Tremaine, S. (2008).Galactic Dynamics: Second Edition.Princeton University Press. Birk, G. T., Lesch, H., and Neukirch, T....
1950
-
[2555]
Magnetising the circumgalactic medium of disk galaxies., MNRAS
Pakmor,R., vandeVoort,F.,Bieri, R., etal.(2020). Magnetising the circumgalactic medium of disk galaxies., MNRAS. Parker, E. N. (1971).The Generation of Magnetic Fields in As- trophysical Bodies. II. The Galactic Field.ApJ, , 163:255. Patton, D. R., Qamar, F. D., Ellison, S. L....
2020
-
[2715]
Wrong Way
Bonafede, A., Brüggen, M., Rafferty, D., et al. (2018).LOFAR discoveryof radio emission in MACS J0717.5+3745. MN- RAS, , 478(3):2927–2938. Bonafede, A., Brüggen, M., van Weeren, R., et al. (2012).Dis- covery of radio haloes and double relics in distant MACS galaxy clusters: cl...
2018
-
[2754]
toothbrush-relic
Umetsu, K. (2020).Cluster-galaxy weak lensing. A&A Rev., , 28(1):7. Unger,M.andFarrar,G.R.(2024). TheCoherentMagneticField of the Milky Way.ApJ, , 970(1):95. Urdampilleta, I., Akamatsu, H., Mernier, F., et al. (2018).X-ray studyofthedoubleradiorelicAbell3376withSuzaku .A&A, , ...
2020
-
[3186]
C., Thompson, T
Lacki, B. C., Thompson, T. A., and Quataert, E. (2010).The Physics of the Far-infrared-Radio Correlation. I. Calorime- try, Conspiracy, and Implications.ApJ, , 717(1):1–28. Lazarian, A. and Vishniac, E. T. (1999). Reconnection in a Weakly Stochastic Field.ApJ, , 517(2):700–718...
2010
-
[3261]
(2019b).The Il- lustrisTNG simulations: public data release
Nelson, D., Springel, V., Pillepich, A., et al. (2019b).The Il- lustrisTNG simulations: public data release. Computational Astrophysics and Cosmology, , 6(1):2. Noguchi,M.(1987). Closeencounterbetweengalaxies-II.Tidal deformation of adisc galaxystabilizedby massivehalo.MN- RAS...
1987
-
[3349]
Tacchella, S., Diemer, B., Hernquist, L., et al. (2019). Mor- phology and star formation in IllustrisTNG: the build-up of spheroids and discs.MNRAS, , 487(4):5416–5440. Tevlin, L., Berlok, T., Pfrommer, C., et al. (2025).Magnetic dy- namos in galaxy clusters: The crucial role ...
2019
-
[3498]
F., Hernquist, L., Cox, T
Hopkins, P. F., Hernquist, L., Cox, T. J., and Kereš, D. (2008). ACosmologicalFrameworkfortheCo-EvolutionofQuasars, SupermassiveBlackHoles,andEllipticalGalaxies.I.Galaxy Mergers and Quasar Activity.ApJS, , 175(2):356–389. Hopkins, P. F., Kereš, D., Oñorbe, J., et al. (2014).Ga...
2008 arXiv
-
[4042]
Federrath, C. (2016). Magnetic field amplification in turbu- lent astrophysical plasmas. Journal of Plasma Physics, , 82(6):535820601. Federrath,C.,Roman-Duval,J.,Klessen,R.S.,Schmidt,W.,and MacLow, M.M.(2010). Comparingthestatisticsofinterstel- lar turbulence in simulations a...
2016
Reviewed August 2, 2026 · model on record in the stance chip above.
Discussion (0). Continue with ORCID to comment.