A Three Axis Evaluation Framework for Mapper Algorithms
Pith reviewed 2026-06-26 12:28 UTC · model grok-4.3
The pith
Mapper variants trade off stability, cluster quality, and topological shape preservation, with none optimal on all three.
A machine-rendered reading of the paper's core claim, the machinery that carries it, and where it could break.
Core claim
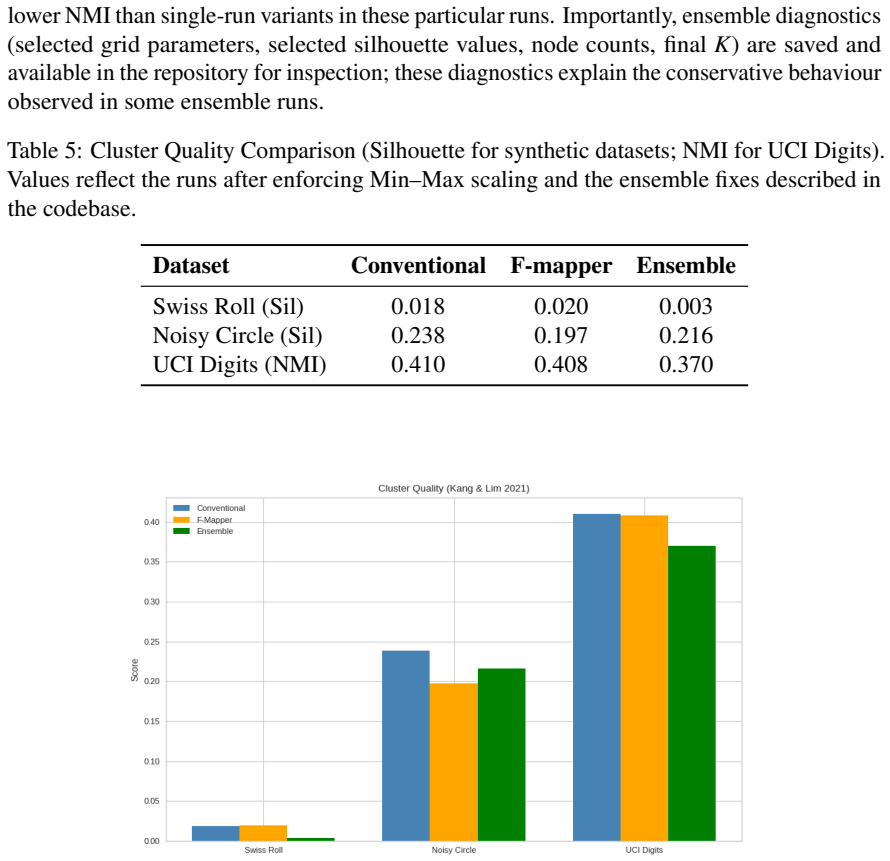
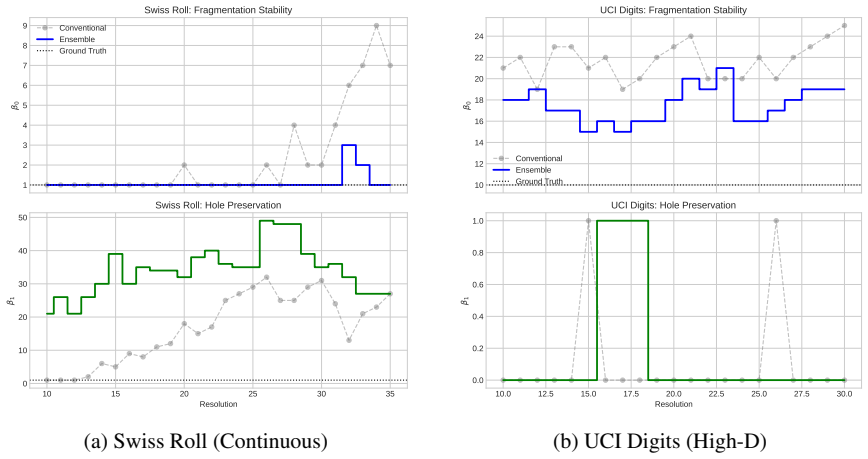
The three axes of evaluation are often in tension, and no single Mapper variant performs optimally across stability, cluster quality, and topological shape preservation on the tested data.
What carries the argument
Three-axis evaluation framework measuring stability of outputs, quality of clusters, and preservation of topological shape.
If this is right
- Selection of Mapper variants should be guided by which axis matters most for the intended use case.
- No universal Mapper configuration exists that balances all three criteria simultaneously.
- Open challenges remain in creating Mapper methods that reduce the observed tensions between axes.
Where Pith is reading between the lines
- Application-specific tuning of Mapper parameters may be necessary rather than seeking one best variant.
- The same multi-axis tension could appear in evaluations of related tools such as Reeb graphs or other TDA summaries.
- Adding metrics like runtime cost or noise robustness might further expose trade-offs not captured by the current three axes.
Load-bearing premise
The three axes of stability, cluster quality, and topological shape preservation are complementary and together sufficient to judge Mapper outputs.
What would settle it
Discovery of one Mapper variant that scores highly on all three axes across the synthetic and UCI Digits datasets would falsify the tension claim.
Figures
read the original abstract
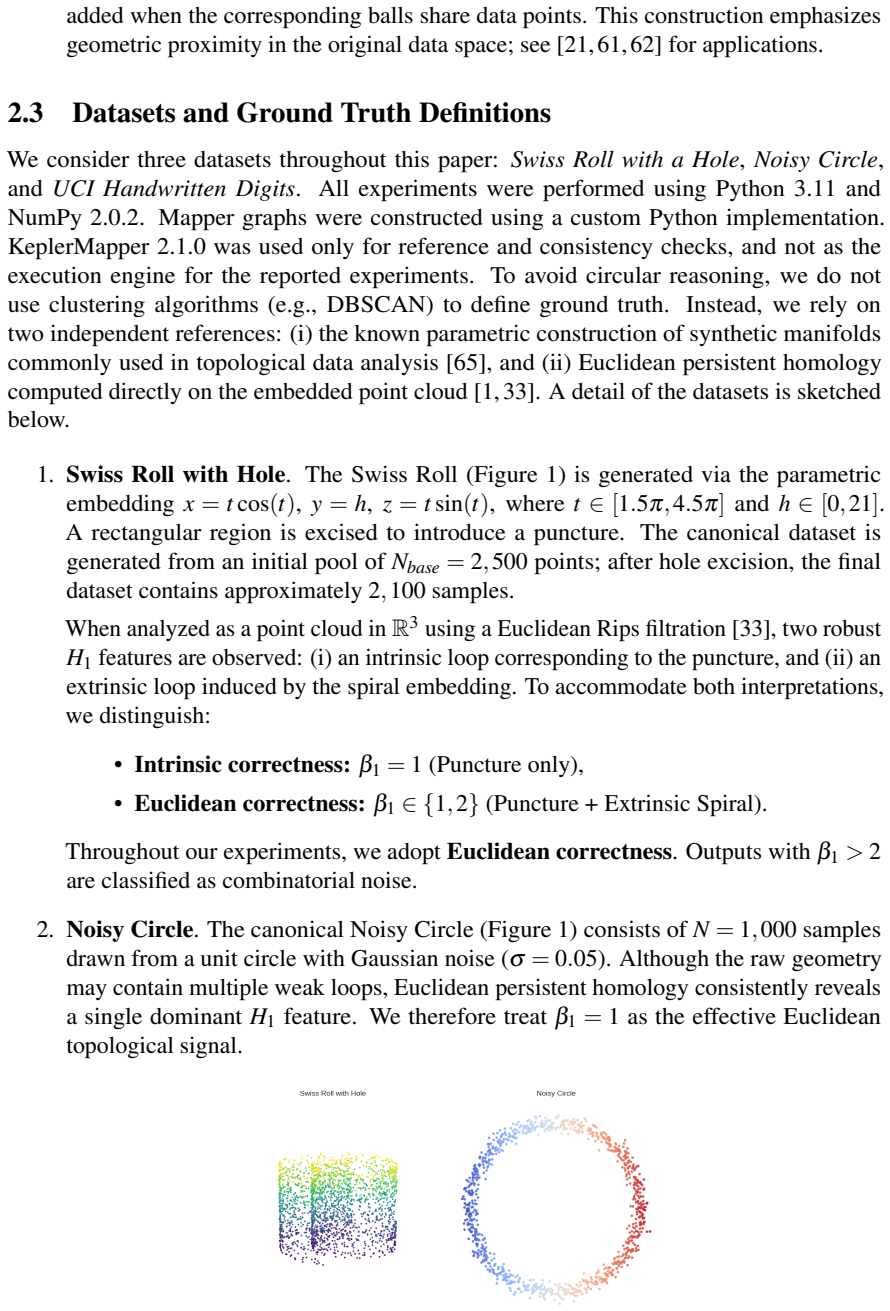
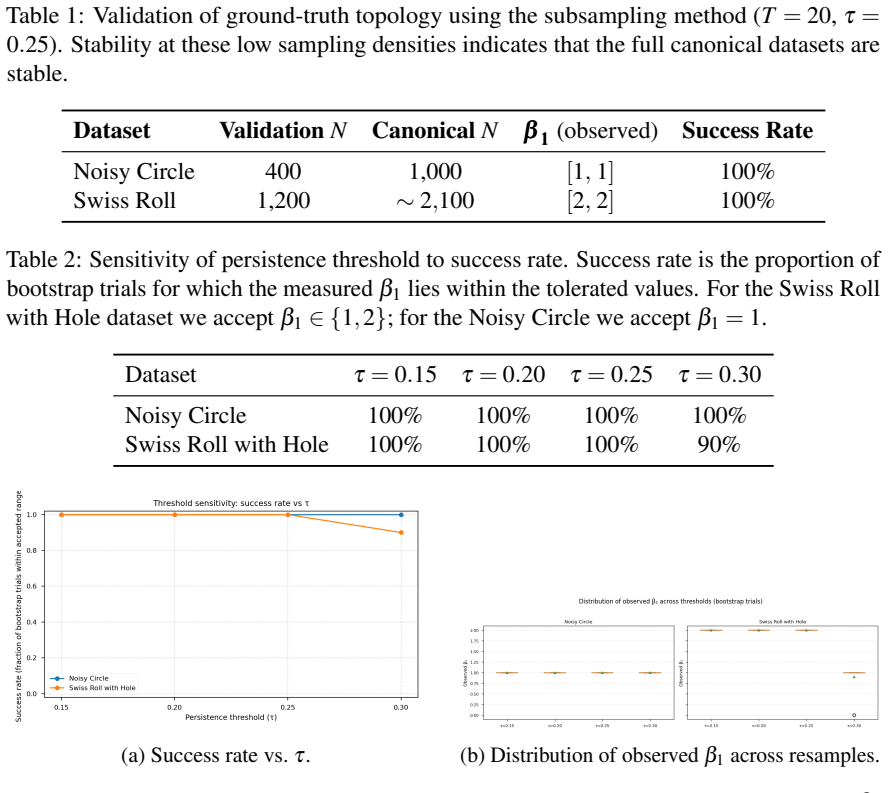
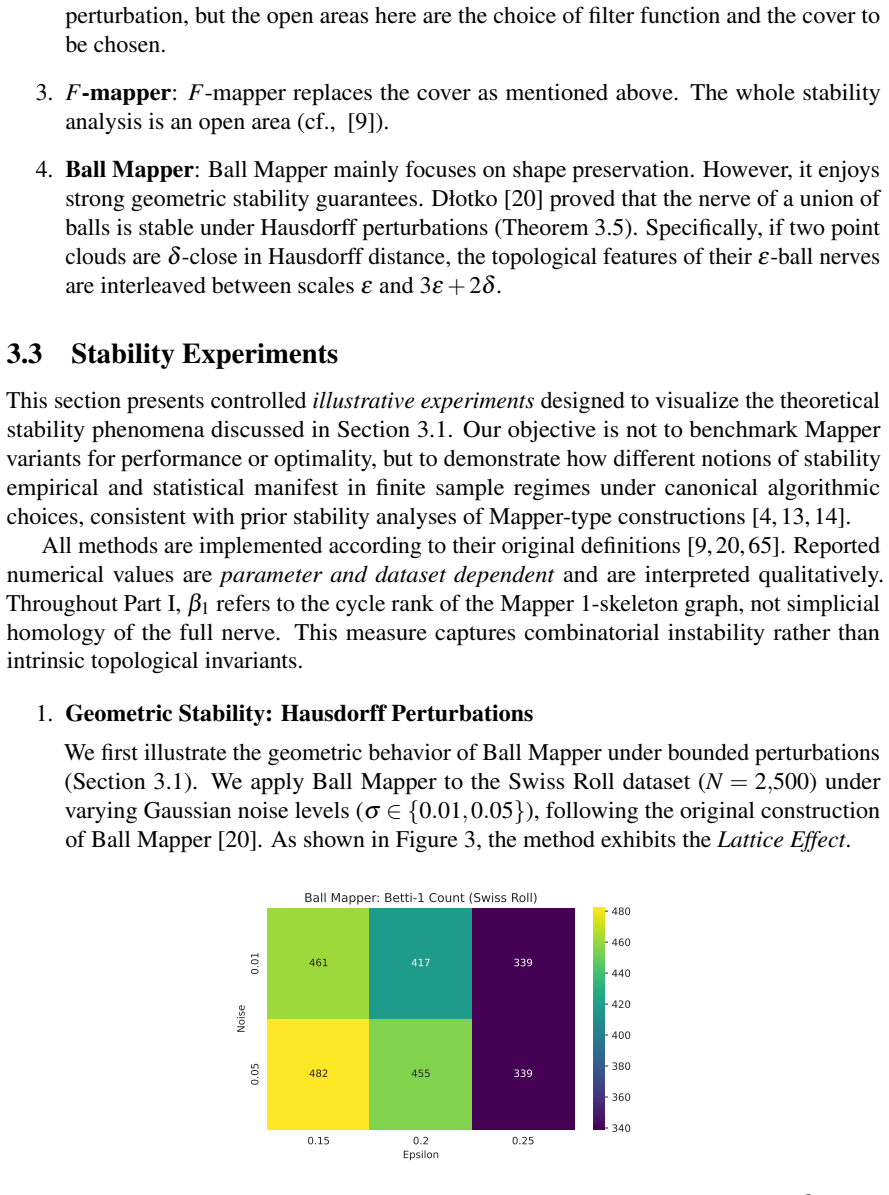
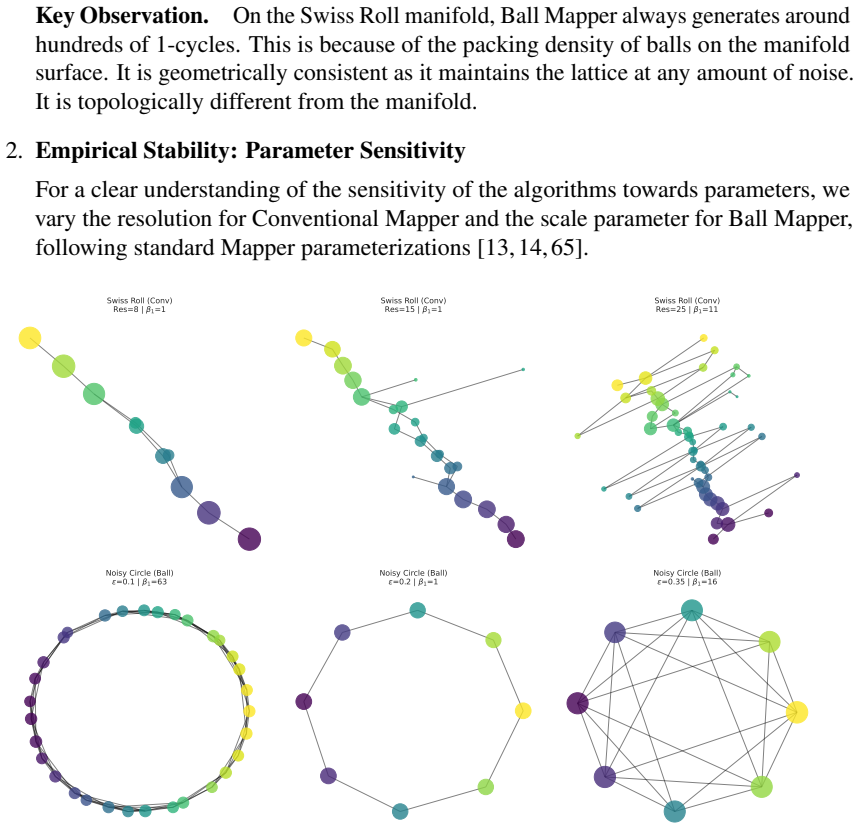
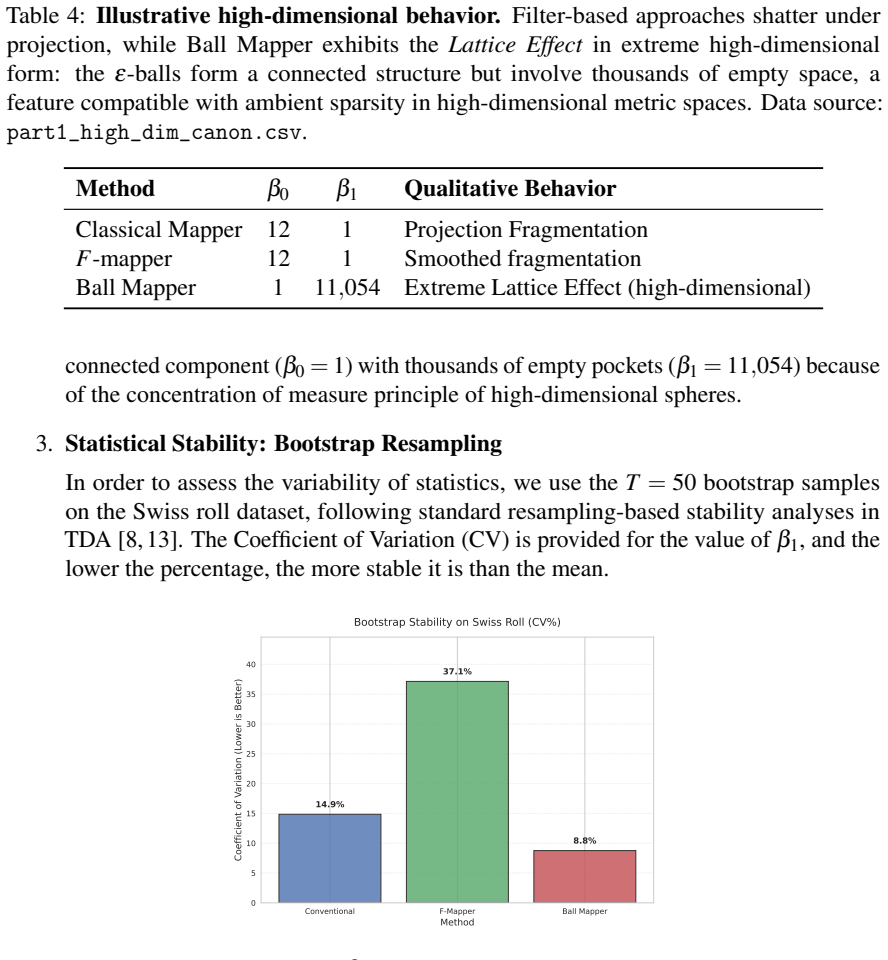
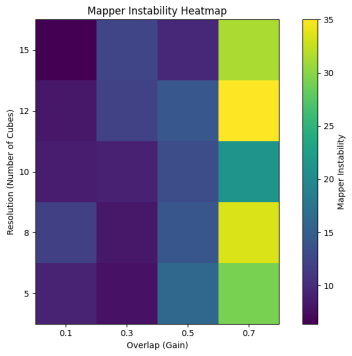
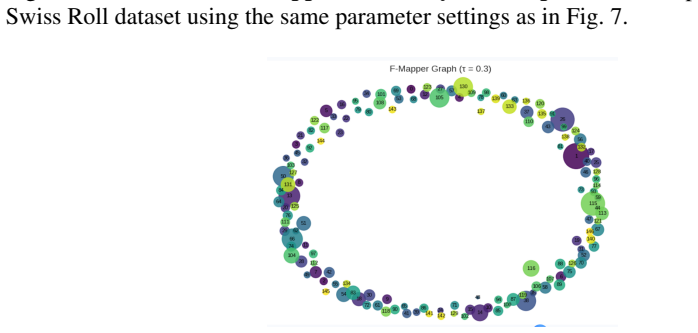
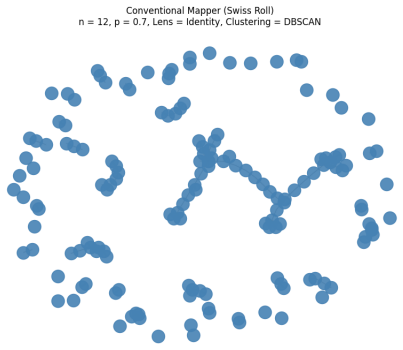
Mapper is a well-known tool in topological data analysis, which visualizes and summarizes high-dimensional data. However, its output is sensitive to choices of lens functions, cover parameters, and clustering strategies, making evaluation challenging. Most works that have attempted to evaluate the Mapper algorithm have done so visually. In this paper, we review a roadmap for assessing Mapper algorithms along three complementary axes: stability, cluster quality, and topological shape preservation. We analyze Mapper and its variants on synthetic datasets and the UCI Digits dataset. These modes include topological explosion at high resolutions. Our findings indicate that these axes of evaluation are often in tension and that no single Mapper variant performs optimally across all three. This review provides practical guidelines for choosing Mapper variants and identifies open challenges toward a principled Mapper analysis.
Editorial analysis
A structured set of objections, weighed in public.
Referee Report
Summary. The manuscript proposes a three-axis evaluation framework for Mapper algorithms in topological data analysis—stability, cluster quality, and topological shape preservation—and applies it to Mapper variants on synthetic datasets and the UCI Digits dataset. The central claim is that these axes are frequently in tension and that no single variant optimizes all three simultaneously, yielding practical guidelines and identifying open challenges.
Significance. If the experimental demonstration of axis tensions holds under the reported conditions, the work supplies a concrete, multi-criteria alternative to purely visual Mapper assessment. This could inform variant selection in applied TDA pipelines and surface trade-offs that single-metric studies miss.
major comments (2)
- [§4] §4 (Experiments): the reported tension between axes is demonstrated only for the chosen synthetic constructions and UCI Digits; it is unclear whether the same conflicts appear under different lens functions or cover parameter regimes not tested in the high-resolution explosion cases.
- [§3.2] §3.2 (Cluster quality axis): the metric relies on a fixed external clustering reference; the claim that this axis is independent of the stability axis would be strengthened by an ablation showing that the tension persists when the reference clustering is replaced by an internal validity index.
minor comments (2)
- Notation for the three axes is introduced without a consolidated table; a summary table listing each axis, its quantitative proxy, and the datasets on which it is evaluated would improve readability.
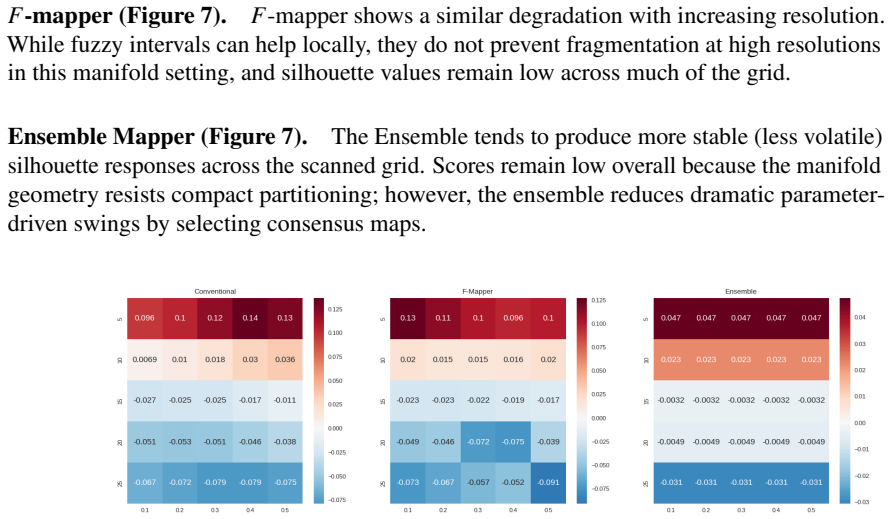
- Figure captions for the high-resolution Mapper outputs do not state the exact resolution parameter values used in the 'topological explosion' examples.
Simulated Author's Rebuttal
We thank the referee for the constructive comments on our manuscript. We respond point-by-point to the major comments below.
read point-by-point responses
-
Referee: [§4] §4 (Experiments): the reported tension between axes is demonstrated only for the chosen synthetic constructions and UCI Digits; it is unclear whether the same conflicts appear under different lens functions or cover parameter regimes not tested in the high-resolution explosion cases.
Authors: Our experiments in §4 focus on synthetic constructions and the UCI Digits dataset precisely because they exhibit the high-resolution topological explosion behavior central to the framework. The tensions are demonstrated consistently across these cases. We agree that the scope is limited and will add an expanded discussion subsection in §4 on the rationale for the chosen lens functions and cover parameters, along with explicit caveats about generalizability to untested regimes. revision: partial
-
Referee: [§3.2] §3.2 (Cluster quality axis): the metric relies on a fixed external clustering reference; the claim that this axis is independent of the stability axis would be strengthened by an ablation showing that the tension persists when the reference clustering is replaced by an internal validity index.
Authors: The external reference was selected to provide a ground-truth benchmark for cluster quality on datasets with known structure. We accept the suggestion and will add an ablation in §3.2 (or a new subsection) that replaces the external reference with an internal index such as the silhouette score, confirming that the reported tensions with the stability axis persist under this change. revision: yes
Circularity Check
No significant circularity
full rationale
The paper presents an empirical evaluation framework for Mapper algorithms across three axes (stability, cluster quality, topological shape preservation) using synthetic and UCI Digits datasets. No derivation chain, first-principles predictions, fitted parameters renamed as outputs, or self-citation load-bearing premises are present; the central claim of tension between axes rests on direct experimental comparison rather than any reduction to inputs by construction. This is a standard evaluation review with independent content.
Axiom & Free-Parameter Ledger
Reference graph
Works this paper leans on
-
[1]
Adams H., et al., Persistence images: A stable vector representation of persistent homology, Journal of Machine Learning Research 18.8 (2017): 1–35
2017
-
[2]
Alvarado E., et al., G-mapper: Learning a cover in the mapper construction, SIAM Journal on Mathematics of Data Science 7.2 (2025): 572–596
2025
-
[3]
J., et al., Genomics data analysis via spectral shape and topology, PLOS ONE 18.4 (2023): e0284820
Amézquita E. J., et al., Genomics data analysis via spectral shape and topology, PLOS ONE 18.4 (2023): e0284820
2023
-
[4]
Belchí F., et al., A numerical measure of the instability of mapper-type algorithms, Journal of Machine Learning Research 21 (2020): 1–45
2020
-
[5]
C., Pattern Recognition with Fuzzy Objective Function Algorithms, Springer Science & Business Media, 1981
Bezdek J. C., Pattern Recognition with Fuzzy Objective Function Algorithms, Springer Science & Business Media, 1981. 35
1981
-
[6]
Biasotti S., et al., Reeb graphs for shape analysis and applications, Theoretical Computer Science 392.1–3 (2008): 5–22
2008
-
[7]
Bodnar C., Cangea C., and Liò P., Deep Graph Mapper: Seeing graphs through the neural lens, Frontiers in Big Data 4 (2021): 680535
2021
-
[8]
Brown A., et al., Probabilistic convergence and stability of random mapper graphs, Journal of Applied and Computational Topology 5.1 (2021): 99–140
2021
-
[9]
Bui Q.-T., et al., F-mapper: A fuzzy mapper clustering algorithm, Knowledge-Based Systems 189 (2020): 105107
2020
-
[10]
Bui Q.-T., et al., SFCM: A fuzzy clustering algorithm for extracting the shape informa- tion of data, IEEE Transactions on Fuzzy Systems 29.1 (2020): 75–89
2020
-
[11]
Bungula W., and Darcy I., Bi-filtration and stability of TDA mapper for point cloud data, arXiv preprint arXiv:2409.17360 (2024)
arXiv 2024
-
[12]
F., A fuzzy-logic mapper for audiovisual media, Computer Music Journal 30.1 (2006): 67–82
Cadiz R. F., A fuzzy-logic mapper for audiovisual media, Computer Music Journal 30.1 (2006): 67–82
2006
-
[13]
Carrière M., Michel B., and Oudot S., Statistical analysis and parameter selection for mapper, Journal of Machine Learning Research 19 (2018): 1–39
2018
-
[14]
Carrière M., and Oudot S., Structure and stability of the one-dimensional mapper, Foundations of Computational Mathematics 18.6 (2018): 1333–1396
2018
-
[15]
M., Carlsson G., and Rabadán R., Topology of viral evolution, Proceedings of the National Academy of Sciences 110.46 (2013): 18566–18571
Chan J. M., Carlsson G., and Rabadán R., Topology of viral evolution, Proceedings of the National Academy of Sciences 110.46 (2013): 18566–18571
2013
-
[16]
Chen Y ., and V oli´c I., Topological data analysis model for the spread of the coronavirus, PLOS ONE 16.8 (2021): e0255584
2021
-
[17]
Cuerno M., et al., Topological data analysis in air traffic management: The shape of big flight data sets, PLOS ONE 20.2 (2025): e0318108
2025
-
[18]
L., and Bouldin D
Davies D. L., and Bouldin D. W., A cluster separation measure, IEEE Transactions on Pattern Analysis and Machine Intelligence 1.2 (1979): 224–227
1979
-
[19]
Dey T. K., Mémoli F., and Wang Y ., Multiscale Mapper: Topological summarization via codomain covers, Proceedings of the Twenty-Seventh Annual ACM-SIAM Symposium on Discrete Algorithms (SODA), SIAM (2016): 1935–1951
2016
-
[20]
Dłotko P., Ball Mapper: A shape summary for topological data analysis, arXiv preprint arXiv:1901.07410 (2019)
Pith/arXiv arXiv 1901
-
[21]
Dłotko P., Qiu W., and Rudkin S., Topological Data Analysis Ball Mapper for finance, arXiv preprint arXiv:2206.03622 (2022)
arXiv 2022
-
[22]
N., Topological signatures of altered brain network centrality in ADHD: A TDA Mapper study, NeurIPS 2025 Workshop on Symmetry and Geometry in Neural Representations (2025)
Duman A. N., Topological signatures of altered brain network centrality in ADHD: A TDA Mapper study, NeurIPS 2025 Workshop on Symmetry and Geometry in Neural Representations (2025). 36
2025
-
[23]
C., A fuzzy relative of the ISODATA process and its use in detecting compact well-separated clusters, Journal of Cybernetics 3.3 (1973): 32–57
Dunn J. C., A fuzzy relative of the ISODATA process and its use in detecting compact well-separated clusters, Journal of Cybernetics 3.3 (1973): 32–57
1973
-
[24]
Ester M., et al., A density-based algorithm for discovering clusters in large spatial databases with noise, Proceedings of the ACM SIGKDD International Conference on Knowledge Discovery and Data Mining (KDD) (1996): 226–231
1996
-
[25]
Fitzpatrick P., et al., Ensemble learning for mapper parameter optimization, Proceedings of the 2023 IEEE 35th International Conference on Tools with Artificial Intelligence (ICTAI), IEEE (2023): 924–931
2023
-
[26]
Geniesse C., Chowdhury S., and Saggar M., NeuMapper: A scalable computational framework for multiscale exploration of the brain’s dynamical organization, Network Neuroscience 6.2 (2022): 467–498
2022
-
[27]
Gidea M., and Katz Y ., Topological data analysis of financial time series: Landscapes of crashes, Physica A: Statistical Mechanics and Its Applications 491 (2018): 820–834
2018
-
[28]
Guzmán-Sáenz A., et al., Signal enrichment with strain-level resolution in metagenomes using topological data analysis, BMC Genomics 20.Suppl 2 (2019): 194
2019
-
[29]
Ha¸ segan D., et al., Deconstructing the Mapper algorithm to extract richer topological and temporal features from functional neuroimaging data, Network Neuroscience 8.4 (2024): 1355–1382
2024
-
[30]
Hatcher A., Algebraic Topology, Cambridge University Press, 2005
2005
-
[31]
Hiraoka Y ., et al., Hierarchical structures of amorphous solids characterized by persistent homology, Proceedings of the National Academy of Sciences 113.26 (2016): 7035– 7040
2016
-
[32]
Hofer C., et al., Deep learning with topological signatures, Advances in Neural Infor- mation Processing Systems (NeurIPS) 30 (2017): 1634–1644
2017
-
[33]
D., Kwitt R., and Niethammer M., Learning representations of persistence barcodes, Journal of Machine Learning Research 20 (2019): 1–45
Hofer C. D., Kwitt R., and Niethammer M., Learning representations of persistence barcodes, Journal of Machine Learning Research 20 (2019): 1–45
2019
-
[34]
Hubert L., and Arabie P., Comparing partitions, Journal of Classification 2.1 (1985): 193–218
1985
-
[35]
Indah D., et al., Topological data analysis for driver behavior classification driven by vehicle trajectory data, Machine Learning with Applications 16 (2025): 100719
2025
-
[36]
Jeitziner R., et al., Two-tier Mapper: A user-independent clustering method for global gene expression analysis based on topology, arXiv preprint arXiv:1801.01841 (2018)
Pith/arXiv arXiv 2018
-
[37]
J., and Lim Y ., Ensemble Mapper, Stat 10.1 (2021): e405
Kang S. J., and Lim Y ., Ensemble Mapper, Stat 10.1 (2021): e405
2021
-
[38]
Kappe C., Böttinger M., and Leitte H., Topology-based feature analysis of scalar field ensembles: An application to climate (change) analysis, Computers & Graphics 104 (2022): 59–71. 37
2022
-
[39]
Kramár M., et al., Quantifying force networks in particulate systems, Physica D: Nonlinear Phenomena 283 (2014): 37–53
2014
-
[40]
Kyeong S., et al., A new approach to investigate the association between brain func- tional connectivity and disease characteristics of attention-deficit/hyperactivity disorder: Topological neuroimaging data analysis, PLOS ONE 10.9 (2015): e0137296
2015
-
[41]
G., Topological data analysis and machine learning, Advances in Physics: X 8.1 (2023): 2202331
Leykam D., and Angelakis D. G., Topological data analysis and machine learning, Advances in Physics: X 8.1 (2023): 2202331
2023
-
[42]
Y ., et al., Extracting insights from the shape of complex data using topology, Scientific Reports 3.1 (2013): 1236
Lum P. Y ., et al., Extracting insights from the shape of complex data using topology, Scientific Reports 3.1 (2013): 1236
2013
-
[43]
Lymberopoulos E., et al., Topological data analysis highlights novel geographical signatures of the human gut microbiome, Frontiers in Artificial Intelligence 4 (2021): 680564
2021
-
[44]
N., Ugoala B
Madukpe V . N., Ugoala B. C., and Zulkepli N. F. S., A comprehensive review of the mapper algorithm, a topological data analysis technique, and its applications across various fields (2007–2025), International Journal of Data Science and Analytics (2026): 1–56
2007
-
[45]
Manogaran G., Lopez D., and Chilamkurti N., In-Mapper combiner based MapReduce algorithm for processing of big climate data, Future Generation Computer Systems 86 (2018): 433–445
2018
-
[46]
W., Morse Theory, Princeton University Press, 1963
Milnor J. W., Morse Theory, Princeton University Press, 1963
1963
-
[47]
S., Topological Data Analysis and Applications to Influenza, M.S
Morrison K. S., Topological Data Analysis and Applications to Influenza, M.S. thesis, Miami University, 2020
2020
-
[48]
Munch E., A user’s guide to topological data analysis, Journal of Learning Analytics 4.2 (2017): 47–61
2017
-
[49]
Munch E., and Wang B., Convergence between categorical representations of Reeb space and mapper, arXiv preprint arXiv:1512.04108 (2015)
Pith/arXiv arXiv 2015
-
[50]
Muszynski G., et al., Topological data analysis and machine learning for recognizing atmospheric river patterns in large climate datasets, Geoscientific Model Development 12.2 (2019): 613–628
2019
-
[51]
Naitzat G., Zhitnikov A., and Lim L.-H., Topology of deep neural networks, Journal of Machine Learning Research 21 (2020): 1–40
2020
-
[52]
Nicolau M., Levine A. J., and Carlsson G., Topology-based data analysis identifies a subgroup of breast cancers with a unique mutational profile and excellent survival, Proceedings of the National Academy of Sciences 108.17 (2011): 7265–7270
2011
-
[53]
Oulhaj Z., et al., Deep Mapper: Efficient Visualization of Plausible Conformational Pathways, arXiv preprint arXiv:2402.19177 (2024). 38
arXiv 2024
-
[54]
Parida L., et al., Host trait prediction of metagenomic data for topology-based visual- ization, International Conference on Distributed Computing and Internet Technology, Springer International Publishing (2015): 7–17
2015
-
[55]
J., Topological Data Analysis for Genomics and Evolu- tion: Topology in Biology, Cambridge University Press, 2019
Rabadán R., and Blumberg A. J., Topological Data Analysis for Genomics and Evolu- tion: Topology in Biology, Cambridge University Press, 2019
2019
-
[56]
Rieck B., et al., Neural persistence: A complexity measure for deep neural networks using algebraic topology, arXiv preprint arXiv:1812.09764 (2018)
arXiv 2018
-
[57]
Riihimäki H., et al., A topological data analysis based classification method for multiple measurements, BMC Bioinformatics 21.1 (2020): 336
2020
-
[58]
H., et al., Single-cell topological RNA-seq analysis reveals insights into cellular differentiation and development, Nature Biotechnology 35.6 (2017): 551–560
Rizvi A. H., et al., Single-cell topological RNA-seq analysis reveals insights into cellular differentiation and development, Nature Biotechnology 35.6 (2017): 551–560
2017
-
[59]
J., Silhouettes: A graphical aid to the interpretation and validation of cluster analysis, Journal of Computational and Applied Mathematics 20 (1987): 53–65
Rousseeuw P. J., Silhouettes: A graphical aid to the interpretation and validation of cluster analysis, Journal of Computational and Applied Mathematics 20 (1987): 53–65
1987
-
[60]
Routh A., and Johnson J. E., Discovery of functional genomic motifs in viruses with ViReMa–a Virus Recombination Mapper–for analysis of next-generation sequencing data, Nucleic Acids Research 42.2 (2014): e11
2014
-
[61]
Rudkin S., An Introduction to Topological Data Analysis Ball Mapper in R, arXiv preprint arXiv:2504.14081 (2025)
arXiv 2025
-
[62]
Rudkin S., and Qiu W., ballmapper: Applying Topological Data Analysis Ball Mapper in Stata, arXiv preprint arXiv:2601.00508 (2026)
arXiv 2026
-
[63]
Saggar M., et al., Towards a new approach to reveal dynamical organization of the brain using topological data analysis, Nature Communications 9.1 (2018): 1399
2018
-
[64]
A., Topological data analysis to model the shape of immune responses during co-infections, Communications in Nonlinear Science and Numerical Simulation 85 (2020): 105228
Sasaki K., Bruder D., and Hernandez-Vargas E. A., Topological data analysis to model the shape of immune responses during co-infections, Communications in Nonlinear Science and Numerical Simulation 85 (2020): 105228
2020
-
[65]
Singh G., Mémoli F., and Carlsson G. E., Topological methods for the analysis of high dimensional data sets and 3D object recognition, Proceedings of the Eurographics Symposium on Point-Based Graphics (PBG) (2007): 91–100
2007
-
[66]
Skaf Y ., and Laubenbacher R., Topological data analysis in biomedicine: A review, Journal of Biomedical Informatics 130 (2022): 104082
2022
-
[67]
Sotcheff S., et al., ViReMa: A virus recombination mapper of next-generation sequenc- ing data characterizes diverse recombinant viral nucleic acids, GigaScience 12 (2023): giad009
2023
-
[68]
Strehl A., and Ghosh J., Cluster ensembles—a knowledge reuse framework for combin- ing multiple partitions, Journal of Machine Learning Research 3 (2002): 583–617
2002
-
[69]
Tao Y ., and Ge S., A Mapper algorithm with implicit intervals and its optimization, Journal of Computational Biology (2025). 39
2025
-
[70]
Tao Y ., and Ge S., A distribution-guided Mapper algorithm, BMC Bioinformatics 26.1 (2025): 73
2025
-
[71]
Wee J., and Jiang J., A review of topological data analysis and topological deep learning in molecular sciences, Journal of Chemical Information and Modeling 65.23 (2025): 12691–12706
2025
-
[72]
thesis, The Chinese University of Hong Kong (Hong Kong), 2020
Wei Y ., An Integrative Framework Based on Topological Data Analysis for Population- scale Microbiome Stratification, Association and Comparative Studies, Ph.D. thesis, The Chinese University of Hong Kong (Hong Kong), 2020
2020
-
[73]
Wei G., Topological data analysis and topological deep learning beyond persistent homology, 2026 Joint Mathematics Meetings (JMM 2026), AMS (to appear)
2026
-
[74]
Zhang M., Chowdhury S., and Saggar M., Temporal Mapper: Transition networks in simulated and real neural dynamics, Network Neuroscience 7.2 (2023): 431–460
2023
-
[75]
Zhou Y ., et al., Comparing Mapper graphs of artificial neuron activations, Proceedings of the 2023 Topological Data Analysis and Visualization (TopoInVis), IEEE (2023): 41–50. 40
2023
discussion (0)
Sign in with ORCID, Apple, or X to comment. Anyone can read and Pith papers without signing in.