REVIEW 3 major objections 5 minor 34 references
Computing Stable Demers Cartograms
T0 review · 3 major / 5 minor · reviewed 2026-08-14 · deepseek-v4-flash
Pith's one-line read The paper shows that stable Demers cartograms — square-per-region maps for multiple data values — can be computed by one linear program with zero cartographic error and short leaders for lost adjacencies.
desk verdict A solid LP formulation for stable Demers cartograms with a useful experimental comparison, but the leader guarantee is oversold and needs to be scoped honestly before publication. read the letter →
The pith
A machine-rendered reading of the paper's core claim, the machinery that carries it, and where it could break.
The reading
What carries the argument
The load-bearing object is the separation-constraint linear program. For every pair of regions the paper decides whether the pair is horizontally or vertically separated according to which coordinate difference of the original centroids is larger, recording the order in sets H and V; the directed graph formed by these relations must be acyclic for any layout to exist. The LP then uses variables for square centers and nonnegative distances between adjacent squares, with inequalities enforcing the prescribed order and a small gap for non-adjacent pairs, and an objective that sums distances between neighbors plus, in the multi-weight version, horizontal and vertical displacement between the same region across weight functions. This single formulation carries all three main results: the interpolation lemma follows because the feasible region is a product of half-planes, and the leader lemmas follow from analyzing the rectangles between separated squares in any feasible layout.
What would settle it
Take a map whose region graph contains four mutually adjacent regions, the paper's own Luxembourg K4 example: if the strong constraint set produces an infeasible LP, or if for a realizable pair of lost adjacencies the computed layout admits no two-bend leader, then the leader guarantee as stated is false. More directly, test Lemma 1 by computing any two feasible layouts and checking the midpoint of a linear interpolation: if any two squares overlap there, the interpolation claim fails.
Extended reading notes
Core claim
On the paper's own terms, the discovery is that stable Demers cartograms can be cast as one optimization problem rather than as a sequence of independent layout problems. Given weighted regions, their adjacencies, and the centroid-derived constraint sets H and V, each region is a square with prescribed side length; the paper introduces center variables and separation inequalities that force horizontal or vertical order, then minimizes the sum of distances between squares of originally adjacent regions, optionally plus displacement terms linking layouts for different weights. The same constraints are reused across every weight function, which is what makes stability possible: Lemma 1 shows any linear interpolation between two feasible layouts is still overlap-free. For pairs whose adjacency is lost, Lemmas 2 and 3 give a constructive guarantee that a monotone leader of minimal length exists, and under the strong constraint setting a leader with at most two bends exists, assuming a realizing cartogram with that pair touching exists. The authors present this as a framework in which cartographic error is exactly zero by construction, and in which quality and stability are controlled through explicit trade-off choices in the objective.
Load-bearing premise
The construction assumes that the centroid-derived horizontal and vertical separation relations between all pairs of regions form a consistent one-way ordering with no circular contradictions, and that this same set of constraints stays feasible for every weight function; if any of those fail, no cartogram exists and the leader guarantees have no layout to apply to.
Editorial extensions
If this is right
- If two cartograms for the same regions satisfy the same separation constraints, every point on a straight-line morph between them is a valid, overlap-free layout, so animations need no intermediate collision handling.
- For any adjacency that is lost, a leader of minimal length exists whenever the pair is minimal in the constraint order; for strong constraints and realizable pairs, leaders need at most two bends.
- The method returns zero cartographic error by construction, since square side lengths are fixed to data values; quality is therefore about topology, direction, and position only.
- For multivariate data the choice of which layouts to link is a genuine trade-off: iterative versions are faster and closer to the original map, while linking pairs directly gives better stability for weight vectors.
- An integer-program variant that counts lost adjacencies exactly gives the best topology but is impractical on large maps; the distance-based TOP objective is the usable proxy that balances all metrics.
Reading between the lines
- Beyond the paper, the same separation-constraint LP could be reused for other symbol shapes; the proofs of the leader lemmas rely only on orthogonal order, so diamonds or rectangles with fixed aspect ratios may inherit similar guarantees.
- The paper's quality and stability metrics are geometric; a human study measuring how quickly viewers track a region across a time series would test whether the LP's stability gains actually improve mental-map preservation.
- For very long time series, relating all pairs of layouts grows quadratically in the number of time steps; an adaptive strategy that links only consecutive layouts with large changes might keep most of the stability at lower cost.
Signed reviews
Editorial analysis
A structured set of objections, weighed in public.
Referee Report
Summary. The paper introduces a linear-programming approach to Demers cartograms (DCs), in which each region is represented by an axis-aligned square whose area equals the region's data value. For a single weight vector the LP enforces orthogonal separation constraints H and V derived from geographic centroids, minimizes the L1 distances between originally adjacent squares, and optionally a secondary directional-deviation term. For multiple weights the formulation adds displacement variables between layouts (complete, successive, or iterative linking) and solves one LP for all layouts. The authors prove that linear interpolation between feasible layouts is overlap-free (Lemma 1) and that, under an informally stated 'realisability' assumption, lost adjacencies can be connected by short monotone or low-bend orthogonal leaders (Lemmas 2 and 3). They define a force-directed baseline and report experiments on World and US datasets with metrics MADJ, MREL, MDIS, SDIS, and SREL. They conclude that their LP variants achieve a good trade-off between topological error and stability and outperform the force-directed baseline on most metrics.
Significance. If the leader guarantee were made precise, the paper would make a useful contribution: it gives a simple, polynomial-time LP for stable DCs, a clean interpolation argument useful for animation, constructive leader construction with O(n^2) complexity, and a new force-directed DC baseline for comparison. The systematic comparison across weak/strong settings, optimization terms, and stability implementations is a useful engineering contribution. However, the headline leader guarantee is currently conditional on an unformalized realizability assumption, and the experiments do not measure the fraction of lost adjacencies that satisfy it; the 'similar data yield similar cartograms' claim is supported only by geometric metrics without variance or user evaluation. These gaps do not invalidate the LP and experimental machinery, but they do prevent the paper from fully establishing its advertised guarantees.
major comments (3)
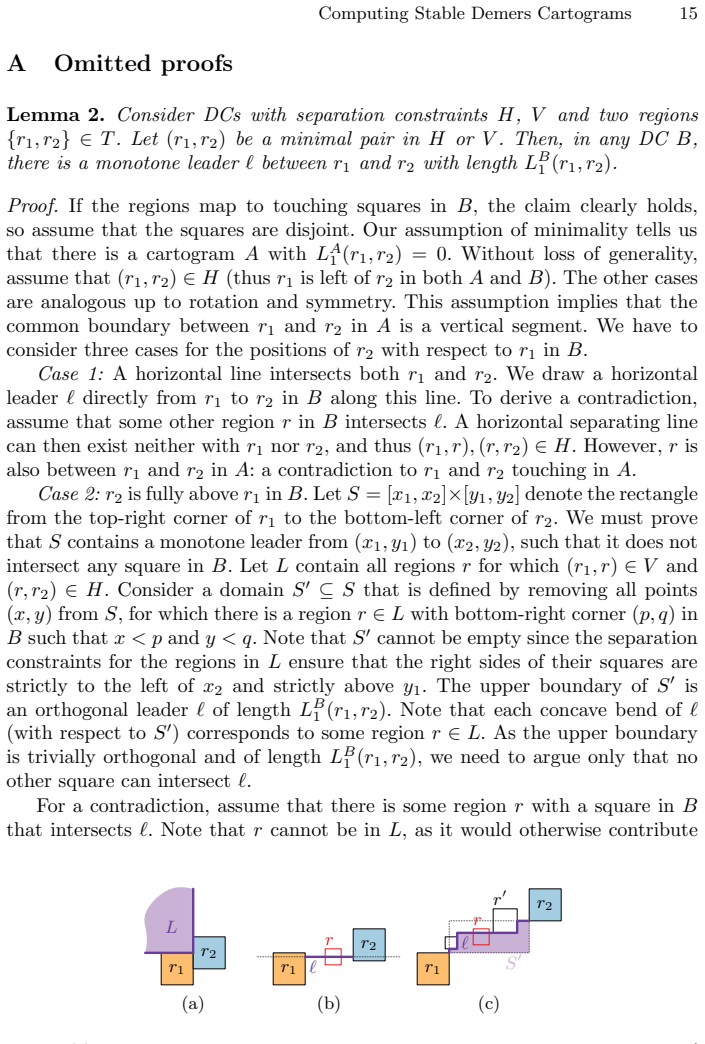
- [Section 3 and Appendix A (Lemmas 2 and 3)] The term 'minimal pair' used in Lemma 2 is never defined, and the proof's first sentence ('Our assumption of minimality tells us that there is a cartogram A with L_A=0') is not justified by anything established about H and V. The only preceding support is the informal two-item list in Section 3, whose second item assumes that for each pair to be connected a valid DC exists in which the pair is adjacent; that assumption is not shown to make every lost pair minimal, nor is it connected to the H/V partial order. Moreover, Section 5 reports MADJ values around 0.57-0.61 for TOP variants but no count of how many lost adjacencies are realizable, so the abstract's 'guarantees ability to connect most lost adjacencies' is neither proven nor measured. This is load-bearing because the leader guarantee is a headline contribution.
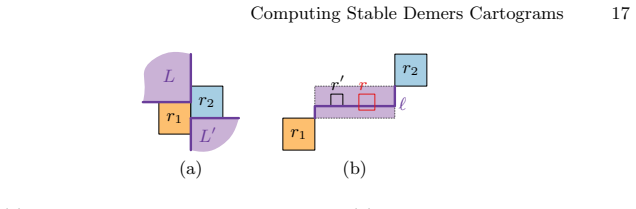
- [Appendix A, Lemma 3] The hypothesis of Lemma 3, 'assume a DC A exists with r1 and r2 adjacent, from which H and V are derived in the strong setting', does not match the algorithm, which derives H and V from the input centroids and reuses them for all weight functions. Thus the contradiction step in the proof that a region r must satisfy (r,r') in V by definition of the strong separation constraints is only valid if the constraints were derived from A, not from the map geometry used in the actual computations. Even if Lemma 3 is correct as a statement about a different construction, the transfer to the computed cartograms is a gap.
- [Section 2, 'Deriving separation constraints'] Feasibility of the constraints is assumed rather than established. The text states that the directed graph D=(R,H∪V) must be a DAG to ensure a DC exists, but it does not prove that the described weak/strong derivation from centroid-coordinate comparisons always yields a DAG, nor does it specify tie handling when the horizontal and vertical centroid differences are equal. Since every experimental result and both leader lemmas depend on the feasibility of the H,V input, the paper should either prove this for its derivation rule or discuss and measure infeasibility.
minor comments (5)
- [Section 4, Figure 4] The plot uses letter suffixes and abbreviations (for example, S, U, W after FRC and LP names) without explaining all of them in the caption; the caption should map each code to its meaning or refer to a table that does so.
- [Section 5, first paragraph] Numeric comparisons such as 'MREL reduces from 0.21 to 0.16' and 'SDIS decreases from 0.084 to 0.10' are reported without standard deviations, confidence intervals, or statistical tests; given the small number of datasets, these claims should be tempered or supported.
- [Section 2, 'Improving the gaps'] The sentence describing where epsilon is added to the right-hand side of (4) or (5) is easy to misread; it should state explicitly that for pairs separated by H the epsilon is added to (5), and for pairs separated by V to (4).
- [Section 3, stability implementations] Option 3) is first described as an alternative for time series but later called IT and used for weight vectors as well; the terminology should be unified so that the mapping from options to the CO/SU/IT labels is unambiguous.
- [Section 4, Datasets] No code, data, or solver configuration is provided; for reproducibility of the CPLEX experiments, making the datasets and parameter settings available would be helpful.
Circularity Check
Minor self-referential stability evaluation; the core LP derivation and leader lemmas are otherwise self-contained.
-
other
[Section 3, Eq. (7)-(9); Section 4, 'Metrics: stability']
"We change objective (1) and add constraints to minimize displacement between centers of the same region for different weight functions. ... The result is related to our optimization term for quality when dealing with multiple weights (see Section 3)."
The LP's stability objective (7)-(9) minimizes L1 displacement of square centers between layouts for the pairs in I, while the SDIS stability metric measures the normalized layout-distance change between DCs, i.e. essentially the same geometric quantity. Consequently, the reported result that CO and SU variants achieve better SDIS stability than IT is partly a check that the optimizer is minimizing its own objective, not an independent confirmation of a separate derived property. The paper explicitly discloses this relation, and it also reports SREL, MADJ, MREL, and a force-directed baseline as independent evidence, so the circularity is confined to one evaluation claim rather than the derivation chain.
full rationale
The central derivation chain—the LP for separation constraints (Eqs. 2-6), the multi-weight stability objective (Eqs. 7-9), and Lemmas 1-3—does not reduce to its inputs by construction. No parameter is fitted to an external target; the H/V separation constraints are derived from input centroids by an explicit rule; and the leader lemmas are conditional theorems with the realisability premise stated openly, not smuggled in through a definition or a self-citation. Self-citations such as [22] and [29] are not load-bearing: Lemma 1 is proved in the text, and [29] supplies standard quality metrics used for evaluation rather than the paper's central result. The only self-referential element is evaluative: CO/SU variants minimize center displacement between layouts, and the SDIS stability metric measures essentially that same displacement, so the advantage of SU/CO over IT on SDIS partly confirms the optimization objective rather than an independent property. The paper discloses this relation and provides independent grounding through MADJ, MREL, SREL, and the force-directed baseline. The undefined 'minimal pair' and uncharacterized realisability in Lemmas 2-3 are correctness or limitation concerns, not circular reductions, so they do not raise the circularity score.
Assumptions & free parameters
free parameters (5)
- epsilon gap =
min(side length of smallest region, 5% of diagonal of bounding box)
- force-directed disjointness constant D =
50000
- force equilibrium threshold =
1e-5 times minimum weight
- scale factor for weights =
maximum region weight scaled to delta/4
- secondary objective weight =
a small constant, not specified numerically
assumptions (4)
- domain assumption The directed graph D=(R,H union V) of separation constraints is a DAG, and every pair of regions appears in at least one of H or V.
- domain assumption Squares may touch only if the corresponding regions are adjacent; non-adjacent squares require a visible gap epsilon.
- domain assumption Adjacency graphs of geographic regions are planar, so leader computation is O(n^2).
- domain assumption For each lost adjacency that must be connected, there exists a valid DC in which the two regions touch.
Cite this review
Pith. "Pith review of Computing Stable Demers Cartograms." pith.science (2026). https://pith.science/paper/OUSCJO7D
@misc{pith2026190807291,
  author       = {Pith},
  title        = {Pith review of: Computing Stable Demers Cartograms},
  year         = {2026},
  howpublished = {\url{https://pith.science/paper/OUSCJO7D}},
  note         = {Machine review of arXiv:1908.07291}
}
read the original abstract
Cartograms are popular for visualizing numerical data for map regions. Maintaining correct adjacencies is a primary quality criterion for cartograms. When there are multiple data values per region (over time or different datasets) shown as animated or juxtaposed cartograms, preserving the viewer's mental-map in terms of stability between cartograms is another important criterion. We present a method to compute stable Demers cartograms, where each region is shown as a square and similar data yield similar cartograms. We enforce orthogonal separation constraints with linear programming, and measure quality in terms of keeping adjacent regions close (cartogram quality) and using similar positions for a region between the different data values (stability). Our method guarantees ability to connect most lost adjacencies with minimal leaders. Experiments show our method yields good quality and stability.
Figures



Figures from the paper (10 more)




Reference graph
Works this paper leans on
-
[1]
Discrete & Computational Ge- ometry 50(3), 784–810 (2013)
Alam, M.J., Biedl, T., Felsner, S., Kaufmann, M., Kobourov, S.G., Ueckerdt, T.: Computing cartograms with optimal complexity. Discrete & Computational Ge- ometry 50(3), 784–810 (2013)
work page 2013
-
[2]
Computer Graphics Forum 34(3), 351–360 (2015)
Alam, M.J., Kobourov, S.G., Veeramoni, S.: Quantitative measures for cartogram generation techniques. Computer Graphics Forum 34(3), 351–360 (2015)
work page 2015
-
[3]
http://www.ncgia.ucsb.edu/ projects/Cartogram Central/types.html (2002)
Bortins, I., Demers, S., Clarke, K.: Cartogram types. http://www.ncgia.ucsb.edu/ projects/Cartogram Central/types.html (2002)
work page 2002
-
[4]
In: Proceedings of the 23rd International Symposium on Graph Drawing and Network Visualization (GD)
Bowen, C., Durocher, S., L¨ offler, M., Rounds, A., Schulz, A., T´ oth, C.D.: Realiza- tion of simply connected polygonal linkages and recognition of unit disk contact trees. In: Proceedings of the 23rd International Symposium on Graph Drawing and Network Visualization (GD). pp. 447–459. LNCS 9411 (2015)
work page 2015
-
[5]
Computa- tional Geometry 9(1-2), 3–24 (1998)
Breu, H., Kirkpatrick, D.G.: Unit disk graph recognition is NP-hard. Computa- tional Geometry 9(1-2), 3–24 (1998)
work page 1998
-
[6]
Buchin, K., Kusters, V., Speckmann, B., Staals, F., Vasilescu, B.: A splitting line model for directional relations. In: Proceedings of the 19th ACM SIGSPATIAL International Conference on Advances in Geographic Information Systems (ACM GIS). pp. 142–151 (2011)
work page 2011
-
[7]
In: Proceedings of the 7th International Conference on Geographic Information Science (GIScience)
Buchin, K., Speckmann, B., Verdonschot, S.: Evolution strategies for optimizing rectangular cartograms. In: Proceedings of the 7th International Conference on Geographic Information Science (GIScience). pp. 29–42. LNCS 7478 (2012)
work page 2012
-
[8]
https://catalog.data.gov/dataset/ drug-poisoning-mortality-by-state-united-states (Mar 2019)
Centers for Disease Control and Prevention: Drug poi- soning mortality by state. https://catalog.data.gov/dataset/ drug-poisoning-mortality-by-state-united-states (Mar 2019)
work page 2019
Show all 34 references
-
[9]
In: Proceedings of the 6th International Conference on Information, Intelligence, Systems and Ap- plications (IISA)
Di Giacomo, E., Didimo, W., Hong, S.h., Kaufmann, M., Kobourov, S.G., Liotta, G., Misue, K., Symvonis, A., Yen, H.C.: Low ply graph drawing. In: Proceedings of the 6th International Conference on Information, Intelligence, Systems and Ap- plications (IISA). pp. 1–6 (2015)
2015
-
[10]
Dorling, D.: Area Cartograms: Their Use and Creation, Concepts and Techniques in Modern Geography, vol. 59. University of East Anglia (1996)
1996
-
[11]
International Journal of Computational Geometry & Applications 25(02), 101–122 (2015)
Eppstein, D., van Kreveld, M., Speckmann, B., Staals, F.: Improved grid map layout by point set matching. International Journal of Computational Geometry & Applications 25(02), 101–122 (2015)
2015
-
[12]
In: Proceedings of the 25th Annual Symposium on Computational Geometry (SoCG)
Eppstein, D., Mumford, E., Speckmann, B., Verbeek, K.: Area-universal rectan- gular layouts. In: Proceedings of the 25th Annual Symposium on Computational Geometry (SoCG). pp. 267–276 (2009)
2009
-
[13]
Proceedings of the National Academy of Sciences of the United States of America 101, 7499–7504 (2004)
Gastner, M., Newman, M.: Diffusion-based method for producing density- equalizing maps. Proceedings of the National Academy of Sciences of the United States of America 101, 7499–7504 (2004)
2004
-
[14]
In: Proceedings of the IEEE Symposium on Information Visualization (InfoVis)
Heilmann, R., Keim, D., Panse, C., Sips, M.: Recmap: Rectangular map approx- imations. In: Proceedings of the IEEE Symposium on Information Visualization (InfoVis). pp. 33–40 (2004)
2004
-
[15]
Discrete Mathe- matics 235(1–3), 95–106 (2001)
Hlinˇ en´ y, P.: Contact graphs of line segments are NP-complete. Discrete Mathe- matics 235(1–3), 95–106 (2001)
2001
-
[16]
In: Proceedings of the IEEE Conference on Visualization
House, D.H., Kocmoud, C.J.: Continuous cartogram construction. In: Proceedings of the IEEE Conference on Visualization. pp. 197–204 (1998)
1998
-
[17]
In: Proceedings of the 17th IEEE Eurographics Conference on Visualiza- tion (EuroVis–short papers) (2015) 14 S
Johnson, T., Acedo, C., Kobourov, S., Nusrat, S.: Analyzing the evolution of the internet. In: Proceedings of the 17th IEEE Eurographics Conference on Visualiza- tion (EuroVis–short papers) (2015) 14 S. Nickel et al
2015
-
[18]
IEEE Transactions on Visualization and Computer Graph- ics 10(1), 95–110 (2004)
Keim, D.A., North, S.C., Panse, C.: Cartodraw: A fast algorithm for generating contiguous cartograms. IEEE Transactions on Visualization and Computer Graph- ics 10(1), 95–110 (2004)
2004
-
[19]
In: Proceedings of the 23rd International Symposium on Graph Drawing and Net- work Visualization (GD)
Klemz, B., N¨ ollenburg, M., Prutkin, R.: Recognizing weighted disk contact graphs. In: Proceedings of the 23rd International Symposium on Graph Drawing and Net- work Visualization (GD). pp. 433–446. LNCS 9411 (2015)
2015
-
[20]
Computational Ge- ometry 37(3), 175–187 (2007)
van Kreveld, M., Speckmann, B.: On rectangular cartograms. Computational Ge- ometry 37(3), 175–187 (2007)
2007
-
[21]
United States Elections Project (Mar 2019)
McDonald, M.: Voter turnout data. United States Elections Project (Mar 2019)
2019
-
[22]
Computer Graphics Forum 38(3), 713–723 (2019)
Meulemans, W.: Efficient optimal overlap removal: Algorithms and experiments. Computer Graphics Forum 38(3), 713–723 (2019)
2019
-
[23]
IEEE Transactions on Visualization and Computer Graphics 23(1), 381–390 (2017)
Meulemans, W., Dykes, J., Slingsby, A., Turkay, C., Wood, J.: Small multiples with gaps. IEEE Transactions on Visualization and Computer Graphics 23(1), 381–390 (2017)
2017
-
[24]
Journal of Visual Languages & Computing 6(2), 183–210 (1995)
Misue, K., Eades, P., Lai, W., Sugiyama, K.: Layout adjustment and the mental map. Journal of Visual Languages & Computing 6(2), 183–210 (1995)
1995
-
[25]
AK Peters/CRC Press (2014)
Munzner, T.: Visualization analysis and design. AK Peters/CRC Press (2014)
2014
-
[26]
Computer Graphics Forum 35(3), 619–642 (2016)
Nusrat, S., Kobourov, S.: The state of the art in cartograms. Computer Graphics Forum 35(3), 619–642 (2016)
2016
-
[27]
Geographical Review 24(3), 292– 296 (1934)
Raisz, E.: The rectangular statistical cartogram. Geographical Review 24(3), 292– 296 (1934)
1934
-
[28]
In: Proceedings of the IEEE Symposium on Information Visualization (InfoVis)
Shneiderman, B., Wattenberg, M.: Ordered treemap layouts. In: Proceedings of the IEEE Symposium on Information Visualization (InfoVis). pp. 73–78 (2001)
2001
-
[29]
IEEE Transactions on Visualization and Computer Graphics 24(1), 729–738 (2018)
Sondag, M., Speckmann, B., Verbeek, K.: Stable treemaps via local moves. IEEE Transactions on Visualization and Computer Graphics 24(1), 729–738 (2018)
2018
-
[30]
Annals of New York Academy of Sciences 219, 215 – 220 (1973)
Tobler, W.: A continuous transformation useful for districting. Annals of New York Academy of Sciences 219, 215 – 220 (1973)
1973
-
[31]
In: Proceedings of the European Conference on Spatial Information Theory (COSIT)
Tversky, B.: Cognitive maps, cognitive collages, and spatial mental models. In: Proceedings of the European Conference on Spatial Information Theory (COSIT). pp. 14–24. LNCS 716 (1993)
1993
-
[32]
Bureau of Economic Analysis: Gross domestic product (gdp) by state
U.S. Bureau of Economic Analysis: Gross domestic product (gdp) by state. https: //bea.gov (Mar 2019)
2019
-
[33]
Census Bureau, Population Division: Annual estimates of the resident popu- lation (2018)
U.S. Census Bureau, Population Division: Annual estimates of the resident popu- lation (2018)
2018
-
[34]
Consider DCs with separation constraints H, V and two regions {r1,r 2}∈ T
Worldbank: Various world development indicators., https://data.worldbank.org Computing Stable Demers Cartograms 15 A Omitted proofs Lemma 2. Consider DCs with separation constraints H, V and two regions {r1,r 2}∈ T . Let (r1,r 2) be a minimal pair in H or V . Then, in any DC B...
2019
Reviewed August 14, 2026 · model on record in the stance chip above.
Discussion (0). Continue with ORCID to comment.