REVIEW 3 major objections 5 minor 1 cited by
Let the Tree Decide: FABART A Non-Parametric Factor Model
T0 review · 3 major / 5 minor · reviewed 2026-08-07 · deepseek-v4-flash
Pith's one-line read The paper proposes FABART, a factor-augmented VAR whose factor loadings are estimated by Bayesian additive regression trees, and claims that this nonparametric mapping improves industrial-production forecasts and reveals sign asymmetries…
desk verdict The sign-asymmetry claim cannot arise from the model as written: the BART nonlinearity is linearized away before the GIRFs are computed, even though the BART-in-FAVAR idea itself is worth a careful look. read the letter →
The pith
A machine-rendered reading of the paper's core claim, the machinery that carries it, and where it could break.
The reading
What carries the argument
The load-bearing object is the sum-of-trees function $f_i(Y_t)=\sum_{s=1}^{S} g_{is}(Y_t\mid \tau_{is},\mu_{iS})$ with $S=250$ regression trees, each a recursive binary partition of the factor space with constant terminal-node values, estimated under the BART regularizing prior by Metropolis-Hastings tree moves and Bayesian backfitting. What carries the argument is a two-step bridge: the fitted tree function is projected onto the observables through $\tilde A_i = F^\dagger X_i$, the Moore-Penrose projection of $X_i$ on the matrix of fitted nonlinear values $F$, producing a linear measurement equation $X_{i,t}=\tilde A_i' Y_t+\epsilon_{i,t}$ that permits Gaussian state-space draws of the latent factors. Impulse responses are then computed as generalized impulse response functions conditional on the long-run mean, which is how the paper lets shock sign and history enter the responses.
What would settle it
Fit the FABART model to a dataset generated by a known nonlinear factor model, then compute GIRFs two ways: through the linear projection $\tilde A_i = F^\dagger X_i$ and through direct simulation of the fitted BART function. If the linearized responses are statistically indistinguishable from a linear FAVAR's symmetric responses, or if the direct and projected responses diverge, the claimed sign asymmetry is not being carried by the model as described.
Extended reading notes
Core claim
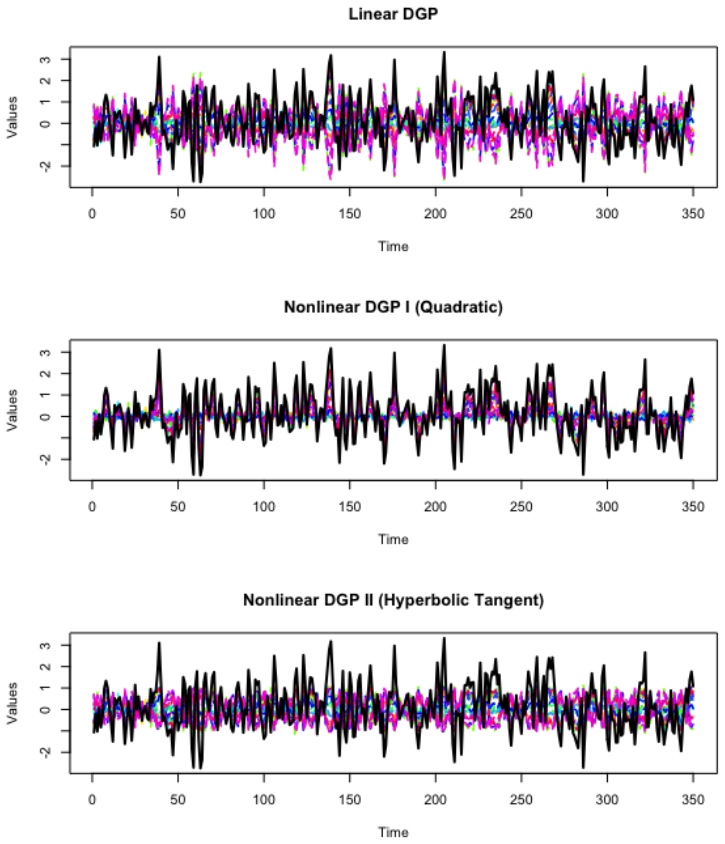
The central claim is that replacing the linear factor-loading equation with a sum-of-trees approximation, where each observable is a function of the latent factors estimated by 250 regularized regression trees, lets latent factors inherit nonlinear structure from the data and preserves that structure when computing generalized impulse responses. In the simulations, FABART delivers lower forecast errors for the latent factor than a linear FAVAR under a linear DGP and two nonlinear DGPs, and Monte Carlo replications show posterior factor estimates with average correlations above 0.96. In the empirical application, FABART improves forecasts of industrial production and keeps predictive densities stable during the COVID-19 period, while the linear BVAR and FAVAR benchmarks deteriorate. The paper's headline empirical finding is sign asymmetry in oil supply news shock transmission: positive shocks generate stronger and more persistent contractions in real activity and inflation than negative shocks generate expansions, and state-level employment contracts more after positive shocks than it improves after negative shocks.
Load-bearing premise
The sign-asymmetry result rests on the assumption that the linear projection $\tilde A_i = F^\dagger X_i$ used to draw the latent factors keeps the nonlinear information in the BART function; if the projection acts as an ordinary linear loading matrix, the measurement equation is linear, the impulse responses are symmetric, and the reported asymmetry cannot arise.
Editorial extensions
If this is right
- Under nonlinear data-generating processes, FABART recovers the latent factor with lower RMSE than a linear FAVAR and with posterior correlations above 0.96 across 100 Monte Carlo replications.
- In the empirical application, FABART forecasts U.S. industrial production with lower RMSE and better log scores than a linear BVAR and a linear FAVAR at one-, three-, and twelve-month horizons, and its density forecasts stay stable when the COVID-19 shock reaches the data.
- The estimated GIRFs imply that a positive oil supply news shock of 10 percent raises inflation and contracts U.S. and global industrial production more strongly and persistently than an equal-sized negative shock expands them.
- State-level employment responses show the same sign asymmetry: most states fall below the 45-degree symmetry line, and the average difference is significantly negative; manufacturing-heavy states contract more while mining-intensive states are more insulated.
- For real oil prices the forecast gains are small, and for financial variables such as the excess bond premium and the S&P 500 the linear BVAR remains competitive, so the nonparametric factor stage mainly helps real-activity forecasts and density stability.
Reading between the lines
- The reported sign asymmetry may partly come from the linear projection used to sample factors; a direct comparison of GIRFs from the full tree function against GIRFs from the projected linear measurement equation would show how much of the asymmetry is genuinely produced by the BART model.
- The same nonparametric factor-loading device could be applied to other observed factors, such as the federal funds rate or an uncertainty index, where the paper's identification strategy would transfer without change.
- The state-level cross-sectional regressions suggest a sectoral mechanism, but a panel GIRF design with time-varying state exposure could test whether the manufacturing-share channel is causal rather than a slow-moving proxy.
- Because the external instrument covers only part of the sample, the asymmetry estimates use a shorter identification window; extending the instrument or using narrative sign restrictions would reveal whether the result is sample-dependent.
Editorial analysis
A structured set of objections, weighed in public.
Referee Report
Summary. The paper proposes FABART, a factor-augmented VAR in which the measurement equation linking observables to latent factors is modeled with Bayesian additive regression trees. Estimation proceeds by constructing a linear approximation to the BART function and then drawing factors from a linear Gaussian state space via Carter-Kohn. The framework is applied to recursive forecasting of U.S. macro-financial variables and to generalized impulse responses to oil supply news shocks identified with the Känzig (2021) external instrument. The paper claims improved forecasts for industrial production, especially during the COVID-19 period, and pronounced sign asymmetries in the transmission of oil supply news shocks at both aggregate and state levels.
Significance. If the claims were valid, FABART would be a useful addition to the nonlinear factor-model literature and the empirical oil-shock literature, and the forecasting evidence for industrial production would be of practical interest. The paper engages with a relevant literature, spells out priors and the estimation algorithm in detail, and connects its results to existing theoretical explanations of oil-price asymmetries. However, the central empirical contribution—sign asymmetry in GIRFs—is not obtainable from the model as described, because the measurement equation used for inference and impulse responses is a linear projection of the BART fit, and the transition equation is linear Gaussian. The simulation evidence also labels a linear DGP as nonlinear. These issues affect the paper’s core claims rather than only its presentation.
major comments (3)
- [Sections 2.2.2 and 2.3.1, Eqs. (12)–(14)] The estimation algorithm replaces the BART function F(Y_t) with the linear approximation X_{i,t} = \tilde A_i' Y_t + e_{i,t}, where \tilde A_i = F^\dagger X_i, and the transition equation (2) is linear with Gaussian shocks. The Carter-Kohn step then conditions on this linear Gaussian state space. Consequently, the conditional expectation in the GIRF definition (14) is linear in the shock; for a positive and a negative shock of equal magnitude, the responses must be exact mirror images. The sign asymmetries reported in Section 4.3.1 and Figure 7 therefore cannot arise from the model as specified. The BART nonlinearity is not used in the GIRF simulation, so the reported asymmetry is not a model output but an artifact of the implemented procedure.
- [Section 3, Eq. (26)] The “quadratic nonlinearity” DGP is X_t = B^2 F_t + V_t. Since B is a fixed 20×1 vector, B^2 is a fixed set of loadings, and this equation is linear in the factor F_t; it does not introduce any nonlinearity or sign dependence. Only the tanh specification in Eq. (27) is genuinely nonlinear. The simulation and Monte Carlo sections therefore do not establish recovery under two distinct nonlinear DGPs; they compare one linear and one nonlinear DGP. The near-identical RMSEs for “Nonlinear I” and “Nonlinear II” in Table 2 (0.648 vs. 0.650) are unsurprising given this structure.
- [Section 4.2, Table 4 and Figures 2–3] The forecast evaluation reports RMSEs and log scores without any measure of uncertainty, such as standard errors, Diebold-Mariano tests, or Bayesian posterior intervals. For example, the industrial production 12-month RMSE improvement (1.725 vs. 2.773) is presented as a substantial gain, but without uncertainty quantification it is impossible to assess whether the difference is statistically meaningful. This is a load-bearing limitation for the forecasting claim, which is a prominent part of the abstract and conclusions.
minor comments (5)
- [Sections 2.3.2 and 2.3.3] The two subsections both provide the identification of oil price shocks and contain nearly identical equations; one appears to be a leftover draft version and should be removed.
- [Figure 7 note] The note describes the figure as illustrating “size asymmetry” while the surrounding text discusses sign asymmetry; the terminology should be made consistent.
- [Section 4.3.1 vs. Table 3] The text states that the structural analysis uses the pre-pandemic sample 1974:01–2016:12, while Table 3 and the dataset description report 1974M1–2024M08; the sample used for the GIRFs should be stated unambiguously.
- [Section 2.2.2, algorithm Step 5] Step 5 says “Conditional on the draws obtained in Steps 1.-5.”, which references itself; it should presumably refer to Steps 1–4.
- [General] The manuscript contains several typos, including “hightened”, “postive”, and “F ABART” in the title, and no replication code or data are provided, which is particularly unfortunate given that the GIRF results cannot be verified from the text alone.
Circularity Check
The 'nonparametric' factor loadings are by construction OLS projections and the state space used for inference is linear, so the claimed sign asymmetries are not derived from the model as specified.
-
self definitional
[Section 2.2.2, Eq. (12)]
"Without additional regularization, the projection naturally implies that F˜Ai ≈ Xi. ˜Ai allows to produce a linear approximation to the non-parametric multivariate model and obtain the elements of Γ Factor loadings matrix for each N-variable from the measurement equation (1), such that Xi,t = ˜Ai′Yt + ϵi,t (12)."
The model is introduced as nonlinear in Eq. (3), Xt = F(Yt)+ηt, but the loadings used in the measurement equation are defined as the Moore-Penrose/OLS projection A~i = F†Xi. This makes the 'recovery of nonlinear relationships' tautological: by construction F A~i ≈ Xi, so the loadings are the best linear fit to the same data. The BART nonlinear function F(Yt) does not enter the linear measurement equation (12) used for estimation; the claimed non-parametric factor model reduces to a linear FAVAR with OLS loadings.
-
other
[Section 2.3.1, Eq. (14); Section 2.2.2, Step 5]
"Based on this approximation to a linear model with Gaussian shocks the latent factors are drawn based on the Carter and Kohn (1994) algorithm. ... Since the model is nonlinear, the impulse responses are computed via Monte Carlo simulation, accounting for history-dependent effects and potential asymmetries in shock transmission."
The only state space described for posterior inference is linear: transition Eq. (2) is a Gaussian linear VAR and measurement Eq. (12) is linear. The GIRF in Eq. (14) is a difference of conditional expectations; for a linear Gaussian system the response to a positive shock is the exact mirror image of the response to a negative shock. The paper's central empirical result—pronounced sign asymmetries in Figures 7-8—is therefore not a property of the estimated model as specified; the 'nonlinearity' invoked to justify asymmetric GIRFs was removed by the Crawford projection in Eq. (12).
full rationale
The paper's claimed contribution is a nonparametric BART factor model, but the estimation section replaces the BART measurement equation with a linear projection (Eq. 12) and then draws latent factors with Carter-Kohn from the resulting linear Gaussian state space. Consequently, the simulation 'recovery' of loadings is an identity of the projection, and the state space used for inference is linear. The GIRF asymmetry, the headline empirical finding, cannot be derived from a linear transition and linear measurement as described; the paper does not specify any alternative nonlinear simulation step that would reintroduce the BART function. The forecast evaluation is genuinely out-of-sample and the external instrument of Känzig (2021) anchors identification, so the paper is not wholly circular; nevertheless, the central nonlinearity and asymmetry claims reduce, by the paper's own equations, to a linear model. A further technical issue (not circularity): the 'quadratic nonlinear' DGP in Eq. (26), Xt = B^2 Ft + Vt, is linear in Ft, so only the tanh DGP is actually nonlinear.
Assumptions & free parameters
free parameters (7)
- Number of factors J =
7
- Number of trees S =
250
- Prior hyperparameters alpha, beta, kappa =
0.95, 2, 2
- Prior tightness iota =
0.1
- Sum-of-coefficients prior tightness lambda =
10*iota
- Training sample length for prior means =
40 observations
- Shock size calibration =
10% oil price change
assumptions (4)
- ad hoc to paper The BART function F(Y) can be replaced by a linear projection \tilde A = F^dagger X without losing the nonlinear information relevant for impulse responses.
- domain assumption The external instrument m_t identifies the oil supply news shock and is orthogonal to other structural shocks.
- domain assumption Seven latent factors are sufficient to capture the common dynamics of the 187-variable panel.
- standard math The prior on tree structures (Chipman et al. 2010) regularizes the BART fit adequately.
Cite this review
Pith. "Pith review of Let the Tree Decide: FABART A Non-Parametric Factor Model." pith.science (2026). https://pith.science/paper/OUVISUCP
@misc{pith2026250611551,
  author       = {Pith},
  title        = {Pith review of: Let the Tree Decide: FABART A Non-Parametric Factor Model},
  year         = {2026},
  howpublished = {\url{https://pith.science/paper/OUVISUCP}},
  note         = {Machine review of arXiv:2506.11551}
}
read the original abstract
This article proposes a novel framework that integrates Bayesian Additive Regression Trees (BART) into a Factor-Augmented Vector Autoregressive (FAVAR) model to forecast macro-financial variables and examine asymmetries in the transmission of oil price shocks. By employing nonparametric techniques for dimension reduction, the model captures complex, nonlinear relationships between observables and latent factors that are often missed by linear approaches. A simulation experiment comparing FABART to linear alternatives and a Monte Carlo experiment demonstrate that the framework accurately recovers the relationship between latent factors and observables in the presence of nonlinearities, while remaining consistent under linear data-generating processes. The empirical application shows that FABART substantially improves forecast accuracy for industrial production relative to linear benchmarks, particularly during periods of heightened volatility and economic stress. In addition, the model reveals pronounced sign asymmetries in the transmission of oil supply news shocks to the U.S. economy, with positive shocks generating stronger and more persistent contractions in real activity and inflation than the expansions triggered by negative shocks. A similar pattern emerges at the U.S. federal state level, where negative shocks lead to modest declines in employment compared to the substantially larger contractions observed after positive shocks.
Figures


Figures from the paper (6 more)




Forward citations
Cited by 1 Pith paper
-
Clustered Local Projections for Short and Ultra-Short Time Series -- A Hierarchical Bayesian Framework
A hierarchical Bayesian local-projection estimator with sparse mixture clustering lets short and ultra-short time series borrow impulse-response information from longer, similar series, substantially reducing estimati...
Reference graph
Works this paper leans on
-
[1]
Alessandri, P. and Mumtaz, H. (2017). Financial conditions and density forecasts for US output and inflation . Review of Economic Dynamics , 24:66--78
work page 2017
-
[2]
Arce-Alfaro, G. (2025). The economic implications of oil supply uncertainty. Energy Economics , page 108425
work page 2025
- [3]
-
[4]
Balke, N. S., Brown, S. P., and Yucel, M. K. (2002). Oil price shocks and the us economy: Where does the asymmetry originate? The Energy Journal , 23(3)
work page 2002
-
[5]
Ba \'n bura, M., Giannone, D., and Reichlin, L. (2010). Large bayesian vector auto regressions. Journal of Applied Econometrics , 25(1):71--92
work page 2010
-
[6]
Baumeister, C. and Hamilton, J. D. (2019). Structural interpretation of vector autoregressions with incomplete identification: Revisiting the role of oil supply and demand shocks. American Economic Review , 109(5):1873--1910
work page 2019
-
[7]
Baumeister, C., Huber, F., and Marcellino, M. (2024). Risky oil: It's all in the tails. Technical report, National Bureau of Economic Research
work page 2024
-
[8]
Baumeister, C. and Kilian, L. (2015). Forecasting the real price of oil in a changing world: a forecast combination approach. Journal of Business & Economic Statistics , 33(3):338--351
work page 2015
Show all 53 references
-
[9]
Baumeister, C., Korobilis, D., and Lee, T. K. (2022). Energy markets and global economic conditions. Review of Economics and Statistics , 104(4):828--844
2022
-
[10]
Baumeister, C., Liu, P., and Mumtaz, H. (2013). Changes in the effects of monetary policy on disaggregate price dynamics. Journal of Economic Dynamics and Control , 37(3):543--560
2013
-
[11]
Berisha, E., Chisadza, C., Clance, M., and Gupta, R. (2021). Income inequality and oil resources: Panel evidence from the united states. Energy Policy , 159:112603
2021
-
[12]
S., Boivin, J., and Eliasz, P
Bernanke, B. S., Boivin, J., and Eliasz, P. (2005). Measuring the effects of monetary policy: a factor-augmented vector autoregressive (favar) approach. The Quarterly Journal of Economics , 120(1):387--422
2005
-
[13]
and Martinez-Bruera, P
Caravello, T. and Martinez-Bruera, P. (2024). Disentangling sign and size non-linearities. SSRN 4704050
2024
-
[14]
Carter, C. K. and Kohn, R. (1994). On gibbs sampling for state space models. Biometrika , 81(3):541--553
1994
-
[15]
A., George, E
Chipman, H. A., George, E. I., and McCulloch, R. E. (1998). Bayesian cart model search. Journal of the American Statistical Association , 93(443):935--948
1998
-
[16]
A., George, E
Chipman, H. A., George, E. I., and McCulloch, R. E. (2010). BART: Bayesian additive regression trees . The Annals of Applied Statistics , 4(1):266--298
2010
-
[17]
R., Runcie, D
Crawford, L., Flaxman, S. R., Runcie, D. E., and West, M. (2019). Variable prioritization in nonlinear black box methods: A genetic association case study . The annals of applied statistics , 13(2):958
2019
-
[18]
C., Zhou, X., and Mukherjee, S
Crawford, L., Wood, K. C., Zhou, X., and Mukherjee, S. (2018). Bayesian approximate kernel regression with variable selection. Journal of the American Statistical Association , 113(524):1710--1721
2018
-
[19]
and Otrok, C
Del Negro, M. and Otrok, C. (2008). Dynamic factor models with time-varying parameters: measuring changes in international business cycles. FRB of New York Staff Report , (326)
2008
-
[20]
Doan, T., Litterman, R., and Sims, C. (1984). Forecasting and conditional projection using realistic prior distributions . Econometric Reviews , 3(1):1--100
1984
-
[21]
J., Chen, L., and Gonzalo, J
Dolado, J. J., Chen, L., and Gonzalo, J. (2020). Quantile factor models
2020
-
[22]
Forni, M., Franconi, A., Gambetti, L., and Sala, L. (2023). Asymmetric transmission of oil supply news. Technical report, CEPR Discussion Papers
2023
-
[23]
Friedman, J. H. (2001). Greedy function approximation: a gradient boosting machine. Annals of statistics , pages 1189--1232
2001
-
[24]
and Amisano, G
Geweke, J. and Amisano, G. (2010). Comparing and evaluating Bayesian predictive distributions of asset returns . International Journal of Forecasting , 26(2):216--230
2010
-
[25]
Hamilton, J. D. (2003). What is an oil shock? Journal of econometrics , 113(2):363--398
2003
-
[26]
Hauzenberger, N., Huber, F., and Klieber, K. (2023). Real-time inflation forecasting using non-linear dimension reduction techniques. International Journal of Forecasting , 39(2):901--921
2023
-
[27]
Huber, F., Koop, G., Onorante, L., Pfarrhofer, M., and Schreiner, J. (2020). Nowcasting in a pandemic using non-parametric mixed frequency VARs . Journal of Econometrics
2020
-
[28]
and Rossini, L
Huber, F. and Rossini, L. (2022). Inference in Bayesian additive vector autoregressive tree models . The Annals of Applied Statistics , 16(1):104--123
2022
-
[29]
Ish-Horowicz, J., Udwin, D., Flaxman, S., Filippi, S., and Crawford, L. (2019). Interpreting deep neural networks through variable importance. arXiv preprint arXiv:1901.09839
2019 arXiv
-
[30]
Jacquinot, P., Kuismanen, M., Mestre, R., and Spitzer, M. (2009). An assessment of the inflationary impact of oil shocks in the euro area. The Energy Journal , 30(1):49--84
2009
-
[31]
K \"a nzig, D. R. (2021). The macroeconomic effects of oil supply news: Evidence from opec announcements. American Economic Review , 111(4):1092--1125
2021
-
[32]
Kase, N., Melosi, L., and Rottner, M. (2025). Estimating nonlinear heterogeneous agent models with neural networks. BIS Working Papers 1241, Bank for International Settlements
2025
-
[33]
H., and Potter, S
Koop, G., Pesaran, M. H., and Potter, S. M. (1996). Impulse response analysis in nonlinear multivariate models. Journal of econometrics , 74(1):119--147
1996
-
[34]
Korobilis, D. (2013). Assessing the transmission of monetary policy using time-varying parameter dynamic factor models. Oxford Bulletin of Economics and Statistics , 75(2):157--179
2013
-
[35]
and Schr \"o der, M
Korobilis, D. and Schr \"o der, M. (2024). Monitoring multi-country macroeconomic risk: A quantile factor-augmented vector autoregressive (qfavar) approach. Journal of Econometrics , page 105730
2024
-
[36]
Litterman, R. B. (1986a). Forecasting with bayesian vector autoregressions—five years of experience. Journal of Business & Economic Statistics , 4(1):25--38
1986
-
[37]
Litterman, R. B. (1986b). A statistical approach to economic forecasting. Journal of Business & Economic Statistics , 4(1):1--4
1986
-
[38]
McCracken, M. W. and Ng, S. (2016). Fred-md: A monthly database for macroeconomic research. Journal of Business & Economic Statistics , 34(4):574--589
2016
-
[39]
Miescu, M., Mumtaz, H., and Theodoridis, K. (2024). Nonlinear dynamics of large oil supply news shocks. Cardiff Economics Working Papers
2024
-
[40]
and Ricco, G
Miranda-Agrippino, S. and Ricco, G. (2023). Identification with external instruments in structural vars. Journal of Monetary Economics , 135:1--19
2023
-
[41]
Mohammed, R. I. and Mohammad, A. A. (2022). Stability conditions for limit cycle of smooth transition hyperbolic tangent autoregressive model. Journal of Algebraic Statistics , 13(2):2346--2357
2022
-
[42]
Mumtaz, H. (2010). Evolving UK macroeconomic dynamics: a time-varying factor augmented VAR . Bank of England Working Paper
2010
-
[43]
and Piffer, M
Mumtaz, H. and Piffer, M. (2022). Impulse response estimation via flexible local projections. arXiv preprint arXiv:2204.13150
2022 arXiv
-
[44]
Mumtaz, H., Sunder-Plassmann, L., and Theophilopoulou, A. (2018). The state-level impact of uncertainty shocks. Journal of Money, Credit and Banking , 50(8):1873--1913
2018
-
[45]
and Surico, P
Mumtaz, H. and Surico, P. (2012). Evolving international inflation dynamics: world and country-specific factors. Journal of the European Economic Association , 10(4):716--734
2012
-
[46]
Mumtaz, H., Theophilopoulou, A., and Drossidis, T. (2024). The distributional effects of oil supply news shocks. Economics Letters , 240:111769
2024
-
[47]
and Xiong, Y
Pelger, M. and Xiong, Y. (2022). State-dependent factor models for us bond yields and stock returns. Journal of Financial Economics , 144:730--748
2022
-
[48]
Robertson, J. C. and Tallman, E. W. (1999). Vector autoregressions: forecasting and reality . Economic Review-Federal Reserve Bank of Atlanta , 84(1):4
1999
-
[49]
Sami, H. M. and Rahman, M. M. (2021). Determining the best activation functions for predicting stock prices in different stock exchanges through multivariable time series forecasting of lstm. American Journal of Engineering and Information Technology , 3(1):1--12
2021
-
[50]
Sims, C. A. (1992). Interpreting the macroeconomic time series facts: The effects of monetary policy. European economic review , 36(5):975--1000
1992
-
[51]
Sims, C. A. and Zha, T. (1999). Error bands for impulse responses. Econometrica , 67(5):1113--1155
1999
-
[52]
Stock, J. H. and Watson, M. W. (2002). Forecasting using principal components from a large number of predictors. Journal of the American statistical association , 97(460):1167--1179
2002
-
[53]
Stock, J. H. and Watson, M. W. (2005). Implications of dynamic factor models for var analysis. Technical report, National Bureau of Economic Research
2005
Reviewed August 7, 2026 · model on record in the stance chip above.
Discussion (0). Continue with ORCID to comment.