The three-dimensional shapes of the galaxy cluster intracluster medium in eRASS1
Pith reviewed 2026-06-26 23:05 UTC · model grok-4.3
The pith
Galaxy clusters in eRASS1 most likely have prolate three-dimensional shapes with axial ratios 1.51 and 1.17.
A machine-rendered reading of the paper's core claim, the machinery that carries it, and where it could break.
Core claim
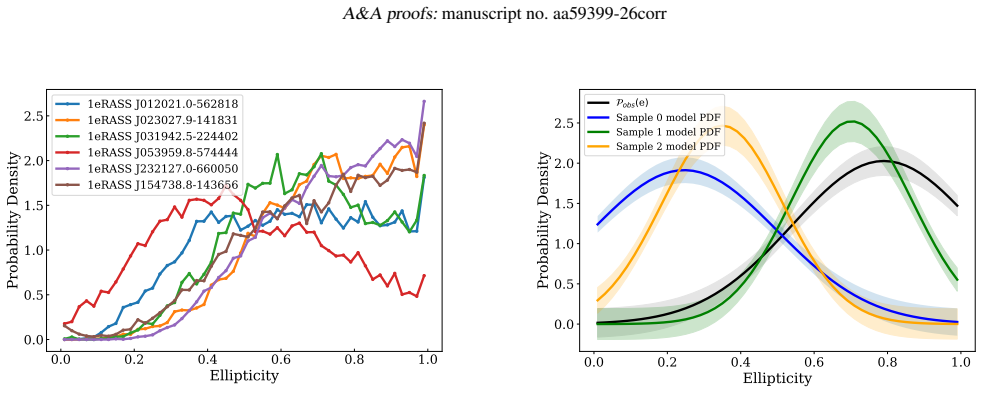
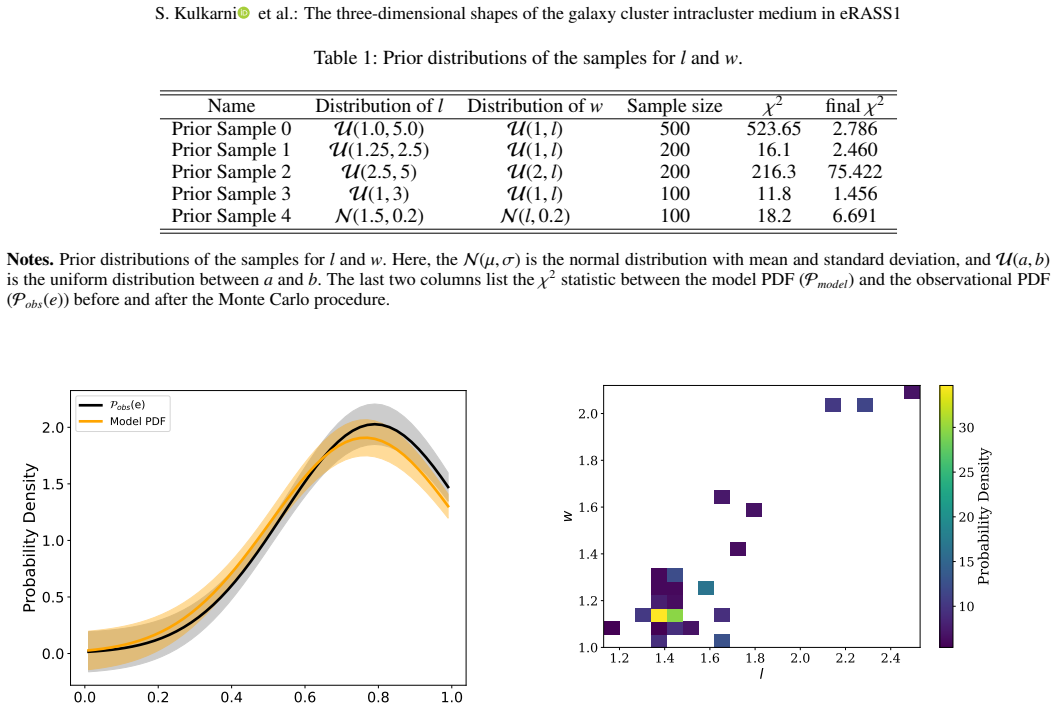
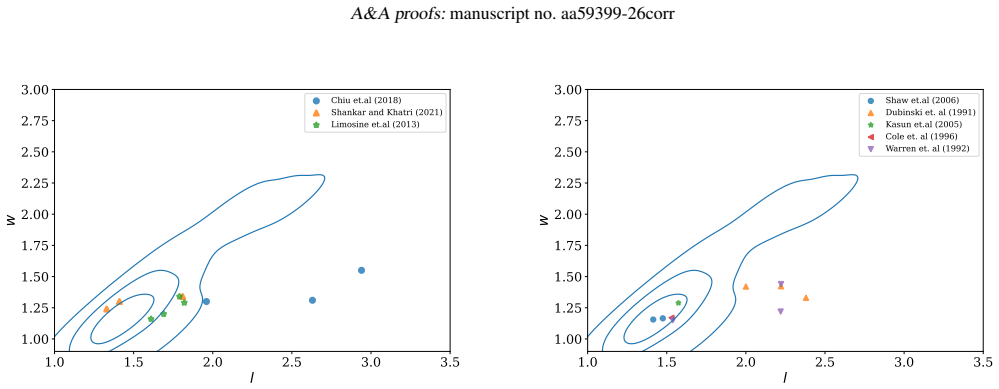
The ellipticity PDF of the eRASS1 clusters is described by a normal distribution with mean 0.79 and standard deviation 0.25. Comparing this to the ellipticity distributions obtained from Monte Carlo projections of populations with varying three-dimensional axial ratios l = L/T and w = W/T yields a most probable shape of (l, w) = (1.51 ± 0.27, 1.17 ± 0.27), with prolate shapes preferred over oblate shapes.
What carries the argument
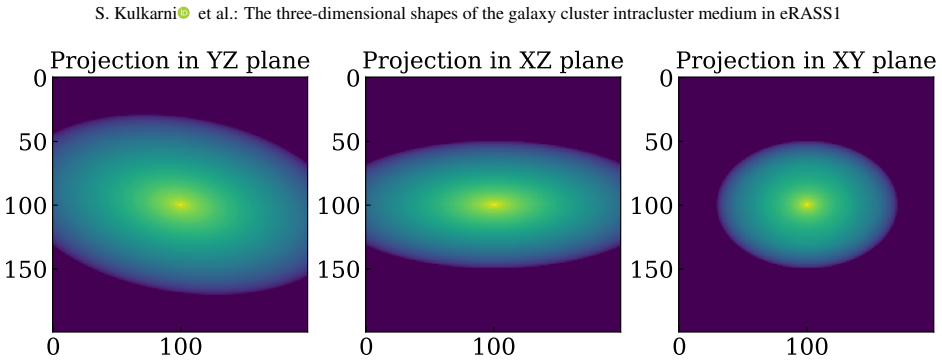
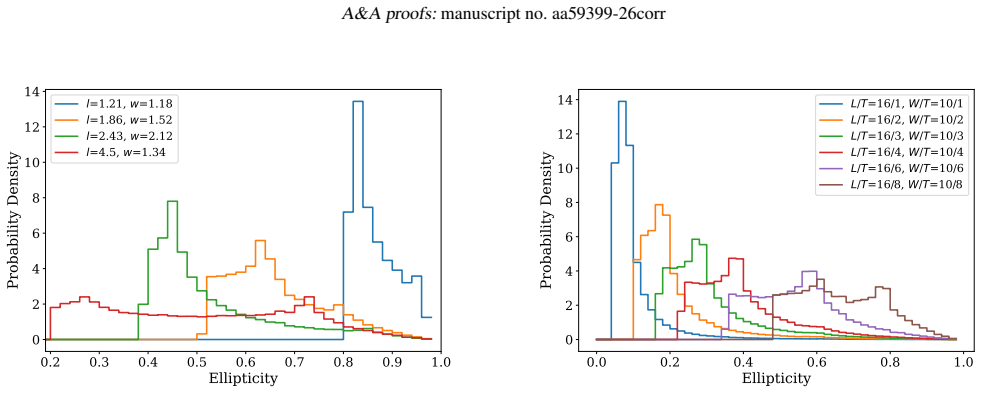
Stereology through Monte Carlo simulation of projected ellipticities from a triaxial ellipsoid population, used to match the observed ellipticity PDF and thereby constrain the axial ratios.
If this is right
- The derived shape parameters supply a population-level prior for triaxial models in cosmological analyses.
- The same prior can be adopted in weak-lensing mass calibration and intracluster-medium studies.
- Prolate preference implies that spherical or oblate assumptions in some cluster models should be updated.
- The constraint is obtained from X-ray imaging alone and does not require optical or SZ follow-up.
Where Pith is reading between the lines
- Adopting this prior could reduce scatter in cluster mass estimates used for dark-energy constraints.
- Future application to redshift-binned subsamples would test whether the preferred shape evolves with cosmic time.
- Comparison with hydrodynamical simulations could reveal whether the prolate bias traces specific accretion or merger histories.
Load-bearing premise
The observed ellipticity distribution can be reproduced by a simple Monte-Carlo projection of a single triaxial population without significant contamination from selection effects, measurement bias, or line-of-sight structure.
What would settle it
Independent three-dimensional shape constraints on a comparable cluster sample, obtained via gravitational lensing or Sunyaev-Zeldovich effect tomography, that yield axial ratios inconsistent with (1.51, 1.17) at high significance.
Figures
read the original abstract
The three-dimensional shapes of clusters are important for understanding the astrophysics of the clusters and as a probe in cosmological studies. We estimate the most probable three-dimensional shape of galaxy clusters in the first eROSITA All-sky survey eRASS1 using stereology. Our sample is the largest well-defined sample of clusters, and the most probable shape estimated using our method can be used as a prior for cluster shape models in cosmological, cluster, and weak lensing studies. The first all-sky survey with SRG/ eROSITA resulted in a sample of approximately 12,000 optically confirmed galaxy groups and clusters. We used a well-defined subsample of 3254 clusters from the eRASS1 survey and estimated the most probable shape of the clusters by constraining the probability density function (PDF) of the ellipticity of the clusters. We simulated the projected appearance of clusters with a distribution of three-dimensional shapes (prolate and oblate) and obtained the distribution of their ellipticity. This distribution was then compared with the measured distribution of ellipticities from the eRASS1 cluster sample to infer the three-dimensional shapes consistent with the data. We used Monte Carlo methods to estimate the most probable axial ratios l, w, where l $\equiv$ L/T ,w $\equiv$ W/T , and L, W, T are major, intermediate, and minor axes of the cluster. We did not require any additional probe (optical, SZ, etc.) to constrain the probable shape of the clusters. We describe the ellipticity PDF of the eRASS1 clusters with a normal distribution mean ($\mu$) = 0.79 and a standard deviation ($\sigma$) = 0.25. The most probable shape of the clusters in our eRASS1 subsample is estimated to be (l, w) = (1.51 $\pm$ 0.27, 1.17 $\pm$ 0.27), with prolate shapes being preferred over oblate shapes.
Editorial analysis
A structured set of objections, weighed in public.
Referee Report
Summary. The paper estimates the most probable 3D shape of galaxy clusters from a subsample of 3254 eRASS1 clusters by modeling the observed projected ellipticity PDF as a normal distribution (μ=0.79, σ=0.25) and matching it via Monte Carlo stereology to the projected ellipticities of a single fixed triaxial population with axial ratios (l,w) where l=L/T and w=W/T. It reports a best-fit shape of (1.51±0.27, 1.17±0.27) with a preference for prolate over oblate ellipsoids, without using additional probes such as SZ or weak lensing.
Significance. If the central assumptions hold, the result supplies a large-sample, observationally derived prior on cluster shapes that can be used in cosmological analyses, weak-lensing mass calibration, and ICM modeling. The sample size and the purely X-ray/optical selection are strengths; the Monte Carlo projection method itself is standard in the field.
major comments (3)
- [Abstract] Abstract and method paragraphs: the inference that a single fixed (l,w) population reproduces the observed ellipticity PDF rests on the untested assumption that the eRASS1 X-ray detection plus optical confirmation pipeline introduces no differential selection or measurement bias correlated with projected ellipticity. No simulation or quantitative bound on this effect is provided, which directly affects the recovered (1.51±0.27, 1.17±0.27) values.
- [Abstract] Abstract: the quoted uncertainties ±0.27 on l and w are presented without a description of how they are obtained from the Monte Carlo matching (e.g., whether they are formal fitting errors, bootstrap widths, or marginal posteriors). This is load-bearing for any claim of statistical preference between prolate and oblate shapes.
- [Method] Method description: the comparison is performed with a single normal distribution for the observed ellipticities; no test is shown for whether the data deviate from normality or whether a mixture of shapes would be required, which could alter the inferred axial ratios.
minor comments (2)
- [Abstract] Define the axes L, W, T explicitly at first use and clarify whether the Monte Carlo draws orientations uniformly or with any weighting.
- [Abstract] The statement that 'no additional probe is required' should be qualified by noting that the result still depends on the fidelity of the ellipticity measurements themselves.
Simulated Author's Rebuttal
We thank the referee for the constructive report and the recommendation for major revision. We address each major comment below and indicate the changes planned for the revised manuscript.
read point-by-point responses
-
Referee: [Abstract] Abstract and method paragraphs: the inference that a single fixed (l,w) population reproduces the observed ellipticity PDF rests on the untested assumption that the eRASS1 X-ray detection plus optical confirmation pipeline introduces no differential selection or measurement bias correlated with projected ellipticity. No simulation or quantitative bound on this effect is provided, which directly affects the recovered (1.51±0.27, 1.17±0.27) values.
Authors: We agree that differential selection or measurement bias correlated with projected ellipticity is a relevant systematic that is not quantified in the current analysis. The subsample is defined by the eRASS1 X-ray detection and optical confirmation criteria, and we have treated the resulting ellipticity distribution as representative of the underlying population. A dedicated end-to-end simulation of the selection pipeline would be required to place a quantitative bound, which is beyond the scope of the present work. In the revised manuscript we will add an explicit discussion of this assumption and its possible impact on the inferred axial ratios as a caveat. revision: partial
-
Referee: [Abstract] Abstract: the quoted uncertainties ±0.27 on l and w are presented without a description of how they are obtained from the Monte Carlo matching (e.g., whether they are formal fitting errors, bootstrap widths, or marginal posteriors). This is load-bearing for any claim of statistical preference between prolate and oblate shapes.
Authors: The quoted uncertainties were obtained from the Monte Carlo procedure by identifying the range of (l,w) values whose projected ellipticity distributions remain statistically consistent with the observed normal distribution at the adopted tolerance. We acknowledge that the abstract does not describe this procedure. In the revised version we will expand the method section to detail the uncertainty estimation and will add a brief corresponding sentence to the abstract. revision: yes
-
Referee: [Method] Method description: the comparison is performed with a single normal distribution for the observed ellipticities; no test is shown for whether the data deviate from normality or whether a mixture of shapes would be required, which could alter the inferred axial ratios.
Authors: The ellipticity PDF is modeled as a single normal distribution with the quoted parameters. No explicit test of normality (e.g., Kolmogorov-Smirnov) or exploration of shape mixtures was performed in the submitted manuscript. We will add such a test to the revised analysis and discuss whether deviations from normality would materially change the recovered (l,w) values. revision: yes
Circularity Check
No circularity: forward-model fit of triaxial parameters to independently measured ellipticity PDF
full rationale
The derivation measures the observed ellipticity PDF directly from the eRASS1 sample (fit as normal with μ=0.79, σ=0.25) and then performs Monte Carlo projection of a single triaxial population to find the (l,w) values whose projected ellipticity distribution matches the data. No equation or step defines the output axial ratios in terms of the input PDF parameters, renames a known result, or reduces the inference to a self-citation chain. The method is a standard statistical forward fit whose central claim remains independent of its inputs.
Axiom & Free-Parameter Ledger
free parameters (2)
- mean and sigma of observed ellipticity normal distribution
- axial ratios l and w
axioms (2)
- domain assumption Clusters can be modeled as triaxial ellipsoids with random orientations
- domain assumption The observed ellipticity distribution is adequately described by a single normal PDF
Reference graph
Works this paper leans on
-
[1]
2025, A&A, 696, A5
Artis, E., Bulbul, E., Grandis, S., et al. 2025, A&A, 696, A5
2025
-
[2]
2024, A&A, 691, A301
Artis, E., Ghirardini, V ., Bulbul, E., et al. 2024, A&A, 691, A301
2024
-
[3]
Basilakos, S., Plionis, M., & Maddox, S. J. 2000, MNRAS, 316, 779
2000
-
[4]
S., Shandarin, S
Bharadwaj, S., Sahni, V ., Sathyaprakash, B. S., Shandarin, S. F., & Yess, C. 2000, ApJ, 528, 21
2000
-
[5]
2022, A&A, 661, A1
Brunner, H., Liu, T., Lamer, G., et al. 2022, A&A, 661, A1
2022
-
[6]
2024, A&A, 685, A106
Bulbul, E., Liu, A., Kluge, M., et al. 2024, A&A, 685, A106
2024
-
[7]
Buote, D. A. & Canizares, C. R. 1992, ApJ, 400, 385
1992
-
[8]
Buote, D. A. & Tsai, J. C. 1995, ApJ, 452, 522
1995
-
[9]
& Metcalfe, N
Carter, D. & Metcalfe, N. 1980, MNRAS, 191, 325
1980
-
[10]
2008, A&A, 487, 75
Chakrabarty, D., de Filippis, E., & Russell, H. 2008, A&A, 487, 75
2008
-
[11]
W., Melott, A
Chambers, S. W., Melott, A. L., & Miller, C. J. 2002, ApJ, 565, 849
2002
-
[12]
2018, ApJ, 860, 126
Chiu, I.-N., Umetsu, K., Sereno, M., et al. 2018, ApJ, 860, 126
2018
-
[13]
& Lacey, C
Cole, S. & Lacey, C. 1996, MNRAS, 281, 716
1996
-
[14]
& Carlberg, R
Dubinski, J. & Carlberg, R. G. 1991, ApJ, 378, 496
1991
-
[15]
Eisenstein, D. J. & Loeb, A. 1995, ApJ, 439, 520
1995
-
[16]
2013, Space Sci
Ettori, S., Donnarumma, A., Pointecouteau, E., et al. 2013, Space Sci. Rev., 177, 119
2013
-
[17]
1984, ApJ, 286, 186
Fabricant, D., Rybicki, G., & Gorenstein, P. 1984, ApJ, 286, 186
1984
-
[18]
Gassis, R., Bayliss, M. B., Sharon, K., et al. 2023, arXiv e-prints, arXiv:2310.18250
arXiv 2023
-
[19]
2005, A&A, 443, 793
Gavazzi, R. 2005, A&A, 443, 793
2005
-
[20]
E., Bulbul, E., et al
Ghirardini, V ., Bahar, Y . E., Bulbul, E., et al. 2022, A&A, 661, A12
2022
-
[21]
2024, A&A, 689, A298
Ghirardini, V ., Bulbul, E., Artis, E., et al. 2024, A&A, 689, A298
2024
-
[22]
2022, MNRAS, 513, 2178
Herbonnet, R., Crawford, A., Avestruz, C., et al. 2022, MNRAS, 513, 2178
2022
-
[23]
& Ikeuchi, S
Hirayama, Y . & Ikeuchi, S. 1978, Progress of Theoretical Physics, 60, 1337
1978
-
[24]
2006, ApJ, 647, 8
Ho, S., Bahcall, N., & Bode, P. 2006, ApJ, 647, 8
2006
-
[25]
2002, arXiv e-prints, astro
Jetzer, P., Koch, P., Piffaretti, R., Puy, D., & Schindler, S. 2002, arXiv e-prints, astro
2002
-
[26]
Kasun, S. F. & Evrard, A. E. 2005, ApJ, 629, 781
2005
-
[27]
2024, A&A, 688, A210
Kluge, M., Comparat, J., Liu, A., et al. 2024, A&A, 688, A210
2024
-
[28]
Kravtsov, A. V . & Borgani, S. 2012, ARA&A, 50, 353
2012
-
[29]
T., Hearin, A
Lau, E. T., Hearin, A. P., Nagai, D., & Cappelluti, N. 2021, MNRAS, 500, 1029
2021
-
[30]
& Suto, Y
Lee, J. & Suto, Y . 2003, ApJ, 585, 151
2003
-
[31]
2013, Space Sci
Limousin, M., Morandi, A., Sereno, M., et al. 2013, Space Sci. Rev., 177, 155
2013
-
[32]
2022, A&A, 661, A2
Liu, A., Bulbul, E., Ghirardini, V ., et al. 2022, A&A, 661, A2
2022
-
[33]
T., Martin, R., Pratt, N
MacGillivray, H. T., Martin, R., Pratt, N. M., et al. 1976, MNRAS, 176, 649
1976
-
[34]
2015, MNRAS, 447, L55
Makarenko, I., Fletcher, A., & Shukurov, A. 2015, MNRAS, 447, L55
2015
-
[35]
2024, A&A, 682, A34
Merloni, A., Lamer, G., Liu, T., et al. 2024, A&A, 682, A34
2024
-
[36]
A., Dong, F., Koester, B
Niederste-Ostholt, M., Strauss, M. A., Dong, F., Koester, B. P., & McKay, T. A. 2010, MNRAS, 405, 2023
2010
-
[37]
B., Dahle, H., et al
Oguri, M., Bayliss, M. B., Dahle, H., et al. 2012, MNRAS, 420, 3213
2012
-
[38]
Oguri, M., Takada, M., Okabe, N., & Smith, G. P. 2010, MNRAS, 405, 2215
2010
-
[39]
2015, A&A, 575, A127
Parekh, V ., van der Heyden, K., Ferrari, C., Angus, G., & Holwerda, B. 2015, A&A, 575, A127
2015
-
[40]
D., & Frenk, C
Plionis, M., Barrow, J. D., & Frenk, C. S. 1991, MNRAS, 249, 662
1991
-
[41]
L., Borgani, S., et al
Ragone-Figueroa, C., Granato, G. L., Borgani, S., et al. 2020, MNRAS, 495, 2436
2020
-
[42]
Rood, H. J. & Sastry, G. N. 1972, AJ, 77, 451
1972
-
[43]
2023, A&A, 669, A29
Rosselli, D., Marulli, F., Veropalumbo, A., Cimatti, A., & Moscardini, L. 2023, A&A, 669, A29
2023
-
[44]
S., Bahar, Y
Sanders, J. S., Bahar, Y . E., Bulbul, E., et al. 2025, A&A, 695, A160
2025
-
[45]
S., Fabian, A
Sanders, J. S., Fabian, A. C., Russell, H. R., & Walker, S. A. 2018, MNRAS, 474, 1065
2018
-
[46]
D., Frenk, C
Schneider, M. D., Frenk, C. S., & Cole, S. 2012, J. Cosmology Astropart. Phys., 2012, 030
2012
-
[47]
2024, A&A, 686, A196
Seppi, R., Comparat, J., Ghirardini, V ., et al. 2024, A&A, 686, A196
2024
-
[48]
2007, MNRAS, 380, 1207
Sereno, M. 2007, MNRAS, 380, 1207
2007
-
[49]
& Umetsu, K
Sereno, M. & Umetsu, K. 2011, MNRAS, 416, 3187
2011
-
[50]
& Khatri, R
Shankar, S. & Khatri, R. 2021, MNRAS, 503, 2791
2021
-
[51]
D., Weller, J., Ostriker, J
Shaw, L. D., Weller, J., Ostriker, J. P., & Bode, P. 2006, ApJ, 646, 815
2006
-
[52]
& Binney, J
Strimpel, O. & Binney, J. 1979, MNRAS, 188, 883
1979
-
[53]
2025, A&A, 694, A107
Veronesi, I., Bartalucci, I., Rasia, E., et al. 2025, A&A, 694, A107
2025
-
[54]
2006, ApJ, 640, 691
Vikhlinin, A., Kravtsov, A., Forman, W., et al. 2006, ApJ, 640, 691
2006
-
[55]
2014, in IAU Symposium, V ol
Vinci, G., Freeman, P., Newman, J., Wasserman, L., & Genovese, C. 2014, in IAU Symposium, V ol. 306, Statistical Challenges in 21st Century Cosmology, ed. A. Heavens, J.-L. Starck, & A. Krone-Martins, 68–71
2014
-
[56]
S., Quinn, P
Warren, M. S., Quinn, P. J., Salmon, J. K., & Zurek, W. H. 1992, ApJ, 399, 405
1992
-
[57]
White, S. D. M. & Silk, J. 1979, ApJ, 231, 1
1979
-
[58]
H., & Hjorth, J
Wojtak, R., Hansen, S. H., & Hjorth, J. 2011, Nature, 477, 567
2011
-
[59]
Yuan, Z. S. & Han, J. L. 2020, MNRAS, 497, 5485 Zel’dovich, Y . B. 1970, A&A, 5, 84 Article number, page 9 of 9
2020
discussion (0)
Sign in with ORCID, Apple, or X to comment. Anyone can read and Pith papers without signing in.